Domingo Faustino Sarmiento Airport
| Domingo Faustino Sarmiento Airport Aeropuerto de San Juan – Domingo Faustino Sarmiento | |||||||||||
|---|---|---|---|---|---|---|---|---|---|---|---|
 | |||||||||||
| IATA: UAQ – ICAO: SANU | |||||||||||
| Summary | |||||||||||
| Airport type | Public / Militar | ||||||||||
| Operator | Government and Aeropuertos Argentina 2000 | ||||||||||
| Serves | San Juan | ||||||||||
| Location | Ruta N20, km12. (J5417) 9 DE JULIO – San Juan | ||||||||||
| Elevation AMSL | 1,957 ft / 597 m | ||||||||||
| Coordinates | 31°37′19″S 68°25′23″W / 31.62194°S 68.42306°WCoordinates: 31°37′19″S 68°25′23″W / 31.62194°S 68.42306°W | ||||||||||
| Map | |||||||||||
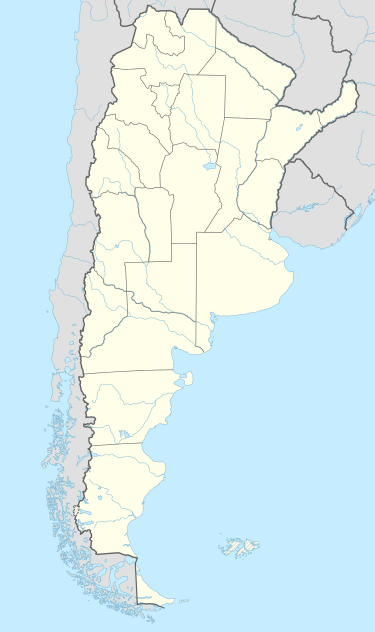 UAQ Location of airport in Argentina | |||||||||||
| Runways | |||||||||||
| |||||||||||
| Statistics (2010) | |||||||||||
| |||||||||||
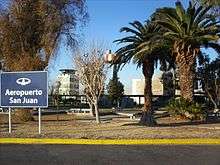
Domingo Faustino Sarmiento Airport (Spanish: Aeropuerto de San Juan – Domingo Faustino Sarmiento) (IATA: UAQ, ICAO: SANU) is an airport in San Juan Province, Argentina serving the cities of San Juan. It is served by 3 airlines.
Planning to build San Juan Airport started on 15 February 1958. The plans were authorized in 1961, and the construction started in 1971, and almost finished by 1977, but it was completely destroyed with Caucete Earthquake in 1977, reconstructed between 1977 and 1980. The new and actual airport was inaugurated 25 February 1981 (after 20 years of planning). In 2007 it served to 68,756 passengers.
It consists of 110,700 m² of runways, 16,800m² of taxiways, a 2,200m² terminal, and parking place for 80 cars. It is operated by Aeropuertos Argentina 2000.
Airlines and destinations
Passenger
Statistics
| Passengers | Change from previous year | Aircraft operations | Change from previous year | Cargo (metric tons) | Change from previous year | |
|---|---|---|---|---|---|---|
| 2005 | 63,706 | | 1,457 | | 347 | |
| 2006 | 67,715 | | 1,252 | | 384 | |
| 2007 | 68,756 | | 1,278 | | 346 | |
| 2008 | 68,858 | | 1,350 | | 306 | |
| 2009 | 104,980 | | 1,515 | | 303 | |
| 2010 | 131,047 | | 2,451 | | 418 | |
| Source: Airports Council International. World Airport Traffic Statistics (Years 2005-2010) | ||||||
References
- ↑ Airport Council International 2010 World Airport Traffic Report