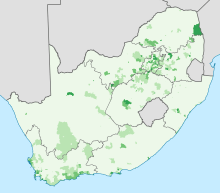
Distribution of white South Africans
|
0–20%
20–40%
40–60% |
60–80%
80–100% |

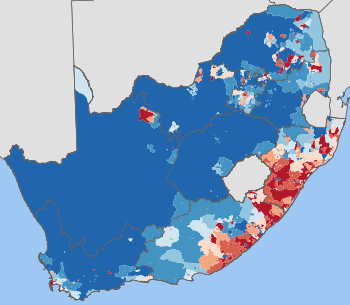
|
<1 /km²
1–3 /km²
3–10 /km²
10–30 /km²
30–100 /km² |
100–300 /km²
300–1000 /km²
1000–3000 /km²
>3000 /km² |
The distribution of white South Africans is fairly evenly spread. They currently make up between 8 and 9% of the total population and number around 4.5–5 million. They are found in large numbers in practically every province in South Africa, although always as a minority, and are high in concentration in large cities.
Historically in the pre-1994 provinces, the Transvaal and Orange Free State were predominantly Afrikaans-speaking, Natal was mostly English-speaking, while the Cape Province was largely mixed.
By province
Afrikaners are located in all parts of the nation, apart from the homelands such as Transkei and KwaZulu, where they are very small in number. English-speaking whites are generally concentrated in Natal, Johannesburg and major settlements in the Cape. Other white groups (such as Portuguese and Germans) live mostly in Johannesburg or Cape Town. In the homelands, the white populations are so tiny, that even the slightest population can affect how Afrikaans or English speaking they are. Of the largest cities in the country, Johannesburg, Cape Town, Durban, East London and Pietermaritzburg are largely English speaking in the core, while Pretoria, Bloemfontein, Kimberley, Polokwane, Nelspruit, Witbank and Rustenburg are predominantly Afrikaans speaking. Port Elizabeth is largely mixed.
| Province | Afrikaans | % Afrikaans | English | % English | Other | % Other | Total |
|---|---|---|---|---|---|---|---|
| Eastern Cape | 149,395 | 48.8% | 153,434 | 50.2% | 3,010 | 1.0% | 305,839 |
| Free State | 214,020 | 89.6% | 22,225 | 9.3% | 2,544 | 1.1% | 238,789 |
| Gauteng | 984,472 | 56.7% | 716,403 | 41.3% | 34,219 | 2.0% | 1,735,094 |
| KwaZulu-Natal | 115,721 | 24.0% | 357,200 | 74.1% | 9,193 | 1.9% | 482,114 |
| Limpopo | 115,921 | 87.5% | 14,898 | 11.3% | 1,602 | 1.2% | 132,421 |
| Mpumalanga | 164,620 | 83.5% | 29,678 | 15.1% | 2,780 | 1.4% | 197,078 |
| North West | 237,598 | 89.0% | 26,346 | 9.9% | 2,940 | 1.1% | 266,884 |
| Northern Cape | 93,637 | 91.3% | 7,737 | 7.5% | 1,144 | 1.1% | 102,518 |
| Western Cape | 461,522 | 55.4% | 359,738 | 43.2% | 11,639 | 1.4% | 832,899 |
| Total | 2,536,906 | 59.1% | 1,687,659 | 39.3% | 69,071 | 1.6% | 4,293,636 |
Eastern Cape
The Eastern cape has one of the lowest percentages of whites in South Africa, which is currently around 4.7%. They number just above 300,000. Similarly to the Limpopo province, whites as a percent of the population varies around the Eastern Cape. The East, where the former black designated homelands of Transkei and Ciskei are found, have both a high density of black people, and only a small number of whites. For example, in the OR Tambo District Municipality, located in the former Transkei, only 0.1% of the 1.6 million inhabitants are white. On the other hand, in the west, Local Municipalities such as in the Cacadu District Municipality, contain white percentages exceeding 10%, with the highest being the Kouga Local Municipality, which stands at 25.4%. The largest white population centre is Port Elizabeth, which houses over half (170,000) of the Eastern Cape's white population. Other major white populations exist in East London, Grahamstown, Graaff-Reinet, and a number of smaller towns. The Eastern Cape houses the most equal mix of both English and Afrikaans speaking whites. The geographic background of the province shows a mix of English and Afrikaans place names, with no clear distinction between where Afrikaans or English speakers live.
Free State
The Afrikaners far outnumber English-speaking white people in the Free State (formerly called the Orange Free State), because British immigration to the region was very limited. They are predominant in practically all cities, and in many farms. The Afrikaner population is largest around Bloemfontein, which currently holds an estimated 100,000 white people (or a third of the total in the province). The white percentage has recently rebounded after prolonged decline. In 1880 the white percentage was 45.7% and 24 years later, this declined to 36.8% in 1904.[2] Despite a long and steady decline all through the 20th century, the 2007 Community Survey showed the white percentage of the Free State increased from 8.8% to 9.6%. There could be issues with this figure as overall the population of some municipalities decreased in population by up to 50%, which meant that the "missing" black people counted resulted in an increased white percentage. Major white populations are also found in cities such as Welkom, Kroonstad and Sasolburg.
Gauteng
Gauteng has both the highest percentage (18.4%) and number (just under 2 million) of white people compared to any of the other provinces. Afrikaner whites tend to be gathered in and around Pretoria (with around 450,000 Afrikaners), the East and West Rand, and in many other cities and towns in Gauteng. English-speaking white South Africans are mostly found in central Gauteng, namely Johannesburg and the East Rand. Also, the Midvaal Local Municipality, located in Gauteng, contains one of the highest percentage of whites in the country, which in 2007 stood at 35%.
KwaZulu-Natal
KwaZulu-Natal is the only province where the vast majority of white people are English-speaking.[3] However, there do remain some towns in the north with large Afrikaner populations such as in the town of Vryheid. Before 1994 the province was just called Natal, and in the 1960 republic referendum, it was the only province to vote against severing links to the British Crown. KwaZulu-Natal, like most provinces, has experienced a both numerical and proportional decline in the white population. Over half of KwaZulu-Natal's white population lives in Durban and its surrounding suburbs.
Limpopo
The Limpopo province has the smallest percentage of white people of any province in the country, which in 2007 stood at 2.2%. They are almost entirely Afrikaners. The white population is very unevenly spread. Some municipalities, especially in the more lightly populated west, have white percentages reaching far beyond 10% such as the Thabazimbi (23%), Bela-Bela (13%) and Mookgopong Local Municipality (21%). Conversely, in the much more densely populated East (where the former homelands of Gazankulu, Lebowa and Venda lie), the white percentage drops significantly due to the high black population density. Some municipalities, including the Thumamela and Mutale Local Municipality, have white populations of no more than 500, and therefore percentages reaching as low as 0.05%. The capital city, Polokwane (formerly Pietersburg), holds around 27,000 whites, making up just under a fourth of the province's white population. Other major white concentrations are in Tzaneen, Phalaborwa, Thabazimbi, Louis Trichardt and practically every settlement along the N1 national road.
Mpumalanga
In 2007 roughly 6.7% of Mpumalanga was white. The majority of whites in Mpumalanga are Afrikaans speaking. Approximately 250,000 whites live in Mpumalanga, with major population centres being the capital, Nelspruit and other large cities such as Witbank, Middelburg, Ermelo and Lydenburg.
Northwest Province
The Northwest Province has an almost identical situation to that of Mpumalanga. There is a very strong and patriotic Afrikaner community, and the province is also the birthplace of the Afrikaner Weerstandsbeweging (AWB), which was created in Ventersdorp. There is an especially strong Afrikaner influence in the city of Potchefstroom. In 2007 there were 235,580 whites, making up roughly 7.2% (up from 6.7% in 2001) of the province's total population. The vast majority are Afrikaans speaking.
Northern Cape
The Northern Cape's small white population is also dominated by Afrikaners, with some English whites in cities such as Kimberley. Although the white population only number no more than 100,000, because the province is very sparsely populated, it means the white population has remained very much above 10%, even since 1994.[4] Roughly 25% of whites live in the Sol Plaatje Local Municipality, which contains the Diamond-mining city of Kimberley. Although only having about 12,000 white inhabitants, the Namakwa District Municipality, in the very sparse western Northern Cape, they still manage to make up over 11% of the District Municipality's population. Afrikaans is the lingua franca in the Northern Cape, because the majority of the province (mostly Coloureds) speak it as a first language. Only in the north-eastern areas are there more blacks than Coloureds, and as well as far fewer white people. Besides Kimberley, other important white concentrations are found in Upington, Britstown, Springbok, De Aar, Jan Kempdorp and Barkly West. Orania, a purpose-built town for only-Afrikaans-speaking whites, is also located in the east of the Northern Cape, bordering the Free State. It houses just over 1400 inhabitants and is a special case as it is the only "main-place"[5] where virtually all inhabitants are white.
Western Cape
The Western Cape has the second highest percentage of white people (18.4%) in South Africa, at 850 000 and the only one with a White premier (governor). The lingua franca is Afrikaans, although some urban areas, especially Cape Town, have a large English speaking population. Many Cape Town suburbs and neighborhoods have white majorities, including some with a white population of 95% or greater including: Llandudno, Fish Hoek, Constantia and Noordhoek. The Western Cape has some of the highest white percentage municipalities in South Africa, such as the Overstrand (33%), Cape Agulhas (23%), Mossel Bay (28%), Knysna (23%) and Hessequa (38%) to name a few.
Largest population centres
This is an incomplete list of the "main places" (localities) in South Africa with a white population of more than 10,000. The data is taken from the 2011 census[6]
Largest populations by province
Here is a list of some of the largest white populations by province.
Eastern Cape
The results of the 2011 census showed an Eastern Cape white population of 310,450. This is a slight increase on the 304,342 recorded in 2007 and the 305,839 in 2001, but it is a decrease on the 330,300 counted in 1996. The top twenty-five Main Places, with more than 650 white persons in 2011, are shown below:
| Main Place | 2011 | 2001 | 2001 / 11 change % |
current municipality | languages which predominate within each particular Main Place |
|---|---|---|---|---|---|
| Port Elizabeth | 118,220 | 123,722 | Nelson Mandela Bay | Afrikaans 40%; English 33%; Xhosa 22%; foreign languages 2% | |
| East London | 42,722 | 40,180 | Buffalo City | Xhosa 62%; English 21%; Afrikaans 13% | |
| Uitenhage | 19,114 | 19,180 | Nelson Mandela Bay | Afrikaans 69%; Xhosa 18%; English 10% | |
| Despatch | 17,717 | 14,683 | Nelson Mandela Bay | Afrikaans 60%; Xhosa 33%; English 5% | |
| Jeffreys Bay | 10,544 | 6,564 | Kouga | Afrikaans 54%; Xhosa 29%; English 12% | |
| Gonubie | 7,864 | 6,323 | Buffalo City | English 57%; Afrikaans 21%; Xhosa 20% | |
| Grahamstown | 5,636 | 6,232 | Makana | Xhosa 67%; Afrikaans 17%; English 13% | |
| Queenstown | 4,487 | 4,984 | Lukhanji | Xhosa 64%; Afrikaans 21%; English 10%; foreign languages 2% | |
| Cradock | 4,331 | 2,937 | Inxuba Yethemba | Xhosa 56%; Afrikaans 38%; English 4% | |
| Port Alfred | 4,295 | 3,468 | Ndlambe | English 35%; Xhosa 32%; Afrikaans 30% | |
| Graaff Reinet | 3,113 | 3,511 | Camdeboo | Afrikaans 92%; English 4%; Xhosa 3% | |
| Aliwal North | 1,989 | 2,390 | Maletswai | Xhosa 50%; Afrikaans 32%; Sotho 13%; English 3% | |
| Humansdorp | 1,947 | 2,409 | Kouga | Afrikaans 90%; Xhosa 5%; English 3% | |
| King Williams Town | 1,892 | 2,881 | Buffalo City | Xhosa 55%; Afrikaans 27%; English 14% | |
| Clarendon Marine (Beachview and Seaview) |
1,698 | 1,160 | Nelson Mandela Bay | Afrikaans 41%; English 36%; Xhosa 19%; Sotho 2% | |
| Burgersdorp | 1,503 | 947 | Gariep | Afrikaans 63%; Xhosa 30%; English 3%; Sotho 2% | |
| Somerset East | 1,338 | 1,469 | Blue Crane Route | Afrikaans 57%; Xhosa 38%; English 4% | |
| St Francis Bay | 1,286 | 610 | Kouga | Xhosa 39%; Afrikaans 33%; English 22%; foreign languages 2% | |
| Middelburg | 1,167 | 2,026 | Inxuba Yethemba | Afrikaans 52%; Xhosa 44%; English 2% | |
| Stutterheim | 1,101 | 1,133 | Amahlathi | Xhosa 87%; Afrikaans 6%; English 5% | |
| Mthatha (Umtata) | 998 | 1,007 | King Sabata Dalindyebo | Xhosa 85%; English 9% | |
| Kirkwood | 984 | 846 | Sundays River Valley | Afrikaans 83%; Xhosa 13%; English 2% | |
| Kenton-on-Sea | 895 | 1,291 | Ndlambe | Xhosa 71%; English 20%; Afrikaans 6% | |
| Colchester | 744 | 299 | Nelson Mandela Bay | Afrikaans 49%; Xhosa 33%; English 15% | |
| Fort Beaufort | 676 | 696 | Nkonkobe | Xhosa 77%; Afrikaans 15%; English 5% |
Free State
The results of the 2011 census showed a white population of 239,026 in the Free State. This is a decrease from the 266,555 recorded in 2007. There were 238,789 in 2001 and 316,459 in 1996. The top twenty-five Main Places, with more than nine hundred white persons in 2011, are shown below:
| Place | 2011 | 2001 | 2001 / 11 change % |
Current municipality | Languages which predominate within each particular Main Place |
|---|---|---|---|---|---|
| Bloemfontein | 76,325 | 72,619 | Mangaung | Afrikaans 43%; Sotho 33%; English 8%; Xhosa 7%; Tswana 6% | |
| Sasolburg | 20,282 | 17,306 | Metsimaholo | Afrikaans 64%; Sotho 16%; English 9% | |
| Welkom | 17,226 | 17,448 | Matjhabeng | Afrikaans 39%; Sotho 33%; English 11%; Xhosa 9% | |
| Kroonstad | 9,655 | 12,858 | Moqhaka | Afrikaans 62%; Sotho 25%; English 5% | |
| Bethlehem | 9,099 | 7,833 | Dihlabeng | Afrikaans 67%; Sotho 19%; English 7% | |
| Parys | 6,808 | 7,387 | Ngwathe | Afrikaans 85%; English 7%; Sotho 5% | |
| Virginia | 6,499 | 8,820 | Matjhabeng | Sotho 42%; Afrikaans 32%; Xhosa 10%; English 6% | |
| Riebeeckstad | 5,452 | 5,526 | Matjhabeng | Afrikaans 48%; Sotho 33%; English 9%; Xhosa 4% | |
| Odendaalsrus | 3,875 | 5,082 | Matjhabeng | Afrikaans 47%; Sotho 32%; Xhosa 8%; English 6% | |
| Harrismith | 2,988 | 3,370 | Maluti-a-Phofung | Zulu 50%; Sotho 33%; Afrikaans 10%; English 4% | |
| Hennenman | 2,820 | 2,100 | Matjhabeng | Afrikaans 82%; Sotho 8%; English 4% | |
| Ficksburg | 2,287 | 2,535 | Setsoto | Afrikaans 51%; English 22%; Sotho 18%; foreign languages 5% | |
| Bothaville | 2,275 | 2,371 | Nala | Afrikaans 59%; Sotho 30%; Xhosa 4% | |
| Frankfort | 2,136 | 1,642 | Mafube | Sotho 44%; Afrikaans 38%; Zulu 12% | |
| Reitz | 1,818 | 1,370 | Nketoana | Afrikaans 55%; Sotho 32%; Zulu 6% | |
| Ladybrand | 1,740 | 1,827 | Mantsopa | Afrikaans 41%; Sotho 31%; English 20%; foreign languages 4% | |
| Heilbron | 1,526 | 1,443 | Ngwathe | Sotho 60%; Afrikaans 29%; Zulu 6% | |
| Senekal | 1,485 | 1,313 | Setsoto | Sotho 47%; Afrikaans 46% | |
| Viljoenskroon | 1,420 | 1,702 | Moqhaka | Afrikaans 67%; Sotho 19%; English 6% | |
| Brandfort | 1,412 | 1,231 | Masilonyana | Afrikaans 49%; Sotho 33%; Xhosa 7%; Tswana 4% | |
| Bultfontein | 1,269 | 857 | Tswelopele | Afrikaans 58%; Sotho 24%; Xhosa 6%; Tswana 4% | |
| Wesselsbron | 1,092 | 981 | Nala | Afrikaans 79%; Sotho 11%; English 5% | |
| Deneysville | 1,072 | 847 | Metsimaholo | Afrikaans 52%; English 20%; Sotho 17%; Zulu 4% | |
| Allanridge | 1,019 | 1,379 | Matjhabeng | Afrikaans 44%; Sotho 31%; Xhosa 8%; English 6% | |
| Vrede | 977 | 1,181 | Phumelela | Afrikaans 52%; Zulu 20%; Sotho 19%; English 4% |
Gauteng
The results of the 2011 census showed a Gauteng white population of 1,913,884. This is a slight decrease on the 1,923,829 recorded in 2007 but is an increase on 1,735,094 in 2001 and 1,702,343 in 1996. The top thirty-five Main Places, with more than seven hundred white persons in 2011, are shown below:
| Place | 2011 | 2001 | 2001 / 11 change % |
Current municipality | Languages which predominate within each particular Main Place |
|---|---|---|---|---|---|
| Pretoria | 389,022 | 355,631 | City of Tshwane | Afrikaans 48%; English 16%; Pedi 8%; Tswana 6%; foreign languages 5%; Zulu 4%; Sotho 4%; Tsonga 3%; Venda 3%; Xhosa 2%; Ndebele 2% | |
| Randburg | 153,882 | 89,310 | City of Johannesburg | English 52%; Afrikaans 18%; Zulu 7%; foreign languages 5%; Tswana 4%; Xhosa 3%; Pedi 3%; Sotho 3%; Ndebele 2%; Tsonga 2%; Venda 2% | |
| Centurion | 139,501 | 90,997 | City of Tshwane | Afrikaans 49%; English 26%; Pedi 5%; Tswana 4%; Zulu 3%; Sotho 3%; Xhosa 3%; foreign languages 2% | |
| Johannesburg | 133,379 | 231,263 | City of Johannesburg | English 31%; Zulu 20%; Afrikaans 12%; foreign languages 8%; Xhosa 5%; Ndebele 5%; Sotho 5%; Pedi 5%; Tswana 4%; Tsonga 3%; Venda 2% | |
| Roodepoort | 115,541 | 98,995 | City of Johannesburg | English 30%; Afrikaans 24%; Zulu 9%; Tswana 9%; Pedi 5%; Xhosa 5%; Sotho 5%; foreign languages 4%; Venda 4%; Tsonga 3%; Ndebele 3% | |
| Sandton | 110,723 | 76,062 | City of Johannesburg | English 64%; Afrikaans 7%; Zulu 6%; foreign languages 6%; Pedi 3%; Tswana 3%; Xhosa 3%; Sotho 2%; Tsonga 2%; Ndebele 2% | |
| Kempton Park | 80,388 | 82,830 | Ekurheleni | Afrikaans 35%; English 26%; Zulu 9%; Pedi 8%; foreign languages 5%; Sotho 4%; Tswana 3%; Xhosa 3%; Tsonga 2%; Venda 2%; Ndebele 2% | |
| Germiston | 80,034 | 69,526 | Ekurheleni | English 24%; Afrikaans 17%; Zulu 17%; Xhosa 10%; Pedi 8%; Sotho 7%; foreign languages 6%; Tsonga 4%; Venda 3%; Tswana 3%; Ndebele 2% | |
| Boksburg | 73,887 | 69,987 | Ekurheleni | Afrikaans 29%; English 19%; Zulu 15%; Pedi 9%; Xhosa 8%; Sotho 7%; Tsonga 4%; foreign languages 3%; Tswana 2%; Ndebele 2% | |
| Krugersdorp | 70,636 | 52,203 | Mogale City | Afrikaans 42%; English 20%; Tswana 15%; Zulu 5%; Xhosa 4%; Sotho 4%; foreign languages 3%; Pedi 3%; Tsonga 2%; Venda 2%; Ndebele 2% | |
| Alberton | 64,675 | 61,018 | Ekurheleni | Afrikaans 43%; English 35%; Zulu 7%; Sotho 5%; Xhosa 3%; foreign languages 2%; Pedi 2%; Tswana 2% | |
| Benoni | 60,421 | 56,076 | Ekurheleni | English 41%; Afrikaans 19%; Zulu 17%; Pedi 5%; Sotho 3%; Tsonga 3%; foreign languages 3%; Xhosa 3%; Ndebele 2%; Tswana 2% | |
| Vanderbijlpark | 52,174 | 56,103 | Emfuleni | Afrikaans 51%; Sotho 20%; English 10%; Zulu 5%; foreign languages 3%; Xhosa 3%; Tswana 2%; Pedi 2% | |
| Springs | 44,075 | 43,427 | Ekurheleni | Afrikaans 30%; Zulu 21%; English 16%; Pedi 8%; Xhosa 7%; Sotho 6%; Tsonga 3%; foreign languages 3%; Tswana 2%; Ndebele 2% | |
| Brakpan | 38,956 | 33,879 | Ekurheleni | Afrikaans 47%; English 17%; Zulu 14%; Sotho 5%; Pedi 4%; foreign languages 3%; Tsonga 3%; Xhosa 3%; Tswana 2%; Ndebele2% | |
| Vereeniging | 33,018 | 34,933 | Emfuleni | Afrikaans 35%; Sotho 26%; English 16%; Zulu 8%; Xhosa 4%; Tswana 3%; foreign languages 3%; Pedi 2% | |
| Edenvale | 32,570 | 31,622 | Ekurheleni | English 72%; Afrikaans 12%; foreign languages 4%; Zulu 4%; Pedi 2%; Xhosa 2% | |
| Randfontein | 29,074 | 25,991 | Randfontein | Afrikaans 52%; Tswana 18%; English 8%; Sotho 5%; Xhosa 5%; Zulu 4%; Pedi 3%; Tsonga 2%; foreign languages 2% | |
| Meyerton | 26,852 | 11,457 | Midvaal | Afrikaans 42%; Sotho 23%; English 12%; Zulu 9%; Xhosa 5%; Pedi 2%; Tsonga 2%; foreign languages 2% | |
| Midrand | 21,168 | 16,378 | City of Johannesburg | English 50%; Zulu 10%; Afrikaans 7%; foreign languages 6%; Xhosa 5%; Tswana 5%; Pedi 5%; Sotho 5%; Tsonga 2%; Venda 2%; Ndebele 2% | |
| Akasia | 14,220 | 14,726 | City of Tshwane | Tswana 24%; Afrikaans 23%; Pedi 12%; English 10%; Sotho 8%; Zulu 7%; Tsonga 5%; Venda 3%; Xhosa 3%; foreign languages 3%; Ndebele 2% | |
| Heidelberg | 13,251 | 8,139 | Lesedi | Afrikaans 38%; Zulu 25%; Sotho 18%; English 9%; Xhosa 3%; foreign languages 2% | |
| Nigel | 12,799 | 13,043 | Ekurheleni | Afrikaans 44%; Zulu 23%; English 16%; Sotho 5%; Xhosa 3%; Tswana 2%; foreign languages 2%; Pedi 2% | |
| Fochville | 6,813 | 8,545 | Merafong City | Afrikaans 71%; English 7%; Sotho 6%; Tswana 6%; Xhosa 4%; Zulu 2% | |
| Carletonville | 6,300 | 9,921 | Merafong City | Afrikaans 25%; Xhosa 20%; Tswana 13%; Sotho 13%; English 9%; Zulu 8%; Tsonga 4%; Pedi 2%; foreign languages 2%; Swazi 2% | |
| Bronkhorstspruit | 5,580 | 5,095 | City of Tshwane | Afrikaans 47%; Ndebele 11%; English 10%; Pedi 9%; Zulu 8%; Sotho 4%; Tswana 4%; foreign languages 3%; Swazi 2%; Tsonga 2% | |
| Rayton | 4,959 | 2,754 | City of Tshwane | Afrikaans 59%; Pedi 11%; English 8%; Ndebele 4%; Tsonga 4%; Zulu 4%; foreign languages 4%; Tswana 2%; Sotho 2%; Venda 2% | |
| Dainfern | 4,026 | 1,652 | City of Johannesburg | English 65%; foreign languages 16%; Afrikaans 5%; Zulu 4%; Pedi 2%; Tswana 2%; Xhosa 2%; Sotho 2% | |
| Walkerville | 3,610 | 3,619 | Midvaal | English 35%; Afrikaans 18%; Zulu 15%; Sotho 13%; Xhosa 5%; foreign languages 5%; Tswana 3%; Ndebele 2%; Pedi 2% | |
| Oberholzer | 3,330 | 3,975 | Merafong City | Afrikaans 55%; Tswana 12%; English 11%; Sotho 9%; Xhosa 5%; Zulu 3%; foreign languages 2% | |
| Westonaria | 3,273 | 4,631 | Westonaria | Afrikaans 29%; Xhosa 17%; Sotho 14%; Tswana 13%; English 8%; Zulu 7%; Tsonga 4%; foreign languages 2%; Pedi 2%; Venda 2% | |
| Cullinan | 2,759 | 2,125 | City of Tshwane | Afrikaans 49%; Pedi 16%; English 9%; Sotho 6%; Tswana 5%; Zulu 5%; Ndebele 3%; Xhosa 3%; Tsonga 2% | |
| Soweto | 1,421 | 325 | City of Johannesburg | Zulu 37%; Sotho 16%; Tswana 13%; Tsonga 9%; Xhosa 9%; Pedi 5%; Venda 5%; English 2% | |
| Chartwell | 864 | 796 | City of Johannesburg | English 51%; Afrikaans 11%; Zulu 10%; foreign languages 8%; Ndebele 7%; Pedi 4%; Xhosa 3%; Tswana 3%; Sotho 2% | |
| Venterspost | 809 | 536 | Westonaria | Afrikaans 53%; English 13%; Tswana 11%; Xhosa 6%; Sotho 6%; Zulu 5%; Tsonga 2%; Pedi 2% |
References
- ↑ "Table: Census 2001 by province, language, population group and gender.". Census 2001. Statistics South Africa. Retrieved 18 February 2011.
- ↑ http://www.1911encyclopedia.org/Orange_Free_State
- ↑ The highest stage of white supremacy - Google Books
- ↑ Despite the white population percentage decrease since 1994, the Northern Cape has retained a white percentage of 10%+
- ↑ In South African censuses, a "main place" is a locality representing a village, e.g. Centurion, is a "main-place" within Tshwane municipality.
- ↑ Use the site to find out the ethnic composition of ALL localities/municips. and provinces in South Africa.