Digital image correlation
Digital image correlation and tracking is an optical method that employs tracking and image registration techniques for accurate 2D and 3D measurements of changes in images. This is often used to measure deformation (engineering), displacement, strain, and optical flow, but it is widely applied in many areas of science and engineering. One very common application is for measuring the motion of an optical mouse.
Overview
Digital image correlation (DIC) techniques have been increasing in popularity, especially in micro- and nano-scale mechanical testing applications due to its relative ease of implementation and use. Advances in computer technology and digital cameras have been the enabling technologies for this method and while white-light optics has been the predominant approach, DIC can be and has been extended to almost any imaging technology.
The concept of using cross-correlation to measure shifts in datasets has been known for a long time, and it has been applied to digital images since at least the early 1970s.[1][2] The present-day applications are almost innumerable and include image analysis, image compression, velocimetry, and strain estimation. Much early work in DIC in the field of mechanics was led by researchers at the University of South Carolina in the early 1980s[3][4][5] and has been optimized and improved in recent years.[6] Commonly, DIC relies on finding the maximum of the correlation array between pixel intensity array subsets on two or more corresponding images, which gives the integer translational shift between them. It is also possible to estimate shifts to a finer resolution than the resolution of the original images, which is often called "subpixel" registration because the measured shift is smaller than an integer pixel unit. For subpixel interpolation of the shift, there are other methods that do not simply maximize the correlation coefficient. An iterative approach can also be used to maximize the interpolated correlation coefficient by using nonlinear optimization techniques. The nonlinear optimization approach tends to be conceptually simpler, but as with most nonlinear optimization techniques, it is quite slow, and the problem can sometimes be reduced to a much faster and more stable linear optimization in phase space.
The two-dimensional discrete cross correlation can be defined several ways, one possibility being:

![{\displaystyle r_{ij}={\frac {\sum _{m}\sum _{n}[f(m+i,n+j)-{\bar {f}}][g(m,n)-{\bar {g}}]}{\sqrt {\sum _{m}\sum _{n}{[f(m,n)-{\bar {f}}]^{2}}\sum _{m}\sum _{n}{[g(m,n)-{\bar {g}}]^{2}}}}}.}](../I/m/c37a8c4826069b7ff3afd2e1ebf9dbaf7d29d178.svg)
Here f(m, n) is the pixel intensity or the gray-scale value at a point (m, n) in the original image, g(m, n) is the gray-scale value at a point (m, n) in the translated image, and are mean values of the intensity matrices f and g respectively.


However, in practical applications, the correlation array is usually computed using Fourier-transform methods, since the fast Fourier transform is a much faster method than directly computing the correlation.

Then taking the complex conjugate of the second result and multiplying the Fourier transforms together elementwise, we obtain the Fourier transform of the correlogram, :


where is the Hadamard product (entry-wise product). It is also fairly common to normalize the magnitudes to unity at this point, which results in a variation called phase correlation.

Then the cross-correlation is obtained by applying the inverse Fourier transform:

At this point, the coordinates of the maximum of give the integer shift:

Deformation mapping
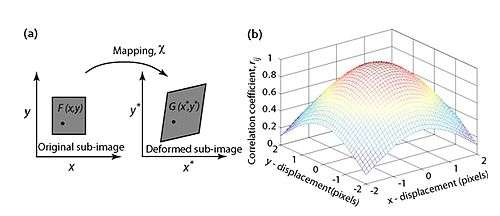
For deformation mapping, the mapping function that relates the images can be derived from comparing a set of subwindow pairs over the whole images. (Figure 1). The coordinates or grid points (xi, yj) and (xi*, yj*) are related by the translations that occur between the two images. If the deformation is small and perpendicular to the optical axis of the camera, then the relation between (xi, yj) and (xi*, yj*) can be approximated by a 2D affine transformation such as:


Here u and v are translations of the center of the sub-image in the X and Y directions respectively. The distances from the center of the sub-image to the point (x, y) are denoted by and . Thus, the correlation coefficient rij is a function of displacement components (u, v) and displacement gradients


DIC has proven to be very effective at mapping deformation in macroscopic mechanical testing, where the application of specular markers (e.g. paint, toner powder) or surface finishes from machining and polishing provide the needed contrast to correlate images well. However, these methods for applying surface contrast do not extend to the application of freestanding thin films for several reasons. First, vapor deposition at normal temperatures on semiconductor grade substrates results in mirror-finish quality films with RMS roughnesses that are typically on the order of several nanometers. No subsequent polishing or finishing steps are required, and unless electron imaging techniques are employed that can resolve microstructural features, the films do not possess enough useful surface contrast to adequately correlate images. Typically this challenge can be circumvented by applying paint that results in a random speckle pattern on the surface, although the large and turbulent forces resulting from either spraying or applying paint to the surface of a freestanding thin film are too high and would break the specimens. In addition, the sizes of individual paint particles are on the order of μms, while the film thickness is only several hundred nanometers, which would be analogous to supporting a large boulder on a thin sheet of paper.
Very recently, advances in pattern application and deposition at reduced length scales have exploited small-scale synthesis methods including nano-scale chemical surface restructuring and photolithography of computer-generated random specular patterns to produce suitable surface contrast for DIC. The application of very fine powder particles that electrostatically adhere to the surface of the specimen and can be digitally tracked is one approach. For Al thin films, fine alumina abrasive polishing powder was initially used since the particle sizes are relatively well controlled, although the adhesion to Al films was not very good and the particles tended to agglomerate excessively. The candidate that worked most effectively was a silica powder designed for a high temperature adhesive compound (Aremco, inc.), which was applied through a plastic syringe. A light blanket of powder would coat the gage section of the tensile sample and the larger particles could be blown away gently. The remaining particles would be those with the best adhesion to the surface. While the resulting surface contrast is not ideal for DIC, the high intensity ratio between the particles and the background provide a unique opportunity to track the particles between consecutive digital images taken during deformation. This can be achieved quite straightforwardly using digital image processing techniques. Subpixel tracking can be achieved by a number of correlation techniques, or by fitting to the known intensity profiles of particles.
Digital volume correlation
Digital Volume Correlation (DVC) is a related analysis method with close ties to 2D-DIC. 3D-DIC successfully maps 3D deformations, but it does so by capturing planar images of the surface of a body only. The DVC algorithm is able to track full-field displacement information in the form of voxels instead of pixels. The theory is similar to above except that another dimension is added: the z-dimension. Instead of minimizing a coefficient based on the summed difference of intensity values in a subset of a planar image, minimization is done in a 3D-subset where intensity values corresponding to (x,y,z) values are compared to a standard and the summed difference minimized using predictive, 3D displacement fields.[7]
DVC can be done on any image dataset that represents a volume. The most popular way to do this currently is to use a sectioning microscope to take consecutive images at incremental depths. These images can then be reconstructed into a 3D matrix of intensity values representing the volume. For accurate calculation, it is required that a distinctly original 3D voxel pattern be captured so that minimization will settle on the proper values. This requires low noise levels and unique markers within the imaged volume.[8]
The experimental DVC method is still being developed and optimized for speed and reliability. The first proposition of DVC was in 1999 by the authors Bay, Smith, Fyhrie, and Saad.[7] This group used X-ray Tomography to image volumes that could then be correlated using the DVC algorithm which they developed in theory. Since then the method has grown in acceptance and has expanded to different imaging techniques. To date it has been used with MRI imaging, Computer Tomography (CT), and microCT. Recently, the technique has been expanded by the development of confocal microscopy, which allows for the imaging and testing of live tissue samples with techniques such as Second-Harmonic Generation (SHG) and Two-photon excitation microscopy. DVC is currently considered to be ideal in the research world for 3D quantization of local displacements, strains, and stress in biological specimens. It is preferred because of the non-invasiveness of the method over traditional experimental methods.[8]
References
- ↑ P. E. Anuta, "Spatial registration of multispectral and multitemporal digital imagery using fast Fourier transform techniques", IEEE Trans. Geosci. Electron., vol. GE-8, p. 353–368, Oct. 1970.
- ↑ T. J. Keating, P. R. Wolf, and F. L. Scarpace, "An Improved Method of Digital Image Correlation", Photogrammetric Engineering and Remote Sensing 41(8): 993–1002, (1975).
- ↑ T. C. Chu, W. F. Ranson, M. A. Sutton, W. H. Peters, Exp. Mech. 25 (1985), 232.
- ↑ H. A. Bruck, S. R. McNeill, M. A. Sutton, W. H. Peters III, Exp. Mech. 29 (1989), 261.
- ↑ W. H. Peters, W. F. Ranson, Opt. Eng. 21 (1982), 427.
- ↑ E.g. M. A. Sutton, J.-J. Orteu, H. W. Schreier, Book - Image Correlation for Shape, Motion and Deformation Measurements, Hardcover ISBN 978-0-387-78746-6.
- 1 2 Bay BK, Smith TS, Fyhrie DP, Saad M (1999) Digital volume correlation: Three-dimensional strain mapping using X-ray Tomography. Exp Mech 39(3):217–226.
- 1 2 Jianyong Huang, Xiaochang Pan, Shanshan Li, Xiaoling Peng, Chunyang Xiong, and Jing Fang (2011) A Digital Volume Correlation Technique for 3-D Deformation Measurements of Soft Gels. International Journal of Applied Mechanics 3(2) 335-354.
See also
External links
- Mathematica ImageCorrelate function
- Using Digital Image Correlation to Measure Strain on a Tubine Blade
- Image Systems DIC