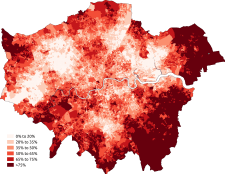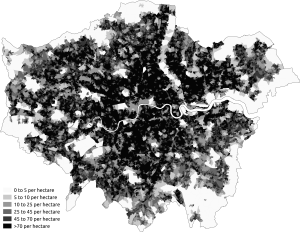
Population density in the 2011 census in Greater London.

Inner London and Outer London as defined by the Office for National Statistics
The demography of London is analysed by the Office for National Statistics and data is produced for each of the Greater London wards, the City of London and the 32 London boroughs, the Inner London and Outer London statistical sub-regions, each of the Parliamentary constituencies in London, and for all of Greater London as a whole. Additionally, data is produced for the Greater London Urban Area. Statistical information is produced about the size and geographical breakdown of the population, the number of people entering and leaving country and the number of people in each demographic subgroup.
Population change
See also Historical population of London
The historical population for the current area of Greater London, divided into the statistical areas of Inner and Outer London is as follows:[1][2][3]
| Year | 1801 | 1811 | 1821 | 1831 | 1841 | 1851 | 1861 | 1871 | 1881 | 1891 |
|---|
| Inner London |
879,491 |  1,040,033 1,040,033 | 1,263,975 | 1,515,557 | 1,661,346 | 1,995,846 | 2,634,143 | 3,272,441 | 3,910,735 | 4,422,340 |
| Outer London |
131,666 | 157,640 | 186,147 | 214,392 | 255,667 | 290,763 | 460,248 | 629,737 | 799,225 | 1,143,516 |
| Greater London | 1,011,157 | 1,197,673 | 1,450,122 | 1,729,949 | 1,917,013 | 2,286,609 | 3,094,391 | 3,902,178 | 4,709,960 | 5,565,856 |
| Year | 1901 | 1911 | 1921 | 1931 | 1941 | 1951 | 1961 | 1971 | 1981 | 1991 |
|---|
| Inner London |
4,670,177 | 4,997,741 |  4,936,803 4,936,803 | 4,887,932 | 4,224,135 | 3,680,821 | 3,336,557 | 3,030,490 | 2,425,534 | 2,625,245 |
| Outer London |
1,556,317 | 2,160,134 | 2,616,723 | 3,211,010 | 3,763,801 | 4,483,595 | 4,444,785 | 4,418,694 | 4,182,979 | 4,262,035 |
| Greater London | 6,226,494 | 7,157,875 | 7,553,526 | 8,098,942 | 7,987,936 | 8,164,416 | 7,781,342 | 7,449,184 | 6,608,513 | 6,887,280 |
| Year | 2001 | 2011 [4] |
|---|
| Inner London |
2,765,975 | 3,231,900 |
| Outer London |
4,406,061 | 4,942,100 |
| Greater London |
7,172,036 | 8,173,900 |
| Historical population |
|---|
| Year | Pop. | ±% p.a. |
|---|
| 1801 | 1,011,157 | — |
|---|
| 1811 | 1,197,673 | +1.71% |
|---|
| 1821 | 1,450,122 | +1.93% |
|---|
| 1831 | 1,729,949 | +1.78% |
|---|
| 1841 | 1,917,013 | +1.03% |
|---|
| 1851 | 2,286,609 | +1.78% |
|---|
| 1861 | 3,094,391 | +3.07% |
|---|
| 1871 | 3,902,178 | +2.35% |
|---|
| 1881 | 4,709,960 | +1.90% |
|---|
| 1891 | 5,565,856 | +1.68% |
|---|
| 1901 | 6,226,494 | +1.13% |
|---|
| 1911 | 7,157,875 | +1.40% |
|---|
| 1921 | 7,553,526 | +0.54% |
|---|
| 1931 | 8,098,942 | +0.70% |
|---|
| 1941 | 7,987,936 | −0.14% |
|---|
| 1951 | 8,164,416 | +0.22% |
|---|
| 1961 | 7,781,342 | −0.48% |
|---|
| 1971 | 7,449,184 | −0.44% |
|---|
| 1981 | 6,608,513 | −1.19% |
|---|
| 1991 | 6,887,280 | +0.41% |
|---|
| 2001 | 7,172,036 | +0.41% |
|---|
| 2011 | 8,173,941 | +1.32% |
|---|
| 2012 | 8,308,369 | +1.64% |
|---|
| 2013 | 8,416,535 | +1.30% |
|---|
| 2014 | 8,538,689 | +1.45% |
|---|
| 2015 | 8,673,713 | +1.58% |
|---|
Race by borough
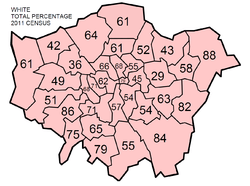
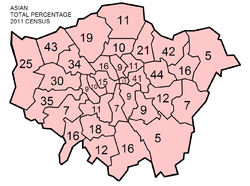
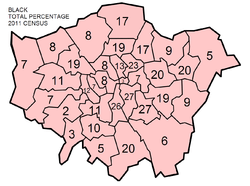
This table shows the proportion of each main race by London borough, as found in the 2011 census.
| Local authority | White | Mixed | Asian | Black | Other |
| Barnet | 64.1 | 4.8 | 18.5 | 7.7 | 4.9 |
| Barking and Dagenham | 58.3 | 4.2 | 15.9 | 20 | 1.6 |
| Bexley | 81.9 | 2.3 | 6.6 | 8.5 | 0.8 |
| Brent | 36.3 | 5.1 | 34.1 | 18.8 | 5.8 |
| Bromley | 84.3 | 3.5 | 5.2 | 6 | 0.9 |
| Camden | 66.3 | 5.6 | 16.1 | 8.2 | 3.8 |
| City of London | 78.6 | 3.9 | 12.7 | 2.6 | 2.1 |
| Croydon | 55.1 | 6.6 | 16.4 | 20.2 | 1.8 |
| Ealing | 49 | 4.5 | 29.7 | 10.9 | 6 |
| Enfield | 61 | 5.5 | 11.2 | 17.2 | 5.1 |
| Greenwich | 62.5 | 4.8 | 11.7 | 19.1 | 1.9 |
| Hackney | 54.7 | 6.4 | 10.5 | 23.1 | 5.3 |
| Haringey | 60.5 | 6.5 | 9.5 | 18.8 | 4.7 |
| Harrow | 42.2 | 4 | 42.6 | 8.2 | 2.9 |
| Havering | 87.7 | 2.1 | 4.9 | 4.8 | 0.6 |
| Hammersmith and Fulham | 68.1 | 5.5 | 9.1 | 11.8 | 5.5 |
| Hillingdon | 60.6 | 3.8 | 25.3 | 7.3 | 3 |
| Hounslow | 51.4 | 4.1 | 34.4 | 6.6 | 3.6 |
| Islington | 68.2 | 6.5 | 9.2 | 12.8 | 3.4 |
| Kensington and Chelsea | 70.6 | 5.7 | 10 | 6.5 | 7.2 |
| Kingston upon Thames | 74.5 | 3.9 | 16.3 | 2.5 | 2.7 |
| Lambeth | 57.1 | 7.6 | 6.9 | 25.9 | 2.4 |
| Lewisham | 53.5 | 7.4 | 9.3 | 27.2 | 2.6 |
| Merton | 64.9 | 4.7 | 18.1 | 10.4 | 1.9 |
| Newham | 29 | 4.5 | 43.5 | 19.6 | 3.5 |
| Redbridge | 42.5 | 4.1 | 41.8 | 8.9 | 2.7 |
| Richmond upon Thames | 86 | 3.6 | 7.3 | 1.5 | 1.6 |
| Southwark | 54.3 | 6.2 | 9.4 | 26.9 | 3.3 |
| Sutton | 78.6 | 3.8 | 11.6 | 4.8 | 1.3 |
| Tower Hamlets | 45.2 | 4.1 | 41.1 | 7.3 | 2.3 |
| Waltham Forest | 52.2 | 5.3 | 21.1 | 17.3 | 4.1 |
| Wandsworth | 71.4 | 5 | 10.9 | 10.7 | 2.1 |
| Westminster | 61.7 | 5.2 | 14.5 | 7.5 | 11.1 |
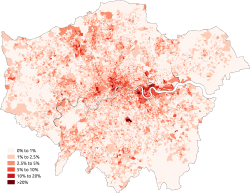
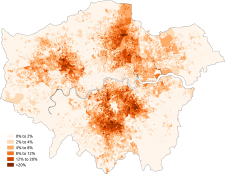
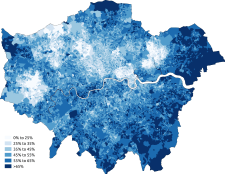
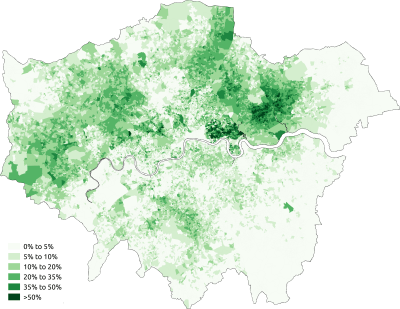
Illustrated London Boroughs maps showing the percentage of races in each borough, according to the 2011 census
Ethnicity
The following table shows the ethnic group of respondents in the 2011 census in Greater London.
| Ethnic Group |
2001[5] |
2011[6] |
| Number |
% |
Number |
% |
| White: British | 4,287,861 | 59.79% | 3,669,284 | 44.89% |
| White: Irish | 220,488 | 3.07% | 175,974 | 2.15% |
| White: Gypsy or Irish Traveller[Note 1] | | | 8,196 | 0.10% |
| White: Other | 594,854 | 8.29% | 1,033,981 | 12.65% |
| White: Total | 5,103,203 | 71.15% | 4,887,435 | 59.79% |
| Asian or Asian British: Indian | 436,993 | 6.09% | 542,857 | 6.64% |
| Asian or Asian British: Pakistani | 142,749 | 1.99% | 223,797 | 2.74% |
| Asian or Asian British: Bangladeshi | 153,893 | 2.15% | 222,127 | 2.72% |
| Asian or Asian British: Chinese[Note 2] | 80,201 | 1.12% | 124,250 | 1.52% |
| Asian or Asian British: Other Asian | 133,058 | 1.86% | 398,515 | 4.88% |
| Asian or Asian British: Total | 946,894 | 13.20% | 1,511,546 | 18.49% |
| Black or Black British: African | 378,933 | 5.28% | 573,931 | 7.02% |
| Black or Black British: Caribbean | 343,567 | 4.79% | 344,597 | 4.22% |
| Black or Black British: Other Black | 60,349 | 0.84% | 170,112 | 2.08% |
| Black or Black British: Total | 782,849 | 10.92% | 1,088,640 | 13.32% |
| Mixed: White and Black Caribbean | 70,928 | 0.99% | 119,425 | 1.46% |
| Mixed: White and Black African | 34,182 | 0.48% | 65,479 | 0.80% |
| Mixed: White and Asian | 59,944 | 0.84% | 101,500 | 1.24% |
| Mixed: Other Mixed | 61,057 | 0.85% | 118,875 | 1.45% |
| Mixed: Total | 226,111 | 3.15% | 405,279 | 4.96% |
| Other: Arab[Note 3] | | | 106,020 | 1.30% |
| Other: Any other ethnic group | 113,034 | 1.58% | 175,021 | 2.14% |
| Other: Total | 113,034 | 1.58% | 281,041 | 3.44% |
| Total | 7,172,091 | 100.00% | 8,173,941 | 100.00% |
- ↑ New category created for the 2011 census
- ↑ In 2001, listed under the 'Other ethnic group' heading.
- ↑ New category created for the 2011 census
In January 2005, a survey of London's ethnic and religious diversity claimed that there were more than 300 languages spoken and 50 non-indigenous communities with a population of more than 10,000 in London.[7]
| Distribution of ethnic groups in Greater London according to the 2011 census. |
|---|
|
Country of birth
| 2011 United Kingdom Census[8] |
| Country of birth | Population |
 United Kingdom United Kingdom | 5,175,677 |
 India India | 262,247 |
 Poland Poland | 158,300 |
 Ireland Ireland | 129,807 |
 Nigeria Nigeria | 114,718 |
 Pakistan Pakistan | 112,457 |
 Bangladesh Bangladesh | 109,948 |
 Jamaica Jamaica | 87,467 |
 Sri Lanka Sri Lanka | 84,542 |
 France France | 66,654 |
 Somalia Somalia | 65,333 |
 Kenya Kenya | 64,212 |
 United States United States | 63,920 |
 Ghana Ghana | 62,896 |
 Italy Italy | 62,050 |
 Turkey Turkey | 59,596 |
 South Africa South Africa | 57,765 |
 Germany Germany | 55,476 |
 Australia Australia | 53,959 |
 Romania Romania | 44,848 |
 Philippines Philippines | 44,199 |
 Cyprus Cyprus | 43,428 |
 Portugal Portugal | 41,041 |
 Lithuania Lithuania | 39,817 |
 China China | 39,452 |
 Afghanistan Afghanistan | 37,680 |
 Iran Iran | 37,339 |
 Spain Spain | 35,880 |
 Uganda Uganda | 32,136 |
 Brazil Brazil | 31,357 |
The 2011 census recorded that 2,998,264 people or 36.7% of London's population are foreign-born (including 24.5% born in a non-European country) making London the city with the second largest immigrant population, behind New York City, in terms of absolute numbers. The table to the right shows the most common countries of birth of London residents. Note that some of the German-born population, in 18th position, are British citizens from birth born to parents serving in the British Armed Forces in Germany.[9]
Languages
According to the 2011 Census, 6,083,420 or 77.9% of London's population aged 3 and over spoke English as a main language, with a further 1,406,912 (19.8%) speaking it as a second language or well to very well.[10] 271,693 (3.5%) could not speak English well, while 47,917 (0.6%) could not speak English at all.[10] 2,456 (<0.1%) spoke other UK minority languages, with the most common being Welsh and 2,926 (<0.1%) used British Sign Language.[11] This shows also great challenges for TfL and other government services, for example most ticket vending machines use only English, French and up to 2 other western Europe hemisphere languages, while as shown below most demand is for Indian languages, Polish etc.
The most common main languages spoken in Greater London according to the 2011 census are shown below.[12]
| Rank | Language | Usual residents aged 3+ | Proportion |
| 1 | English | 6,083,420 | 77.90% |
| 2 | Polish | 147,816 | 1.90% |
| 3 | Bengali (with Sylheti and Chatgaya) | 114,267 | 1.50% |
| 4 | Gujarati | 101,676 | 1.30% |
| 5 | French | 84,191 | 1.10% |
| 6 | Urdu | 78,667 | 1.00% |
| 7 | Portuguese | 71,525 | 0.90% |
| 8 | Turkish | 71,242 | 0.90% |
| 9 | Spanish | 71,192 | 0.90% |
| 10 | Arabic | 70,602 | 0.90% |
| 11 | Tamil | 70,565 | 0.90% |
| 12 | Punjabi | 68,525 | 0.90% |
| 13 | Somali | 54,852 | 0.70% |
| 14 | Italian | 49,484 | 0.60% |
| 15 | Romanian | 39,653 | 0.50% |
| 16 | Persian/Farsi | 39,645 | 0.50% |
| 17 | Lithuanian | 35,341 | 0.50% |
| 18 | German | 31,306 | 0.40% |
| 19 | Greek | 26,924 | 0.30% |
| 20 | Russian | 26,603 | 0.30% |
| | Other | 441,968 | 5.66% |
Religion
The following table shows the religion of respondents in the 2001 and 2011 censuses in Greater London.
| Religion |
2001[13] |
2011[14] |
| Number |
% |
Number |
% |
| Christian | 4,176,175 | 58.23% | 3,957,984 | 48.42% |
| Buddhist | 54,297 | 0.76% | 82,026 | 1.00% |
| Hindu | 291,977 | 4.07% | 411,291 | 5.03% |
| Jewish | 149,789 | 2.09% | 148,602 | 1.82% |
| Muslim | 607,083 | 8.46% | 1,012,823 | 12.39% |
| Sikh | 104,230 | 1.45% | 126,134 | 1.54% |
| Other religion | 36,558 | 0.51% | 47,970 | 0.59% |
| No religion | 1,130,616 | 15.76% | 1,694,372 | 20.73% |
| Religion not stated | 621,366 | 8.66% | 692,739 | 8.47% |
| Total | 7,172,091 | 100.00% | 8,173,941 | 100.00% |
| Distribution of religions in Greater London according to the 2011 census. |
|---|
|
Eurostat NUTS
In the Eurostat Nomenclature of Territorial Units for Statistics (NUTS), London is a level-1 NUTS region, coded "UKI", which is subdivided as follows:
| NUTS 1 |
Code |
NUTS 2 |
Code |
NUTS 3 |
Code |
| London |
UKI |
Inner London |
UKI1 |
West Inner London (City of London, Camden, Hammersmith and Fulham, Kensington and Chelsea, Wandsworth, Westminster) |
UKI11 |
 |
East Inner London (Hackney, Haringey, Islington, Lambeth, Lewisham, Newham, Southwark, Tower Hamlets) |
UKI12 |
| Outer London |
UKI2 |
East and North East Outer London (Barking and Dagenham, Bexley, Enfield, Greenwich, Havering, Redbridge, Waltham Forest) |
UKI21 |
| South Outer London (Bromley, Croydon, Kingston upon Thames, Merton, Sutton) |
UKI22 |
| West and North West Outer London (Barnet, Brent, Ealing, Harrow, Hillingdon, Hounslow, Richmond upon Thames) |
UKI23 |
|
Urban and metropolitan area
At the 2001 census, the population of the Greater London Urban Area was 8,278,251.[15] This area does not include some outliers within Greater London, but does extend into the adjacent South East England and East of England regions. In 2004 the London Plan of the Mayor of London defined a metropolitan region with a population of 18 million.[16] Eurostat has developed a harmonising standard for comparing metropolitan areas in the European Union and the population of the London Larger Urban Zone is 11,917,000; it occupies an area of 8,920 square kilometres (3,440 sq mi). Another definition gives the population of the metropolitan area as 13,709,000.[17]
See also
References