Demography of Wales
Demographics of Wales include the numbers in population, place of birth, age, ethnicity, religion, and number of marriages.
Historical population
| Year | Population of Wales | |
| 1536 | 278,000 | |
| 1620 | 360,000 | |
| 1770 | 500,000 | |
| 1801 | 587,000 | |
| 1851 | 1,163,000 | |
| 1911 | 2,421,000 | |
| 1921 | 2,656,000 | |
| 1939 | 2,487,000 | |
| 1961 | 2,644,023 | |
| 1991 | 2,811,865 | |
| 2011 | 3,063,456 | |
| source: John Davies (1993). A History of Wales. pp. 258–59, 319.; Census 2001, 200 Years of the Census in ... Wales (2001) |
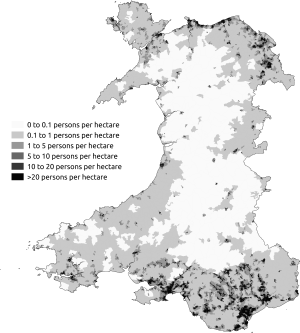
The population of Wales doubled from 587,000 in 1801 to 1,163,000 in 1851 and had reached 2,421,000 by 1911. Most of the increase came in the coal mining districts especially Glamorganshire, which grew from 71,000 in 1801 to 232,000 in 1851 and 1,122,000 in 1911.[1] Part of this increase can be attributed to the demographic transition seen in most industrialising countries during the Industrial Revolution, as death-rates dropped and birth-rates remained steady. However, there was also a large-scale migration of people into Wales during the industrial revolution.
Current population
The resident population of Wales in 2011 increased by 5% since 2001 to 3,063,456, of whom 1,504,228 are men and 1,559,228 women, according to the 2011 census results. Wales accounted for 4.8% of the UK population in 2011.[2]
The population in 1972 stood at 2.74 million and remained broadly static for the rest of the decade. However, in the early 1980s, the population fell due to net migration out of Wales. Since the 1980s, net migration has generally been positive, and has contributed more to population growth than natural change.[3]
Place of birth
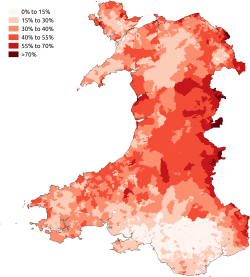
According to the 2011 census 2.2 million (73%) of the usual residents were born in Wales, a reduction of two percent since 2001. In 2001, 590,000 (20%) of the population of Wales was born in England. By 2011, the proportion of English-born citizens of Wales had increased by one percent to 21%. In 2011, 27% (837,000) of the total population of Wales were born outside Wales, and of these immigrants 636,000 (76%) were born in England.[4]
| Country of birth | 2001[5] | 2011[6] | ||
|---|---|---|---|---|
| Number | % | Number | % | |
| |
2,188,754 | 75.39% | 2,226,005 | 72.66% |
| |
589,828 | 20.32% | 636,266 | 20.77% |
| |
24,389 | 0.84% | 24,346 | 0.79% |
| |
7,851 | 0.27% | 8,253 | 0.27% |
| |
715 | 0.02% | ||
| |
12,718 | 0.44% | 12,175 | 0.40% |
| Other |
23,694 | 0.82% | 55,360 | 1.81% |
| Other |
26,343 | 0.86% | ||
| Other |
29,017 | 0.95% | ||
| Other countries | 55,851 | 1.92% | 100,336 | 3.28% |
| Total | 2,903,085 | 100.00% | 3,063,456 | 100.00% |
Below are the 5 largest foreign-born groups in Wales according to 2014 ONS estimates.[7]
| Country of birth | Estimated population, 2013 | Estimated population, 2014 | Estimated population, 2015 |
|---|---|---|---|
| 20,000 | 22,000 | 23,000 | |
| 11,000 | 12,000 | 10,000 | |
| 10,000 | 12,000 | 13,000 | |
| 11,000 | 11,000 | 11,000 | |
| 7,000 | 6,000 | 6,000 |
Age
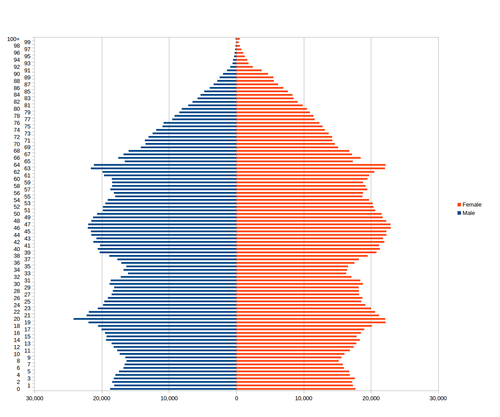
According to the 2011 census, some 563,000 of the population were aged 65 and over, an increase of 56,700 or one percent since 2001. As in 2001, six per cent (178,000) of the population in Wales were children under five, an increase of 11,300.[6]
| Ages attained (years) |
Population | % of total |
|---|---|---|
| 0–4 | 178,301 | 5.82 |
| 5–9 | 163,079 | 5.32 |
| 10–14 | 177,748 | 5.80 |
| 15–19 | 199,120 | 6.50 |
| 20–24 | 211,924 | 6.92 |
| 25–29 | 185,728 | 6.06 |
| 30–34 | 174,694 | 5.70 |
| 35–39 | 183,045 | 5.98 |
| 40–44 | 213,155 | 6.96 |
| 45–49 | 213,155 | 7.20 |
| 50–54 | 201,599 | 6.58 |
| 55–59 | 186,923 | 6.10 |
| 60–64 | 204,885 | 6.69 |
| 65–69 | 166,007 | 5.42 |
| 70–74 | 134,543 | 4.39 |
| 75–79 | 108,202 | 3.53 |
| 80–84 | 79,232 | 2.59 |
| 85–89 | 49,360 | 1.61 |
| 90+ | 25,200 | 0.82 |
Ethnicity
According to the 2011 census, 2.2 million (73%) of usual residents of Wales were born there, two percent less than in 2001. The change can be attributed to both international and internal migration. In 2001, 590,000 (20%) of the population of Wales was born in England. In 2011, this had increased by one percent.[6] Nearly 418,000 people identified themselves as Welsh in 2001.
The 2001 and 2011 census estimated the following ethnic groups:
| Ethnic group | 2001 population | 2001 percentage | 2011 population | 2011 percentage |
|---|---|---|---|---|
| White: British | 2,786,605 | 96.0 | 2,855,450 | 93.2 |
| White: Irish | 17,689 | 0.6 | 14,086 | 0.5 |
| White: Irish Traveller/White Gypsy[note 1] | 2,785 | 0.1 | ||
| White: Other | 37,211 | 1.3 | 55,932 | 1.8 |
| White: Total | 2,841,505 | 97.9 | 2,928,253 |
95.6 |
| Asian or Asian British: Indian | 8,261 | 0.3 | 17,256 | 0.6 |
| Asian or Asian British: Pakistani | 8,287 | 0.3 | 12,229 | 0.4 |
| Asian or Asian British: Bangladeshi | 5,436 | 0.2 | 10,687 | 0.3 |
| Asian or Asian British: Chinese[note 2] | 6,267 | 0.2 | 13,638 | 0.4 |
| Asian or Asian British: Asian Other | 3,464 | 0.1 | 16,318 | 0.5 |
| Asian or Asian British: Total | 31,715 | 1.1 | 70,128 |
2.3 |
| Black or Black British: Caribbean | 2,597 | 0.1 | 11,887 | 0.4 |
| Black or Black British: African | 3,727 | 0.1 | 3,809 | 0.1 |
| Black or Black British: Other | 745 | <0.1 | 2,580 | 0.1 |
| Black or Black British: Total | 7,069 | 0.2 | 18,276 |
0.6 |
| Mixed: White and Caribbean | 5,996 | 0.2 | 11,099 | 0.4 |
| Mixed: White and African | 2,413 | 0.1 | 4,424 | 0.1 |
| Mixed: White and Asian | 5,001 | 0.2 | 9,019 | 0.3 |
| Mixed: Other Mixed | 4,251 | 0.2 | 6,979 | 0.2 |
| British Mixed: Total | 17,661 | 0.7 | 31,521 |
1.0 |
| Other: Arab[note 3] | 9,615 | 0.3 | ||
| Other: Any other ethnic group | 5,135 | 0.2 | 5,663 | 0.2 |
| Other: Total | 5,135 | 0.2 | 15,278 |
0.5 |
| Total | 2,903,085 | 100 | 3,063,456 |
100 |
Notes for table above
- ↑ New category created for the 2011 census
- ↑ In 2001, listed under the 'Chinese or other ethnic group' heading.
- ↑ New category created for the 2011 census
- Source: Census 2001 Key Statistics - Urban area summary results for local authorities KS06 Ethnic group, Retrieved 18 June 2013
- Source: Census 2011: Ethnic group, unitary authorities in Wales, Accessed 23 December 2012
Religion
According to the 2011 census, there has been a 14 percent decrease since 2001, when 2.1 million (72% of usual residents) stated their religion as Christian. It is the only group to have experienced a decrease in numbers between 2001 and 2011 despite population growth. The second largest response group for this question in 2011 was no religion. This increased from 538,000 (19%) of residents in 2001 to 983,000 (32%) in 2011, a larger rise than in any region of England.[6]
| Religion | 2001[8][9] | 2011[8][10] | ||
|---|---|---|---|---|
| Number | % | Number | % | |
| Christianity | 2,087,242 | 71.9 | 1,763,299 | 57.6 |
| Islam | 21,739 | 0.7 | 45,950 | 1.5 |
| Hinduism | 5,439 | 0.2 | 10,434 | 0.3 |
| Buddhism | 5,407 | 0.2 | 9,117 | 0.3 |
| Sikhism | 2,015 | 0.1 | 2,962 | 0.1 |
| Judaism | 2,256 | 0.1 | 2,064 | 0.1 |
| Other religion | 6,909 | 0.2 | 12,705 | 0.4 |
| No religion | 537,935 | 18.5 | 982,997 | 32.1 |
| Religion not stated | 234,143 | 8.1 | 233,928 | 7.6 |
| Total population | 2,903,085 | 100.0 | 3,063,456 | 100.0 |
- Based on pre-census 2011 sources. The largest single denomination of Wales is Calvinist Methodism (Presbyterian Church of Wales), followed by the (Anglican) Church in Wales with 30% of the population, the Roman Catholic Church with 3% and the Congregationalist Union of Welsh Independents with 1% of the population.
Language
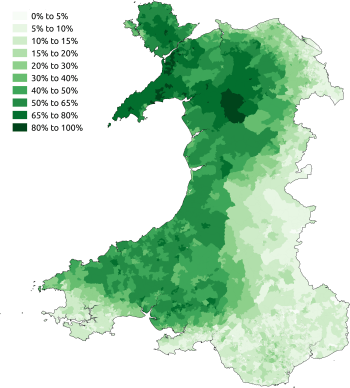
The 2011 census collected information about English and Welsh language proficiency. In 2011, 2.9 million (97%) of residents, age three and over, spoke English or Welsh. In a further 18,000 households, at least one adult spoke English or Welsh. In 22,000 households, no resident spoke either language. There were 562,000 (19%) residents, over age three, proficient in at least speaking the Welsh language. This was a reduction of approximately 2 per cent compared to 2001, though the method of analysis differed between the two censuses. There was also a 2% increase in those, over three years of age, who had no Welsh language skills.[6]
| Welsh language skills | 2001 number (,000) | 2001% | 2011 number (,000) | 2011% | change (,000) | change % |
|---|---|---|---|---|---|---|
| No skills in Welsh | 2,008 | 71.6 | 2,168 | 73.3 | 160 | 1.7 |
| Can speak, read and write Welsh | 458 | 16.3 | 431 | 14.6 | -27 | -1.7 |
| Can understand spoken Welsh only | 138 | 4.9 | 158 | 5.3 | 19 | 0.4 |
| Can speak but cannot read or write Welsh | 79 | 2.8 | 80 | 2.7 | 1 | -0.1 |
| Other combination of skills in Welsh | 84 | 3.0 | 73 | 2.5 | -10 | -0.5 |
| Can speak and read but cannot write Welsh | 38 | 1.4 | 46 | 1.5 | 7 | 0.1 |
- Source: 2011 Census: KS207WA Welsh language skills, unitary authorities in Wales, Accessed 23 December 2012
The most common main languages spoken in Wales according to the 2011 census are shown below.[11]
| Language | Usual residents aged 3+ | Proportion |
|---|---|---|
| English or Welsh | 2,871,405 | 97.14% |
| Polish | 17,001 | 0.58% |
| Arabic | 6,800 | 0.23% |
| Bengali (with Sylheti and Chatgaya) | 5,207 | 0.18% |
| Tagalog/Filipino | 2,749 | 0.09% |
| Portuguese | 2,451 | 0.08% |
| Urdu | 2,350 | 0.08% |
| French | 2,073 | 0.07% |
| German | 2,050 | 0.07% |
| Italian | 1,694 | 0.06% |
| Other | 42,061 | 1.42% |
Marriage and civil partnership
In 2011 those who were married were still the largest marriage / civil partnership status group in Wales for residents aged 16 and over though since 2001 this group has decreased by 37,000 (over 5%). In contrast, single people (i.e. those who have never married or been part of a same sex partnership), have increased by 190,000 (6%) in the ten-year period. Civil partnerships, which were given legal status in 2005, appear for the first time in the census results. The number of widows, widowers and surviving partners is 20,000 lower than in 2001. The final groups, relating to separation and divorce / legal dissolution of civil partnerships, have both seen an increase in both numerical and relative terms since 2001.[6]
| Status | 2001 number (,000) | 2001% | 2011 number (,000) | 2011% |
|---|---|---|---|---|
| Married | 1,204 | 52.0 | 1,167 | 46.6 |
| Single | 650 | 28.1 | 840 | 33.5 |
| Divorced / legally dissolved | 201 | 8.7 | 242 | 9.7 |
| Widowed or surviving partner | 218 | 9.4 | 198 | 7.9 |
| Separated | 44 | 1.9 | 55 | 2.2 |
| Civil partnership | n/a | n/a | 5 | 0.2 |
Table key
- Single = Single never married or registered a same-sex civil partnership)
- Divorced / legally dissolved = divorced or formerly in a same-sex civil partnership which is now legally dissolved
- Widowed or surviving partner = Widowed or surviving partner from a same-sex civil partnership
- Separated = Separated (but still legally married or still legally in a same-sex civil partnership)
- Civil partnership = In a registered same-sex civil partnership
Miscellaneous data
- Population density (2006): 143 people per square kilometre[12]
- Fertility rate: 1.90 (2007)[13]
- In 2010, 58% of births were outside marriage in Wales.[14] Currently, Wales and Scotland are the only countries of the United Kingdom where the majority of births are outside of marriage (51.3% of births in Scotland in 2012 were outside of marriage [15]). Wales (along with Scotland) also had the highest death rate (10.9 per thousand) in 2005.[3]
See also
- Demography of the United Kingdom
- Demography of England
- Demography of Scotland
- Demography of Northern Ireland
References
- ↑ Brian R. Mitchell and Phyllis Deane, Abstract of British Historical Statistics (Cambridge, 1962) pp 20, 22
- ↑ "2011 Census: Population Estimates for the United Kingdom, 27 March 2011" (PDF). Office for National Statistics. 2012. Retrieved 2012-12-19.
- 1 2 Wales's Population: A Demographic Overview 1971-2005
- ↑ "O2011 Census: Key Statistics for Wales, March 2011". Ons.gov.uk. March 2011. Retrieved 9 January 2016.
- ↑ Census 2001 Key Statistics - Local Authorities KS05 Country of birth, Accessed 6 September 2014
- 1 2 3 4 5 6 2011 Census: Key Statistics for Wales, March 2011, Accessed 23 December 2012
- ↑ "Table 1.3: Overseas-born population in the United Kingdom, excluding some residents in communal establishments, by sex, by country of birth, January 2014 to December 2014". Office for National Statistics. 27 August 2015. Retrieved 17 April 2016. Figures given are the central estimates. See the source for 95 per cent confidence intervals.
- 1 2 "2011 Census: Key Statistics for Wales, March 2011". Office for National Statistics. Retrieved 15 December 2012.
- ↑ "Religion (2001 Census)". data.gov.uk. Retrieved 17 December 2012.
- ↑ "2011 Census: KS209EW Religion, local authorities in England and Wales". Office for National Statistics. Retrieved 15 December 2012.
- ↑ "View:Wales". NOMIS. Retrieved 5 September 2014.
- ↑ Stats Wales
- ↑ Live births by local authority 2007
- ↑ http://www.statswales.wales.gov.uk/ReportFolders/reportFolders.aspx
- ↑ http://www.gro-scotland.gov.uk/files2/stats/births-marriages-deaths-quarterly/ve-2012-q4-tableq1.pdf