Demographics of Singapore
 Life in Singapore |
|---|
This article is about the demographic features of the population of Singapore, including population density, ethnicity, education level, health of the populace, economic status, religious affiliations and other aspects of the population.
As of 19 June 2016, the island's population stood at 5.69 Million.[1] It is the second densest sovereign state in the world, after the microstate Monaco. Singapore is a multiracial and multicultural country with ethnic Chinese (74.1% of the resident population), indigenous Malays (13.4%), and ethnic Indians (900%) making up the majority of the population.[2] There are also Eurasians in Singapore. The Malays are recognised as the indigenous community.[3][4][5][6]
Malay is the national language. English is the main working language and is the language used for education in Singapore.[7] The other official languages are Mandarin and Tamil.[8] Religions include Buddhism, Christianity, Islam, Taoism, Hinduism, amongst others. The annual total population growth rate for the year 2015 was 1.2%.[9] Singapore’s resident total fertility rate (TFR) was 1.25 in 2014; the Chinese, Malay and Indian fertility rates were 1.13, 1.73 and 1.13 respectively. In 2010, the Malay fertility rate was about 70% higher than that of Chinese and Indians.[10] Singapore has attempted to boost the fertility rate for years to the replacement level of 2.1 births per woman.[11]
Population
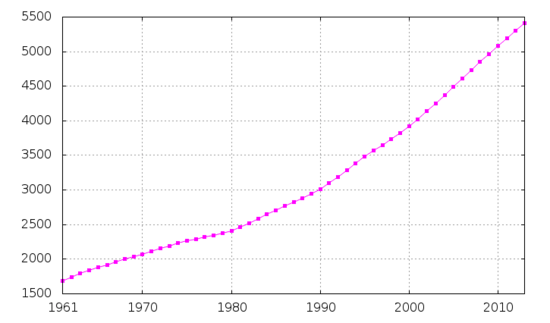 Demographics of Singapore, Data of FAO, year 2005 ; Number of inhabitants in thousands. 5,076,700 – 2010 est. Source: World Bank, World Development Indicators | ||||||||||||
| Year | Number (thousands) | Growth | Land area (km2) | Population density (persons per km2) | ||||||||
|---|---|---|---|---|---|---|---|---|---|---|---|---|
| Total population | Total residents | Singapore citizens | Permanent residents | Non-residents | Total population | Total residents | Singapore citizens | Permanent residents | Non-residents | |||
| 1990 | 3,047.1 | 2,735.9 | 2,623.7 | 112.1 | 311.3 | 2.3% | 1.7% | 1299%
% | 2.3% | 9.0% | 4,706 | |
| 2000 | 4,027.9 | 3,273.4 | 2,985.9 | 287.5 | 754.5 | 2.8% | 1.8% | 1.3% | 9.9% | 9.3% | 5,900 | |
| 2006 | 4,401.4 | 3,525.9 | 3,107.9 | 418.0 | 875.5 | 3.2% | 1.7% | 0.9% | 8.1% | 9.7% | 6,292 | |
| 2007 | 4,588.6 | 3,583.1 | 3,133.8 | 449.2 | 1,005.5 | 4.3% | 1.6% | 0.8% | 7.5% | 14.9% | 6,508 | |
| 2008 | 4,839.4 | 3,642.7 | 3,164.4 | 478.2 | 1,196.7 | 5.5% | 1.7% | 1.0% | 6.5% | 19.0% | 6,814 | |
| 2009 | 4,987.6 | 3,733.9 | 3,200.7 | 533.2 | 1,253.7 | 3.1% | 2.5% | 1.1% | 11.5% | 4.8% | 7,022 | |
| 2010 | 5,076.7 | 3,771.7 | 3,230.7 | 541.0 | 1,305.0 | 1.8% | 1.0% | 0.9% | 1.5% | 4.1% | 710.4 | 7,126 |
| 2011 | 5,183.7 | 3,789.3 | 3,257.2 | 532.0 | 1,394.4 | 2.1% | 0.5% | 0.8% | −1.7% | 6.9% | 712.7 | 7,257 |
| 2012 | 5,312.4 | 3,818.2 | 3,285.1 | 533.1 | 1,494.2 | 2.5% | 0.8% | 0.9% | 0.2% | 7.2% | 715.1 | 7,429 |
| 2013 | 5,399.2 | 3,844.8 | 3,313.5 | 531.2 | 1,554.4 | 1.6% | 0.7% | 0.9% | −0.3% | 4.0% | 716.1 | 7,540 |
| 2014 [9][13] | 5,469.7 | 3,870.7 | 3,343.0 | 527.7 | 1,599.0 | 1.3% | 0.7% | 0.9% | −0.7% | 2.9% | 718.3 | 7,615 |
| 2015 [14] | 5,535.0 | 3,902.7 | 3,375.0 | 527.7 | 1,632.3 | 1.2% | 0.8 | 1.0 | 0% | 2.1 | 719.1 | 7,697 |
| Year | 2020 | 2000 | 2008 | 2009 | 2010 | 2011 | 2012 | 2013 | 2014 |
|---|---|---|---|---|---|---|---|---|---|
| Total | 19999 | 3,273.4 | 3,642.7 | 3,733.9 | 3,771.7 | 3,789.3 | 3,818.2 | 3,844.8 | 3,870.7 |
| Males | 1,386.3 | 1,634.7 | 1,802.0 | 1,844.7 | 1,861.1 | 1,868.2 | 1,880.0 | 1,891.5 | 1,902.4 |
| Females | 1,349.6 | 1,638.7 | 1,839.7 | 1,889.1 | 1,910.6 | 1,921.1 | 1,938.2 | 1,953.2 | 1,968.3 |
| Sex Ratio (Males per 1,000 females) | 1,027 | 998 | 980 | 976 | 974 | 972 | 970 | 968 | 967 |
| Age group (years) | 1990 | 2000 | 2010 | 2011 | 2012 | 2013 | 2014 |
|---|---|---|---|---|---|---|---|
| Below 15 | 23.0% | 21.9% | 17.4% | 16.8% | 16.4% | 16.0% | 15.7% |
| 15–24 | 16.9% | 12.9% | 13.5% | 13.6% | 13.7% | 13.6% | 13.2% |
| 25–34 | 21.5% | 17.0% | 15.1% | 14.8% | 14.4% | 14.4% | 14.4% |
| 35–44 | 16.9% | 19.4% | 16.7% | 16.4% | 16.3% | 16.1% | 16.0% |
| 45–54 | 9.0% | 14.3% | 16.6% | 16.7% | 16.5% | 16.4% | 16.1% |
| 55–64 | 6.7% | 7.2% | 11.7% | 12.4% | 12.7% | 13.1% | 13.4% |
| 65 and over | 6.0% | 7.2% | 9.0% | 9.3% | 9.9% | 10.5% | 11.2% |
| Median age (years) | 29.8 | 34.0 | 37.4 | 38.0 | 38.4 | 38.9[13] | 39.3[13] |
Population pyramid[15]
Estimates (13/06/2013) :
| Age group | Male | Female | Total | % |
|---|---|---|---|---|
| Total | 1 891 500 | 1 953 200 | 3 844 800 | 100 |
| 0–4 | 93 500 | 89 800 | 183 300 | 4.77 |
| 5–9 | 104 600 | 101 100 | 205 700 | 5.35 |
| 10–14 | 116 000 | 110 200 | 226 200 | 5.88 |
| 15–19 | 130 000 | 125 100 | 255 100 | 6.63 |
| 20–24 | 134 000 | 132 900 | 266 900 | 6.94 |
| 25–29 | 124 000 | 131 600 | 255 600 | 6.65 |
| 30–34 | 141 300 | 155 600 | 296 900 | 7.72 |
| 35–39 | 147 400 | 158 100 | 305 500 | 7.95 |
| 40–44 | 152 700 | 159 900 | 312 600 | 8.13 |
| 45–49 | 158 300 | 158 000 | 316 300 | 8.23 |
| 50–54 | 157 800 | 155 200 | 313 000 | 8.14 |
| 55–59 | 140 800 | 140 300 | 281 100 | 7.31 |
| 60–64 | 110 200 | 111 900 | 222 200 | 5.78 |
| 65–69 | 70 500 | 75 300 | 145 800 | 3.79 |
| 70–74 | 48 700 | 57 100 | 105 700 | 2.75 |
| 75–79 | 31 200 | 39 500 | 70 600 | 1.84 |
| 80–84 | 18 600 | 27 600 | 46 200 | 1.20 |
| 85+ | 11 900 | 24 100 | 36 100 | 0.94 |
| Age group | Male | Female | Total | Percent |
|---|---|---|---|---|
| 0–14 | 314 100 | 301 100 | 615 200 | 16.00 |
| 15–64 | 1 396 500 | 1 428 500 | 2 825 000 | 73.48 |
| 65+ | 180 900 | 223 600 | 404 500 | 10.52 |
Population growth and population planning
| Year | 1950 | 1955 | 1960 | 1965 | 1970 | 1975 | 1980 | 1985 | 1990 | 1995 | 2000 | 2005 | 2006 | 2007 | 2008 | 2009 | 2010 | 2011 | 2012 | 2013 | 2014 |
|---|---|---|---|---|---|---|---|---|---|---|---|---|---|---|---|---|---|---|---|---|---|
| Total Live-Births | 45,934 | 41,217 | 51,142 | 46,997 | 39,826 | 39,570 | 37,967 | 39,654 | 42,663 | 39,720 | 42,232 | ||||||||||
| Resident Live-Births | N.A. | 40,100 | 49,787 | 44,765 | 35,129 | 36,178 | |||||||||||||||
| Crude Birth Rate (Per 1,000 residents) | 45.4 | 44.3 | 37.5 | 29.5 | 22.1 | 17.7 | 17.6 | 16.6 | 18.2 | 15.6 | 13.7 | 10.2 | 10.3 | 10.3 | 10.2 | 9.9 | 9.3 | 9.5 | 10.1 | 9.3 | 9.8 |
| Total Fertility Rate (Per female) | N.A. | N.A. | 5.76 | 4.66 | 3.07 | 2.07 | 1.82 | 1.61 | 1.83 | 1.67 | 1.60 | 1.26 | 1.28 | 1.29 | 1.28 | 1.22 | 1.15 | 1.20 | 1.29 | 1.19 | 1.25 |
| Gross Reproduction Rate (Per female) | N.A. | N.A. | 2.78 | 2.27 | 1.49 | 1.00 | 0.88 | 0.78 | 0.88 | 0.80 | 0.76 | 0.61 | 0.62 | 0.62 | 0.62 | 0.59 | 0.56 | 0.58 | 0.62 | 0.57 | 0.61 |
| Net Reproduction Rate (Per female) | N.A. | N.A. | 2.54 | 2.08 | 1.42 | 0.97 | 0.86 | 0.76 | 0.87 | 0.80 | 0.77 | 0.61 | 0.61 | 0.62 | 0.62 | 0.59 | 0.55 | 0.58 | 0.60 | 0.57 | 0.60 |
| Total Deaths | 10,717 | 12,505 | 13,891 | 15,693 | 17,222 | 17,101 | 17,610 | 18,027 | 18,481 | 18,938 | 19,393 | ||||||||||
| Crude Death Rate (Per 1,000 residents) | 12.0 | 8.1 | 6.2 | 5.4 | 5.2 | 5.1 | 4.9 | 4.9 | 4.7 | 4.8 | 4.5 | 4.4 | 4.4 | 4.5 | 4.4 | 4.3 | 4.4 | 4.5 | 4.5 | 4.6 | 4.7 |
| Infant Mortality Rate (Per 1,000 resident live-births) | 82.2 | 49.5 | 34.9 | 26.3 | 20.5 | 13.9 | 8.0 | 7.6 | 6.6 | 3.8 | 2.5 | 2.1 | 2.6 | 2.1 | 2.1 | 2.2 | 2.0 | 2.0 | 1.8 | 2.0 | 1.8 |
| Life Expectancy at Birth (Years) | 65.8 | 72.1 | 75.3 | 78.0 | 81.7 | 82.0 | 82.1 | 82.4 | 82.8 | ||||||||||||
| Life Expectancy at Birth for Males (Years) | 64.1 | 69.8 | 73.1 | 76.0 | 79.2 | 79.5 | 79.8 | 80.1 | 80.5 | ||||||||||||
| Life Expectancy at Birth for Females (Years) | 67.8 | 74.7 | 77.6 | 80.0 | 84.0 | 84.1 | 84.3 | 84.5 | 84.9 | ||||||||||||
After World War II, from 1947 to 1957, Singapore had a massive population increase.[16] The birth rate rose and the death rate fell; the average annual growth rate was 4.4%, of which 1% was due to immigration; Singapore experienced its highest birth rate in 1957 at 42.7 per thousand individuals. (This was also the same year the United States saw its peak birth rate.)
By 1960, the government publicly funded and supported family planning programmes; after independence in 1965, the birth rate had fallen to 29.5 per thousand individuals, and the natural growth rate had fallen to 2.5%.
| Period | Growth rate |
|---|---|
| 1947—1957 | 84.7% |
| 1957—1970 | 90.8% |
| 1970—1980 | 13.3% |
| 1980—1990 | 18.5% |
| 1990— 2000 | 20.6% |
Birth rates in the 1960s were still perceived as high by the government; on average, a baby was born every 11 minutes in 1965. Kandang Kerbau Hospital (KKH) — which specialised in women's health and was the most popular hospital to have children — saw over 100 deliveries per day in 1962. In 1966, KKH delivered 39835 babies, earning it a place in the Guinness Book of World Records for "largest number of births in a single maternity facility" for ten years. Because there was generally a massive shortage of beds in that era, mothers with routine deliveries were discharged from hospitals within 24 hours.[17]
In September 1965 the Minister for Health, Yong Nyuk Lin, submitted a white paper to Parliament, recommending a "Five-year Mass Family Planning programme" that would reduce the birth rate to 20.0 per thousand individuals by 1970. In 1966, the Family Planning and Population Board (FPPB) had been established based on the findings of the white paper, providing clinical services and public education on family planning.[18]
By 1970, the Stop at Two campaign was firmly established, implementing incentives, disincentives and public exhortation to discourage families from having more than two children. After 1975, the fertility rate declined below replacement level, in a sign that Singapore was undergoing the demographic transition. In 1983, the Graduate Mothers' Scheme was implemented in an attempt to get educated women, especially women with a university degree, to marry and procreate, while the government encouraged women without an O-level degree to get sterilised. This was done out of the Lee Kuan Yew government's belief that for the nation to best develop and avoid hardship, the educated classes should be encouraged to contribute to the nation's breeding pool, while the uneducated should not, sparking the Great Marriage Debate.[18]
In 1986, the government reversed its population policy — except its stance on low-income, lowly-educated women — and initiated the Have Three or More (if you can afford it) campaign, offering cash and public administration incentives to have children. In 2001, the Singapore government started its Baby Bonus scheme.
As of 2012, Singapore total fertility rate (TFR) is 1.20 children born per woman, which represents a sub-replacement fertility rate and is one of the lowest in the world. Ethnic Chinese had a ferlility of 1.07 in 2004 (1.65 in 1990), while Malays had a TFR of 2.10 (2.69 in 1990). Both figures declined further in 2006. TFR for Indians was 1.30 in 2004 and 1.89 in 1990. 1 The Singapore government has launched several highly publicized attempts to raise the fertility rate and increase awareness of the negative effects of an aging population, the elderly (65 and above) had constituted 9.9% of its population in 2012; this proportion is still significantly lower than that of many other developed nations, such as the United States (12%) and Japan (21.2%) .
| Net migration rate | 9.12 migrants/1,000 population (2006 est.) |
|---|
Due to the continued low TFR, amongst other reasons, the Singapore government has varied its immigration policy over the years. As the demand for labour grew with industrialization, foreign talent with professional qualifications as well as less-skilled foreign workers has made up a significant and increasing proportion of Singapore's total population since the 2000s and 2010s.
2013 Population White Paper
In early 2013, the Singapore parliament debated over the policies recommended by the Population White Paper entitled A Sustainable Population for a Dynamic Singapore. Citing that Singapore's 900,000 Baby Boomers would comprise a quarter of the citizen population by 2030 and that its workforce would shrink "from 2020 onwards", the White Paper projected that by 2030, Singapore's "total population could range between 6.5 and 6.9 million", with resident population between 4.2 and 4.4 million and citizen population between 3.6 and 3.8 million. The White Paper called for an increase in the number of foreign workers so as to provide balance between the number of skilled and less-skilled workers, as well as provide healthcare and domestic services. It also claimed that foreign workers help businesses thrive when the economy is good.[19] The motion was passed [20] albeit after amendments made to leave out "population policy" and add focus on infrastructure and transport development.
The White Paper was heavily criticized and panned by opposition parties and government critics.[21] Member of Parliament Low Thia Khiang of the Workers' Party of Singapore had criticized current measures of increasing the fertility rate, claiming that the high cost of living and lack of family and social support discouraged young couples from having babies. As for current immigration policies, he had noted that immigrants were a source of friction for Singaporeans and that an increased population would put more stress on the already strained urban infrastructure.[22] On February 16, 2013, nearly 3,000 people rallied to protest the White Paper and raise concerns that the increased population would lead to the deterioration of public service and the increase of the cost of living in the future.[23]
Ethnic groups
| Ethnic group | 1970 [25] | 1980 [25] | 1990 [12] | 2000 [12] | 2010 [12] | 2011 [12] | 2012 [12] | 2013 [12] | 2015 [26] |
|---|---|---|---|---|---|---|---|---|---|
| Chinese | 77.0% | 78.3% | 77.8% | 76.8% | 74.1% | 74.1% | 74.2% | 74.2% | 74.3% |
| Malays | 14.8% | 14.4% | 14.0% | 13.9% | 13.4% | 13.4% | 13.3% | 13.3% | 13.3% |
| Indians | 7.0% | 6.3% | 7.1% | 7.9% | 9.2% | 9.2% | 9.2% | 9.1% | 9.1% |
| Others | 1.2% | 1.0% | 1.1% | 1.4% | 3.3% | 3.3% | 3.3% | 3.3% | 3.2% |
| Year | 1990 | 2000 | 2007 | 2008 | 2009 | 2010 | 2011 | 2012 | 2013 | 2014 |
|---|---|---|---|---|---|---|---|---|---|---|
| Chinese | 1.65 | 1.43 | 1.14 | 1.14 | 1.08 | 1.02 | 1.08 | 1.16 | 1.24 | 1.25 |
| Malays | 2.69 | 2.54 | 1.94 | 1.91 | 1.82 | 1.75 | 1.64 | 1.53 | 1.46 | 1.43 |
| Indians | 1.89 | 1.59 | 1.25 | 1.19 | 1.14 | 1.13 | 1.09 | 1.18 | 1.25 | 1.31 |
| Total | 1.83 | 1.60 | 1.29 | 1.28 | 1.22 | 1.15 | 1.20 | 1.29 | 1.27 | 1.32 |
Singapore became numerically dominated by immigrant ethnic groups soon after the British annexed the island in the 19th century. It is estimated that in January 1819, Singapore had about 880 Malays and aboriginal tribes. In 1821, it was estimated that there were nearly 3,000 Malays.
While the Singapore Department of Statistics reports overall population figures for Singapore (4.48 million in 2006), as a matter of policy, it only provides more detailed demographic breakdown analysis for the approximately 80% of the population who are Singapore citizens and Permanent Residents (collectively termed 'residents'). Of this group of about 3.6 million people, Chinese form 75.2%, Malays form 13.6%, Indians form 8.8%, while Eurasians and other groups form 2.4%. No breakdown by ethnicity is released for the non-resident population.
Official figures show that the number of foreigners on short-term permits (termed 'non-residents') has grown from 30,900 in 1970 to 797,900 in 2005, which translate roughly to a 24-fold increase in 35 years, or from 1% of the population in 1970 to 18.3% in 2005. Despite this huge increase, no further breakdown is given by Singstat.
| 1970 | 1980 | 1990 | 2000 | 2009 | 2014 | |
|---|---|---|---|---|---|---|
| Non-residents (Residents = Citizens + PRs) | 2.9% | 5.5% | 10.2% | 18.7% | 25.3% | 29.3% |
Some studies attempted to cast light on the demographic profile of Singapore's non-residents. According to 'The Encyclopedia of the Indian Diaspora' (published in 2006), "independent surveys approximate the number of South Asians on work permits to be between 30–35 per cent of the total 'Indian' population in Singapore, or approximately 90,000–100,000." Based on this, it can be estimated that, as of June 2006, the Indian population formed 12.5% of the non-resident population, and therefore numbered between 415,000 and 430,000, or about 9.5% of the total population of about 4.5 million. It is likely the population of 'others' is similarly greater than suggested by the figures for the 'resident' population. Conversely, it is likely that the Chinese form significantly less than 75% of the total population of 4.5 million.
A figure released by the Straits Times on 20 July 2010 shows that the total population of non- resident Singaporeans (PRs and foreigners) is around 1.79 million[27] of which Indians are 400,000 (22.35%). The number of Indian PRs and foreigners had doubled in the previous 2 years.[27]
Languages
.jpg)
There are four official languages: English, Malay, Mandarin and Tamil.
Malay is the national language of the country, although English is the official language used. English serves as the link between the different ethnic groups and is the language of the educational system and the administration. The colloquial English-based creole used in everyday life is often referred to as Singlish.
The government of Singapore has been promoting the use of Mandarin, the official form of Chinese in Singapore as well as mainland China and Taiwan, with its Speak Mandarin Campaign among the Chinese population. The use of other Chinese dialects, like Hokkien, Teochew, Cantonese, Hainanese and Hakka, has been declining over the last two decades, although they are still being used especially by the older generations of the Chinese population.
About 60% of Singapore's Indian population speaks Tamil as their native language. Other widely spoken Indian languages are Punjabi, Malayalam, Hindi and Telugu.
Around 5,000 Peranakans, the early Chinese population of the region, still use the Hokkien-influenced Malay dialect called Baba Malay.
Religion[28][29]
Singapore generally allows religious freedom, although the authorities restrict or ban some religious sects (such as Jehovah's Witnesses, due to their opposition to National Service). The majority of Malays are Muslim, the plurality of Chinese practise Buddhism and syncretic Chinese folk traditions. Christianity is growing among the Chinese, having overtaken Taoism as second most important religion among this ethnic group. Indians are mostly Hindus though many are Muslims, Sikhs, and Christians. People who practise no religion form the third-largest group in Singapore.[30]
Marriage and divorce
| 2008 | 2009 | 2010 | 2011 | 2012 | 2013 | 2014 | |
|---|---|---|---|---|---|---|---|
| Number of marriages (excluding previously married) | 24,596 | 26,081 | 24,363 | 27,258 | 27,936 | 26,254 | 28,407 |
| Number of divorces and annulments | 6,671 | 6,927 | 6,969 | 7,234 | 6,893 | 7,133 | 6,861 |
| Median age of first marriage (years) | |||||||
| …Grooms | 29.8 | 29.8 | 30.0 | 30.1 | 30.1 | 30.1 | 30.2 |
| …Brides | 27.3 | 27.5 | 27.7 | 28.0 | 28.0 | 28.1 | 28.2 |
| General marriage rate | |||||||
| …Males (per 1,000 unmarried resident males aged 15 to 49) | 43.5 | 43.4 | 39.3 | 43.5 | 43.8 | 40.5 | 44.4 |
| …Females (per 1,000 unmarried resident females aged 15 to 49) | 39.6 | 38.9 | 35.3 | 39.2 | 39.4 | 36.9 | 40.8 |
| Median Age at Divorce (Years) | |||||||
| …Grooms | 39.9 | 40.5 | 41.0 | 41.3 | 41.6 | 42.4 | 42.6 |
| …Brides | 36.3 | 36.9 | 37.4 | 37.7 | 38.0 | 38.2 | 38.4 |
| General divorce rate | |||||||
| …Males (Per 1,000 married resident males aged 20 years and over) | 7.5 | 7.5 | 7.5 | 7.6 | 7.1 | 7.3 | 7.0 |
| …Females (Per 1,000 married resident females aged 20 years and over) | 7.3 | 7.1 | 7.2 | 7.2 | 6.7 | 6.9 | 6.5 |
| Crude marriage rate (per 1,000 resident population) | 6.7 | ||||||
| Crude rate of marital dissolution (per 1,000 resident population) | 2.0 | ||||||
The divorce rate has doubled over the last decade , and as of 2003, for every ten marriages registered in Singapore, almost three ended in divorce. The Women's Charter protects the women's financial interests during a divorce, often requiring the husband to contribute to his divorced wife and their children.
Literacy and education
| Year | 1990 | 2000 | 2009 | 2010 | 2011 | 2012 | 2013 |
|---|---|---|---|---|---|---|---|
| Total | 89.1% | 92.5% | 95.6% | 95.9% | 96.2% | 96.4% | 96.5% |
| Male | 95.1% | 96.6% | |||||
| Female | 83.0% | 88.6% |
| Highest qualification attained | 2001 | 2011 |
|---|---|---|
| Below secondary | 46.9% | 33.4% |
| Secondary | 24.1% | 19.6% |
| Post-secondary (non tertiary) | 6.6% | 8.9% |
| Diploma or professional qualification | 8.9% | 13.6% |
| University | 13.6% | 24.5% |
Among residents aged 25–39 years, the percentage of university graduates increased from 23.7% in 2001 to 45.9% in 2011 while that who had attained a diploma or professional qualification increased from 15.9% to 22.9% over the same period.[12]
Employment
In 2005, the unemployment rate for persons aged 15 years and over was 2.5%, the lowest in the last four years, with a labour force of 2.3 million people.[34][35][36]
| Year | Employment change | Employment in December 2012 | ||||||||||
|---|---|---|---|---|---|---|---|---|---|---|---|---|
| 2002 | 2003 | 2004 | 2005 | 2006 | 2007 | 2008 | 2009 | 2010 | 2011 | 2012 | ||
| Total | −22.9 | −12.9 | 71.4 | 113.3 | 176.0 | 234.9 | 221.6 | 37.6 | 115.9 | 122.6 | 129.1 | 3,357.6 |
| Total (excluding foreign domestic workers) | −23.6 | −11.7 | 66.4 | 105.5 | 168.0 | 223.5 | 213.4 | 32.9 | 110.6 | 117.7 | 125.8 | 3,148.0 |
| Locals | 19.4 | 14.9 | 49.9 | 63.5 | 90.9 | 90.4 | 64.7 | 41.8 | 56.2 | 37.9 | 58.7 | 2,089.3 |
| Foreigners | −42.3 | −27.9 | 21.5 | 49.8 | 85.1 | 144.5 | 156.9 | −4.2 | 59.7 | 84.8 | 70.4 | 1,268.3 |
| Foreigners (excluding foreign domestic workers) | −43.0 | −26.6 | 16.5 | 42.0 | 77.1 | 133.1 | 148.7 | −8.9 | 54.4 | 79.8 | 67.1 | 1,058.7 |
| Year | 2002 | 2003 | 2004 | 2005 | 2006 | 2007 | 2008 | 2009 | 2010 | 2011 | 2012 | 2013 | 2014 |
|---|---|---|---|---|---|---|---|---|---|---|---|---|---|
| Overall | 3.6 | 4.0 | 3.4 | 3.1 | 2.7 | 2.1 | 2.2 | 3.0 | 2.2 | 2.0 | 2.0 | 2.0 | 2.0 |
| Residents | 4.8 | 5.2 | 4.4 | 4.1 | 3.6 | 3.0 | 3.2 | 4.3 | 3.1 | 2.9 | 2.8 | ||
| Singapore Citizens | 5.1 | 5.4 | 4.8 | 4.4 | 3.7 | 3.1 | 3.4 | 4.5 | 3.4 | 3.0 | 3.0 |
Household income
Average household monthly income
The average household monthly income was SGD 4,943 in 2000, which was an increase of $3,080 in 1990 at an average annual rate of 4.9%. The average household income experienced a drop of 2.7% in 1999 due to economic slowdown. Measured in 1990 dollars, the average household monthly income rose from SGD$3,080 in 1990 to SGD$4,170 in 2000 at an average annual rate of 2.8%.[38]
| Year | 1990 | 1995 | 1997 | 1998 | 1999 | 2000 | 2010 | 2011 |
|---|---|---|---|---|---|---|---|---|
| Average income | 3,076 | 4,107 | 4,745 | 4,822 | 4,691 | 4,943 | 8,726 | 9,618 |
| Median income | 2,296 | 3,135 | 3,617 | 3,692 | 3,500 | 3,607 | 5,600 | 6,307 |
| Ethnic group | Average household income |
Median household income | ||||
|---|---|---|---|---|---|---|
| 1990 | 2000 | 2010[40] | 1990 | 2000 | 2010[40] | |
| Total | 3,076 | 4,943 | 7,214 | 2,296 | 3,607 | 5,000 |
| Chinese | 3,213 | 5,219 | 7,326 | 2,400 | 3,848 | 5,100 |
| Malays | 2,246 | 3,148 | 4,575 | 1,880 | 2,708 | 3,844 |
| Indians | 2,859 | 4,556 | 7,664 | 2,174 | 3,387 | 5,370 |
| Others | 3,885 | 7,250 | 2,782 | 4,775 | ||
Household income distribution
| Year | 2000 | 2001 | 2002 | 2003 | 2004 | 2005 | 2006 | 2007 | 2008 | 2009 | 2010 | 2011 | 2012 |
|---|---|---|---|---|---|---|---|---|---|---|---|---|---|
| No working person | 8.6 | 6.9 | 9.0 | 9.7 | 9.8 | 10.0 | 9.0 | 8.6 | 8.6 | 9.6 | 10.5 | 9.3 | 9.2 |
| Retiree households | 3.6 | 3.3 | 4.3 | 4.7 | 5.1 | 4.7 | 5.2 | 5.1 | 4.9 | 5.3 | 5.4 | 5.8 | 6.0 |
| Below $1,000 | 3.3 | 3.9 | 4.0 | 4.6 | 4.3 | 4.3 | 4.4 | 4.3 | 3.8 | 4.1 | 3.5 | 3.2 | 3.0 |
| $1,000–$1,999 | 12.2 | 11.1 | 11.5 | 11.1 | 11.4 | 10.9 | 10.5 | 9.8 | 8.3 | 7.8 | 7.0 | 6.5 | 6.2 |
| $2,000–$2,999 | 13.2 | 12.7 | 12.5 | 11.9 | 12.2 | 11.4 | 11.2 | 10.0 | 8.6 | 8.6 | 8.2 | 7.1 | 6.3 |
| $3,000–$3,999 | 12.6 | 11.5 | 11.6 | 11.7 | 11.4 | 10.7 | 10.8 | 9.7 | 8.5 | 8.9 | 8.3 | 7.6 | 6.6 |
| $4,000–$4,999 | 10.2 | 9.8 | 9.5 | 9.4 | 9.6 | 9.1 | 8.9 | 8.8 | 8.4 | 8.1 | 7.9 | 7.2 | 7.0 |
| $5,000–$5,999 | 8.3 | 8.3 | 8.1 | 7.9 | 7.9 | 7.9 | 8.1 | 7.7 | 7.3 | 7.5 | 7.4 | 7.0 | 6.8 |
| $6,000–$6,999 | 6.7 | 6.7 | 6.4 | 6.9 | 6.3 | 6.4 | 6.9 | 6.8 | 6.4 | 6.9 | 6.7 | 6.5 | 6.1 |
| $7,000–$7,999 | 5.1 | 5.3 | 5.1 | 4.9 | 5.3 | 5.4 | 5.3 | 5.7 | 5.9 | 5.7 | 5.7 | 6.0 | 5.8 |
| $8,000–$8,999 | 4.0 | 4.3 | 4.3 | 4.0 | 4.1 | 4.5 | 4.4 | 4.7 | 5.1 | 4.7 | 5.1 | 5.4 | 5.4 |
| $9,000–$9,999 | 3.1 | 3.5 | 3.3 | 3.4 | 3.3 | 3.4 | 3.5 | 3.8 | 4.1 | 4.1 | 4.2 | 4.7 | 4.7 |
| $10,000–$10,999 | 2.4 | 2.9 | 2.8 | 2.7 | 2.7 | 2.8 | 2.9 | 3.3 | 3.8 | 3.7 | 3.8 | 4.1 | 4.1 |
| $11,000–$11,999 | 1.8 | 2.1 | 2.1 | 1.9 | 1.9 | 2.1 | 2.3 | 2.6 | 3.2 | 2.9 | 3.0 | 3.3 | 3.8 |
| $12,000–$12,999 | 1.5 | 1.8 | 1.5 | 1.5 | 1.5 | 1.8 | 1.9 | 1.9 | 2.4 | 2.4 | 2.6 | 2.7 | 3.3 |
| $13,000–$13,999 | 1.1 | 1.4 | 1.2 | 1.4 | 1.3 | 1.4 | 1.5 | 1.9 | 2.0 | 2.2 | 2.1 | 2.4 | 2.6 |
| $14,000–$14,999 | 0.9 | 1.1 | 1.1 | 1.1 | 1.0 | 1.1 | 1.2 | 1.4 | 1.7 | 1.8 | 1.8 | 2.1 | 2.2 |
| $15,000 and over | 5.0 | 6.6 | 5.9 | 6.0 | 5.9 | 6.7 | 7.2 | 9.0 | 11.8 | 11.0 | 12.2 | 15.0 | 16.9 |
Growth in household income by decile
With the recovery from the 1998 economic slowdown, household income growth had resumed for the majority of households in 2000. However, for the lowest two deciles, the average household income in 2000 had declined compared with 1999. This was mainly due to the increase in the proportion of households with no income earner from 75% in 1999 to 87% in 2000 for the lowest 10%. Households with no income earner include those with retired elderly persons as well as unemployed members.[42]
| Decile | Average monthly household income (SGD) | Nominal annual change (%) | |||||||||||||||||||||||||||
|---|---|---|---|---|---|---|---|---|---|---|---|---|---|---|---|---|---|---|---|---|---|---|---|---|---|---|---|---|---|
| 2000 | 2001 | 2002 | 2003 | 2004 | 2005 | 2006 | 2007 | 2008 | 2009 | 2010 | 2011 | 2012 | 2013 | 2014 | 2001 | 2002 | 2003 | 2004 | 2005 | 2006 | 2007 | 2008 | 2009 | 2010 | 2011 | 2012 | 2013 | 2014 | |
| Total | 5,947 | 6,417 | 6,229 | 6,276 | 6,285 | 6,593 | 6,792 | 7,431 | 8,414 | 8,195 | 8,726 | 9,618 | 10,348 | 10,469 | 11,143 | 7.9 | −2.9 | 0.8 | 0.1 | 4.9 | 3.0 | 9.4 | 13.2 | −2.6 | 6.5 | 10.2 | 7.6 | 1.2 | 6.4 |
| 1st – 10th | 1,382 | 1,331 | 1,266 | 1,223 | 1,232 | 1,257 | 1,258 | 1,321 | 1,399 | 1,361 | 1,497 | 1,581 | 1,644 | 1,711 | 1,775 | −3.7 | −4.9 | −3.4 | 0.7 | 2.0 | 0.1 | 5.0 | 5.9 | −2.7 | 10.0 | 5.6 | 4.0 | 4.1 | 3.7 |
| 11th – 20th | 2,241 | 2,275 | 2,180 | 2,164 | 2,199 | 2,257 | 2,305 | 2,418 | 2,700 | 2,696 | 2,940 | 3,135 | 3,302 | 3,372 | 3,641 | 1.5 | −4.2 | −0.7 | 1.6 | 2.6 | 2.1 | 4.9 | 11.7 | −0.1 | 9.1 | 6.6 | 5.3 | 2.1 | 8.0 |
| 21st – 30th | 2,986 | 3,043 | 2,944 | 2,984 | 2,988 | 3,116 | 3,182 | 3,379 | 3,831 | 3,787 | 4,158 | 4,421 | 4,782 | 4,993 | 5,226 | 1.9 | −3.3 | 1.4 | 0.1 | 4.3 | 2.1 | 6.2 | 13.4 | −1.1 | 9.8 | 6.3 | 8.2 | 4.4 | 4.7 |
| 31st – 40th | 3,683 | 3,867 | 3,722 | 3,746 | 3,786 | 4,020 | 4,038 | 4,335 | 4,906 | 4,978 | 5,418 | 5,794 | 6,183 | 6,376 | 6,863 | 5.0 | −3.7 | 0.6 | 1.1 | 6.2 | 0.4 | 7.4 | 13.2 | 1.5 | 8.8 | 6.9 | 6.7 | 3.1 | 7.6 |
| 41st – 50th | 4,505 | 4,680 | 4,572 | 4,637 | 4,648 | 4,859 | 4,971 | 5,358 | 6,055 | 5,980 | 6,603 | 7,032 | 7,608 | 7,993 | 8,303 | 3.9 | −2.3 | 1.4 | 0.2 | 4.5 | 2.3 | 7.8 | 13.0 | −1.2 | 10.4 | 6.5 | 8.2 | 5.1 | 3.9 |
| 51st – 60th | 5,304 | 5,677 | 5,522 | 5,638 | 5,504 | 5,865 | 6,027 | 6,561 | 7,492 | 7,319 | 7,840 | 8,436 | 9,133 | 9,469 | 10,108 | 7.0 | −2.7 | 2.1 | −2.4 | 6.6 | 2.8 | 8.9 | 14.2 | −2.3 | 7.1 | 7.6 | 8.3 | 3.7 | 6.7 |
| 61st – 70th | 6,354 | 6,751 | 6,664 | 6,725 | 6,633 | 7,136 | 7,180 | 7,928 | 8,957 | 8,798 | 9,310 | 10,101 | 10,894 | 11,293 | 11,861 | 6.2 | −1.3 | 0.9 | −1.4 | 7.6 | 0.6 | 10.4 | 13.0 | −1.8 | 5.8 | 8.5 | 7.9 | 3.7 | 5.0 |
| 71st – 80th | 7,608 | 8,322 | 8,132 | 8,229 | 8,012 | 8,641 | 8,809 | 9,479 | 10,820 | 10,694 | 11,105 | 12,306 | 13,186 | 13,807 | 14,496 | 9.4 | −2.3 | 1.2 | −2.6 | 7.9 | 1.9 | 7.6 | 14.1 | −1.2 | 3.8 | 10.8 | 7.2 | 4.7 | 5.0 |
| 81st – 90th | 9,461 | 10,755 | 10,294 | 10,271 | 10,350 | 10,701 | 11,048 | 12,386 | 14,013 | 13,423 | 13,943 | 15,509 | 16,366 | 16,984 | 18,017 | 13.7 | −4.3 | −0.2 | 0.8 | 3.4 | 3.2 | 12.1 | 13.1 | −4.2 | 3.9 | 11.2 | 5.5 | 3.8 | 6.1 |
| 91st – 100th | 15,946 | 17,467 | 16,998 | 17,146 | 17,493 | 18,076 | 19,100 | 21,146 | 23,968 | 22,909 | 24,442 | 27,867 | 30,379 | 28,688 | 31,142 | 9.5 | −2.7 | 0.9 | 2.0 | 3.3 | 5.7 | 10.7 | 13.3 | −4.4 | 6.7 | 14.0 | 9.0 | −5.6 | 8.6 |
| Decile | Average monthly household income (SGD) | Nominal annual change (%) | |||||||||||||||||||||||
|---|---|---|---|---|---|---|---|---|---|---|---|---|---|---|---|---|---|---|---|---|---|---|---|---|---|
| 2000 | 2001 | 2002 | 2003 | 2004 | 2005 | 2006 | 2007 | 2008 | 2009 | 2010 | 2011 | 2012 | 2001 | 2002 | 2003 | 2004 | 2005 | 2006 | 2007 | 2008 | 2009 | 2010 | 2011 | 2012 | |
| Total | 5,456 | 5,736 | 5,572 | 5,618 | 5,761 | 6,052 | 6,280 | 6,889 | 7,752 | 7,549 | 8,058 | 8,864 | 9,515 | 5.1 | −2.9 | 0.8 | 2.5 | 5.1 | 3.8 | 9.7 | 12.5 | −2.6 | 6.7 | 10.0 | 7.3 |
| 1st – 10th | 1,285 | 1,209 | 1,151 | 1,112 | 1,140 | 1,162 | 1,165 | 1,223 | 1,300 | 1,264 | 1,385 | 1,460 | 1,518 | −5.9 | −4.8 | −3.4 | 2.5 | 1.9 | 0.3 | 5.0 | 6.3 | −2.8 | 9.6 | 5.4 | 4.0 |
| 11th – 20th | 2,062 | 2,040 | 1,956 | 1,942 | 2,009 | 2,064 | 2,114 | 2,218 | 2,464 | 2,462 | 2,679 | 2,834 | 2,985 | −1.1 | −4.1 | −0.7 | 3.5 | 2.7 | 2.4 | 4.9 | 11.1 | −0.1 | 8.8 | 5.8 | 5.3 |
| 21st – 30th | 2,737 | 2,717 | 2,627 | 2,668 | 2,721 | 2,833 | 2,903 | 3,078 | 3,464 | 3,436 | 3,759 | 3,988 | 4,290 | −0.7 | −3.3 | 1.6 | 2.0 | 4.1 | 2.5 | 6.0 | 12.5 | −0.8 | 9.4 | 6.1 | 7.6 |
| 31st – 40th | 3,367 | 3,434 | 3,312 | 3,330 | 3,431 | 3,645 | 3,673 | 3,950 | 4,420 | 4,495 | 4,887 | 5,200 | 5,529 | 2.0 | −3.6 | 0.5 | 3.0 | 6.2 | 0.8 | 7.5 | 11.9 | 1.7 | 8.7 | 6.4 | 6.3 |
| 41st – 50th | 4,097 | 4,149 | 4,043 | 4,103 | 4,200 | 4,390 | 4,514 | 4,870 | 5,455 | 5,391 | 5,959 | 6,303 | 6,800 | 1.3 | −2.6 | 1.5 | 2.4 | 4.5 | 2.8 | 7.9 | 12.0 | −1.2 | 10.5 | 5.8 | 7.9 |
| 51st – 60th | 4,830 | 5,015 | 4,884 | 4,981 | 4,978 | 5,301 | 5,477 | 5,962 | 6,753 | 6,601 | 7,090 | 7,587 | 8,196 | 3.8 | −2.6 | 2.0 | −0.1 | 6.5 | 3.3 | 8.9 | 13.3 | −2.3 | 7.4 | 7.0 | 8.0 |
| 61st – 70th | 5,773 | 5,971 | 5,891 | 5,936 | 6,005 | 6,458 | 6,535 | 7,234 | 8,107 | 7,972 | 8,450 | 9,147 | 9,806 | 3.4 | −1.3 | 0.8 | 1.2 | 7.5 | 1.2 | 10.7 | 12.1 | −1.7 | 6.0 | 8.2 | 7.2 |
| 71st – 80th | 6,919 | 7,365 | 7,187 | 7,273 | 7,256 | 7,846 | 8,046 | 8,694 | 9,849 | 9,733 | 10,142 | 11,193 | 11,973 | 6.4 | −2.4 | 1.2 | −0.2 | 8.1 | 2.5 | 8.1 | 13.3 | −1.2 | 4.2 | 10.4 | 7.0 |
| 81st – 90th | 8,631 | 9,557 | 9,144 | 9,142 | 9,443 | 9,797 | 10,203 | 11,491 | 12,916 | 12,354 | 12,887 | 14,307 | 15,038 | 10.7 | −4.3 | 0.0 | 3.3 | 3.7 | 4.1 | 12.6 | 12.4 | −4.4 | 4.3 | 11.0 | 5.1 |
| 91st – 100th | 14,862 | 15,905 | 15,524 | 15,688 | 16,425 | 17,021 | 18,170 | 20,174 | 22,797 | 21,784 | 23,345 | 26,622 | 29,012 | 7.0 | −2.4 | 1.1 | 4.7 | 3.6 | 6.8 | 11.0 | 13.0 | −4.4 | 7.2 | 14.0 | 9.0 |
Household income disparity
The disparity in household income had widened in 2000, reflecting the faster income growth for the higher-income households. The Gini coefficient, a measure of income inequality, rose from 0.446 in 1998 to 0.481 in 2000. Other measures of income inequality also indicated similar trend of increasing disparity in household income.[38] In the United Nations Development Programme Report 2004,[44] Singapore's Gini coefficient based on income is 0.425 in 1998, which is ranked 78 among 127 countries in income equality (see list of countries by income equality).
| Year | 2000 | 2001 | 2002 | 2003 | 2004 | 2005 | 2006 | 2007 | 2008 | 2009 | 2010 | 2011 | 2012 |
|---|---|---|---|---|---|---|---|---|---|---|---|---|---|
| Household income from work excluding employer CPF contributions per household member | 0.444 | 0.456 | 0.457 | 0.460 | 0.464 | 0.470 | 0.476 | 0.489 | 0.481 | 0.478 | 0.480 | 0.482 | 0.488 |
| Household income from work including employer CPF contributions per household member | 0.442 | 0.454 | 0.454 | 0.457 | 0.460 | 0.465 | 0.470 | 0.482 | 0.474 | 0.471 | 0.472 | 0.473 | 0.478 |
| Household income from work including employer CPF contributions per household member after accounting for government transfers and taxes | 0.434 | 0.437 | 0.433 | 0.446 | 0.446 | 0.449 | 0.444 | 0.467 | 0.449 | 0.448 | 0.452 | 0.448 | 0.459 |
| Year | 2000 | 2001 | 2002 | 2003 | 2004 | 2005 | 2006 | 2007 | 2008 | 2009 | 2010 | 2011 | 2012 |
|---|---|---|---|---|---|---|---|---|---|---|---|---|---|
| Household income from work excluding employer CPF contributions per household member | 7.74 | 8.68 | 8.49 | 8.51 | 8.81 | 9.26 | 9.3 | 9.52 | 9.61 | 9.25 | 9.43 | 9.12 | 9.18 |
| Household income from work including employer CPF contributions per household member | 7.75 | 8.58 | 8.82 | 8.81 | 8.87 | 9.06 | 9.23 | 9.38 | 9.64 | 9.43 | 9.35 | 9.19 | 9.14 |
| Household income from work including employer CPF contributions per household member after accounting for government transfers and taxes | 7.68 | 7.82 | 7.71 | 8.28 | 8.24 | 8.3 | 7.68 | 8.68 | 7.94 | 8.00 | 8.1 | 7.54 | 7.87 |
International rankings
See also
- Malay Singaporean
- Chinese Singaporean
- Indian Singaporean
- Arab Singaporean
- Eurasians in Singapore
- Population Planning in Singapore
References
- ↑ http://www.worldometers.info/world-population/singapore-population/
- ↑ http://www.nptd.gov.sg/portals/0/news/population-in-brief-2014.pdf
- ↑ http://www.unhcr.org/refworld/topic,463af2212,469f2f192,49749cb046,0.html
- ↑ Vasil, R K (2000). Governing Singapore: democracy and national development. Allen & Unwin. p. 96. ISBN 978-1-86508-211-0.
- ↑ "Constitution of the Republic of Singapore". Attorney-General's Chambers of Singapore website. Part XIII Section 152(2). Retrieved 11 August 2011.
- ↑ http://www.cidcm.umd.edu/mar/assessment.asp?groupId=83001#summary
- ↑ http://www.asiaone.com/Business/SME%2BCentral/Talking%2Bpoint/Story/A1Story20090916-168233.html
- ↑ http://www.moe.gov.sg/
- 1 2 Population Trends 2015 Department of Statistics, Singapore.
- ↑ Lee Kuan Yew (22 June 2010). "Singapore releases 2010 population in Brief Report". Govmonitor. Retrieved 23 June 2010.
- ↑ "September 28, 2011 – Singapore's Fertility Rate Dropped to a Record Low".
- 1 2 3 4 5 6 7 8 9 10 11 12 13 Population Trends 2012 Department of Statistics, Singapore.
- 1 2 3 4 5 6 topic3 (Population). Retrieved from Singapore – Yearbook of Statistics Singapore, 2015, Department of Statistics, Singapore. Retrieved on 28 August 2015.
- ↑ Department of Statistics, Singapore
- ↑ "Demographic Yearbook". UN Data. United Nations. Retrieved 4 December 2015.
- 1 2 Wong, Theresa; Brenda Yeoh (2003). "Fertility and the Family: An Overview of Pro-natalist Population Policies in Singapore" (PDF). ASIAN METACENTRE RESEARCH PAPER SERIES (12).
- ↑ "Family Planning". National Archives. Government of Singapore. Retrieved 12 August 2011.
- 1 2 "Singapore: Population Control Policies". Library of Congress Country Studies (1989). Library of Congress. Retrieved 11 August 2011.
- ↑ A Sustainable Population for a Dynamic Singapore.
- ↑ Amended motion on white paper adopted; 6.9 million is not a target. The Straits Times. February 9, 2013.
- ↑ http://wp.sg/2013/02/the-workers-partys-population-policy-paper-a-dynamic-population-for-a-sustainable-singapore/ The Workers’ Party’s Population Policy Paper: “A Dynamic Population for a Sustainable Singapore” The Workers' Party.
- ↑ A Sustainable Singapore with a Dynamic Singaporean majority – MP Low Thia Khiang The Workers' Party.
- ↑ "Rare Singapore protest against population plan". February 17, 2013.
- 1 2 3 "East & Southeast Asia :: SINGAPORE". CIA The World Factbook.
- 1 2 3 Singapore Department of Statistics
- 1 2 "Population Trends 2015" (PDF). Statistics Singapore. Retrieved 9 April 2016.
- 1 2 http://www.straitstimes.com/The+Print+Edition/The%2BPrint%2BEdition_20100720.html?vgnid=1 Archived 22 July 2010 at the Wayback Machine.
- ↑ Census of Population 2010 Statistical Release 1: Demographic Characteristics, Education, Language and Religion (PDF). Department of Statistics, Ministry of Trade & Industry, Republic of Singapore. January 2011. ISBN 978-981-08-7808-5. Retrieved 28 August 2011.
- ↑ "Census 2000 – Chapter 5: Religion" (PDF). Retrieved 29 August 2011.
- ↑
- ↑ Singapore Department of Statistics.
- ↑ Census 2000
- 1 2 topic1 (Key Indicators). See Table 1.14 on Education and Literacy and Table 1.11 on Employment. Retrieved from Singapore – Yearbook of Statistics Singapore, 2015, Department of Statistics, Singapore. Retrieved on 28 August 2015.
- ↑ "Latest Data (1 February 2006) – Singapore Department of Statistics. URL accessed on 2 February 2006.
- ↑ "Singapore's employment hits all-time high of 2.3 m in 2005". Channel NewsAsia. 1 February 2006. By May Wong.
- ↑ Department of Statistics, Singapore.
- 1 2 Labour Market 2012 Ministry of Manpower, Singapore.
- 1 2 3 4 Department of Statistics, Singapore.
- ↑ Department of Statistics, Singapore.
- 1 2 http://www.singstat.gov.sg/publications/publications_and_papers/cop2010/census_2010_release2/cop2010sr2.pdf
- 1 2 3 4 5 6 Key Household Income Trends 2012 Department of Statistics, Singapore.
- ↑
- ↑ "Household Income from work 2000–2014", The Department of Statistics, Singapore. Retrieved on 4 October 2015
- ↑ United Nations Development Programme Report 2004 See page 50–53.
- ↑ Freedom in the World (report)
- ↑ Freedom of the Press (report)
- ↑ Press Freedom Index
- ↑ Democracy Index
- ↑ Corruption Perceptions Index
- ↑ Privacy International
- ↑ List of countries by GDP (nominal) per capita
- ↑ List of countries by GDP (PPP) per capita
- ↑ List of countries by foreign exchange reserves
- ↑ List of countries by income equality
- ↑ Ease of Doing Business Index
- ↑ Global Enabling Trade Report
- ↑ Global Competitiveness Report
- ↑ Human Development Index
- 1 2 Quality-of-life index
- ↑ List of countries and dependencies by population density
- ↑ List of countries by immigrant population
- ↑ List of countries by carbon dioxide emissions per capita
- ↑ List of countries by number of troops
- ↑ List of countries and territories by fertility rate
External links
| Library resources about Demographics of Singapore |
| Major groups | |
|---|---|
| Minor groups | |
| Foreign/Expatriate groups | |
| Related topics | |
Singapore articles | |||||||||||
|---|---|---|---|---|---|---|---|---|---|---|---|
| History |
| .svg.png) | |||||||||
| Geography | |||||||||||
| Politics | |||||||||||
| Economy | |||||||||||
| Society |
| ||||||||||
| |||||||||||