Demographics of Serbia and Montenegro

The demographics of Serbia and Montenegro comprise the populations of Serbia and Montenegro.
The total population of this region is 10,600,000 (Serbia - 9,981,929; Montenegro - 620,000). In 2000, in Serbia, 19.95% of the population was 14 and under (male 1,028,355; female 963,366); in Montenegro, it was 22.05% (male 77,582; female 72,395). 65.22% of Serbians (male 3,187,746; female 3,322,425) and 66.16% of Montenegrins (male 222,095; female 227,923) were between 15 and 64. 14.83% of Serbians (male 638,204; female 841,833) and 11.79% of Montenegrins (male 32,400; female 47,763) were 65 and over.
Estimeates in 2000 placed Serbia's population growth rate at 0.739% and Montenegro's at -12.22%. The respective birth rates were 12.20/1000 (Serbia) and 14.9/1000 (Montenegro); death rates were 11.08/1000 (Serbia) and 7.9/1000 (Montenegro). The net migration rate was 6.29/1000 in Serbia and -29.18/1,000 in Montenegro. Total fertility rates were 1.7 children/woman in Serbia and 2.0 children/woman in Montenegro.

In 2000, Serbia's infant mortality rate was 20.13 deaths/1,000 live births; Montenegro's was 10.97 deaths/1,000 live births. Total life expectancy at birth was 72.39 years in Serbia (69.31 for males, 75.72 for females) and 75.46 in Montenegro (71.45 for males, 79.82 for females).
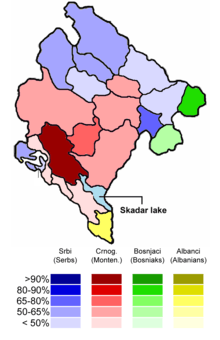
Ethnic groups in the region were represented as follows: Serb 62.6%, Albanian 16.5%, Montenegrin 5%, Yugoslav 3.4%, Hungarian 3.3%, other 9.2% (as of 1001). In terms of religion, 65% of inhabitants were Eastern Orthodox, 19% Muslim, 4% Roman Catholic, 1% Protestant 1%, and 11% other. The main languages spoken in Serbia and Montenegro are Serbian, Albanian, Croatian, Bosnian and Hungarian.
In 2002, 96.4% of the population aged 15 and over could read and write (98.9% of males, 94.1% of females).
| Historical population | ||
|---|---|---|
| Year | Pop. | ±% |
| 1880 | 2,089,183 | — |
| 1890 | 2,642,142 | +26.5% |
| 1900 | 3,204,240 | +21.3% |
| 1910 | 3,826,034 | +19.4% |
| 1921 | 5,337,714 | +39.5% |
| 1931 | 6,048,272 | +13.3% |
| 1948 | 6,727,766 | +11.2% |
| 1953 | 7,244,433 | +7.7% |
| 1961 | 8,114,121 | +12.0% |
| 1971 | 9,276,125 | +14.3% |
| 1981 | 10,014,936 | +8.0% |
| 1991 | 10,532,601 | +5.2% |
| 2002 | 10,402,186 | −1.2% |
| 2011 | 10,625,593 | +2.1% |
| 2015 | 10,729,223 | +1.0% |
See also
- Demographics of Serbia
- Demographics of Montenegro
- Demographic history of Serbia
- Demographic history of Montenegro
References
![]() This article incorporates public domain material from the CIA World Factbook website https://www.cia.gov/library/publications/the-world-factbook/index.html.
This article incorporates public domain material from the CIA World Factbook website https://www.cia.gov/library/publications/the-world-factbook/index.html.