Demographics of Rwanda
This article is about the demographic features of the population of Rwanda, including population density, ethnicity, education level, health of the populace, economic status, religious affiliations and other aspects of the population.
Rwanda's population density, even after the 1994 genocide, is among the highest in Sub-Saharan Africa at 230 inhabitants per square kilometre (600/sq mi). This country has few villages, and nearly every family lives in a self-contained compound on a hillside. The urban concentrations are grouped around administrative centers.
Over half of the adult population is literate, but no more than 5% have received secondary education.
Ethnic groups
The indigenous population consists of three ethnic groups. The Hutus, who comprise the majority of the population (85%), are farmers of Bantu origin. The Tutsis (14% before the Genocide, probably less than 10% now) are a pastoral people who arrived in the area in the 15th century. Until 1959, they formed the dominant caste under a feudal system based on cattleholding.
The Twa (pygmies) (1%) are thought to be the remnants of the earliest settlers of the region.
Population
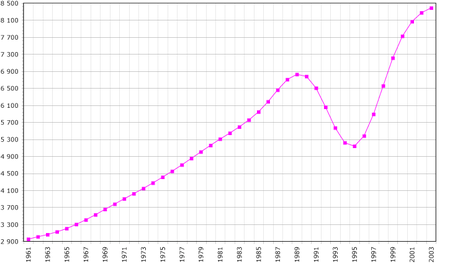
According to the 2010 revision of the World Population Prospects the total population was 10 624 000 in 2010, compared to only 2 072 000 in 1950. The proportion of children below the age of 15 in 2010 was 42.6%, 54.7% was between 15 and 65 years of age, while 2.7% was 65 years or older .[1]
| Total population (in thousands)) | Population aged 0–14 (%) | Population aged 15–64 (%) | Population aged 65+ (%) | |
|---|---|---|---|---|
| 1950 | 2,072 | 45.1 | 52.3 | 2.6 |
| 1955 | 2,386 | 46.3 | 50.8 | 2.9 |
| 1960 | 2,771 | 48.1 | 49.1 | 2.8 |
| 1965 | 3,221 | 47.8 | 49.5 | 2.7 |
| 1970 | 3,749 | 47.8 | 49.7 | 2.5 |
| 1975 | 4,390 | 47.7 | 49.9 | 2.4 |
| 1980 | 5,179 | 48.1 | 49.7 | 2.2 |
| 1985 | 6,081 | 48.9 | 49.1 | 2.0 |
| 1990 | 7,110 | 49.1 | 48.7 | 2.2 |
| 1995 | 5,570 | 48.4 | 49.3 | 2.3 |
| 2000 | 8,098 | 45.4 | 52.0 | 2.6 |
| 2005 | 9,202 | 42.4 | 55.0 | 2.7 |
| 2010 | 10,624 | 42.6 | 54.7 | 2.7 |
| 2012 - census | 10,516 | 41.16 | 55.65 | 3.19 |
Structure of the population [2]
Structure of the population (01.07.2012) (Estimates, Data refer to national projections) :
| Age Group | Male | Female | Total | % |
|---|---|---|---|---|
| Total | 5 342 112 | 5 691 029 | 11 033 141 | 100 |
| 0-4 | 973 447 | 957 104 | 1 930 551 | 17,50 |
| 5-9 | 770 292 | 763 709 | 1 534 001 | 13,90 |
| 10-14 | 608 836 | 621 378 | 1 230 213 | 11,15 |
| 15-19 | 552 629 | 568 101 | 1 120 730 | 10,16 |
| 20-24 | 525 485 | 550 486 | 1 075 971 | 9,75 |
| 25-29 | 508 839 | 540 872 | 1 049 712 | 9,51 |
| 30-34 | 366 700 | 416 072 | 782 772 | 7,09 |
| 35-39 | 241 362 | 291 340 | 532 702 | 4,83 |
| 40-44 | 197 005 | 228 728 | 425 733 | 3,86 |
| 45-49 | 165 096 | 193 402 | 358 499 | 3,25 |
| 50-54 | 153 080 | 180 759 | 333 839 | 3,03 |
| 55-59 | 107 200 | 132 234 | 239 433 | 2,17 |
| 60-64 | 71 924 | 92 299 | 164 223 | 1,49 |
| 65-69 | 38 125 | 58 585 | 96 710 | 0,88 |
| 70-74 | 29 285 | 46 236 | 75 521 | 0,68 |
| 75-79 | 17 736 | 27 557 | 45 293 | 0,41 |
| 80+ | 15 071 | 22 178 | 37 239 | 0,34 |
| Age group | Male | Female | Total | Percent |
|---|---|---|---|---|
| 0-14 | 2 352 575 | 2 342 191 | 4 694 766 | 42,55 |
| 15-64 | 2 889 320 | 3 194 282 | 6 083 602 | 55,14 |
| 65+ | 100 217 | 154 556 | 254 773 | 2,31 |
Structure of the population (DHS 2013) (Males 9 546, Females 10 726 = 20 272) :
| Age Group | Male (%) | Female (%) | Total (%) |
|---|---|---|---|
| 0-4 | 16,2 | 14,5 | 15,3 |
| 5-9 | 15,2 | 13,5 | 14,3 |
| 10-14 | 14,0 | 12,6 | 13,3 |
| 15-19 | 10,3 | 9,9 | 10,1 |
| 20-24 | 8,2 | 9,0 | 8,6 |
| 25-29 | 8,3 | 8,3 | 8,3 |
| 30-34 | 7,2 | 7,3 | 7,3 |
| 35-39 | 4,4 | 4,9 | 4,7 |
| 40-44 | 3,5 | 4,3 | 4,0 |
| 45-49 | 3,1 | 3,6 | 3,3 |
| 50-54 | 3,1 | 3,4 | 3,3 |
| 55-59 | 2,1 | 2,3 | 2,2 |
| 60-64 | 1,7 | 2,1 | 1,9 |
| 65-69 | 1,0 | 1,5 | 1,3 |
| 70-74 | 0.6 | 1,1 | 0,9 |
| 75-79 | 0,5 | 0,6 | 0,6 |
| 80+ | 0,6 | 0,9 | 0,8 |
| Age group | Male (%) | Female (%) | Total (%) |
|---|---|---|---|
| 0-14 | 45,4 | 40,6 | 42,9 |
| 15-64 | 51,9 | 55,3 | 53,5 |
| 65+ | 2,7 | 4,1 | 3,6 |
Vital statistics
Registration of vital events is in Rwanda not complete. The Population Department of the United Nations prepared the following estimates. [1]
| Period | Live births per year | Deaths per year | Natural change per year | CBR* | CDR* | NC* | TFR* | IMR* |
|---|---|---|---|---|---|---|---|---|
| 1950-1955 | 118 000 | 55 000 | 63 000 | 52.9 | 24.7 | 28.1 | 8.00 | 160 |
| 1955-1960 | 137 000 | 60 000 | 77 000 | 53.3 | 23.4 | 29.9 | 8.15 | 152 |
| 1960-1965 | 155 000 | 65 000 | 90 000 | 51.9 | 21.9 | 30.0 | 8.15 | 143 |
| 1965-1970 | 178 000 | 72 000 | 106 000 | 51.0 | 20.7 | 30.3 | 8.10 | 137 |
| 1970-1975 | 211 000 | 82 000 | 128 000 | 51.8 | 20.3 | 31.5 | 8.20 | 134 |
| 1975-1980 | 250 000 | 92 000 | 158 000 | 52.3 | 19.3 | 33.0 | 8.25 | 132 |
| 1980-1985 | 294 000 | 92 000 | 202 000 | 52.2 | 16.3 | 35.9 | 8.25 | 124 |
| 1985-1990 | 326 000 | 123 000 | 203 000 | 49.4 | 18.7 | 30.7 | 7.80 | 120 |
| 1990-1995 | 258 000 | 263 000 | - 5 000 | 40.7 | 41.5 | -0.8 | 6.30 | 128 |
| 1995-2000 | 278 000 | 136 000 | 142 000 | 40.7 | 19.9 | 20.8 | 6.00 | 118 |
| 2000-2005 | 344 000 | 125 000 | 219 000 | 39.8 | 14.4 | 25.4 | 5.60 | 108 |
| 2005-2010 | 404 000 | 122 000 | 281 000 | 40.7 | 12.3 | 28.4 | 5.43 | 100 |
| * CBR = crude birth rate (per 1000); CDR = crude death rate (per 1000); NC = natural change (per 1000); IMR = infant mortality rate per 1000 births; TFR = total fertility rate (number of children per woman) | ||||||||
Births and deaths [3]
| Year | Population | Live births | Deaths | Natural increase | Crude birth rate | Crude death rate | Rate of natural increase | TFR |
|---|---|---|---|---|---|---|---|---|
| 2012 | 404 067 | 139 499 | 264 568 | |||||
Fertility and Births
Total Fertility Rate (TFR) (Wanted Fertility Rate) and Crude Birth Rate (CBR):[4]
| Year | CBR (Total) | TFR (Total) | CBR (Urban) | TFR (Urban) | CBR (Rural) | TFR (Rural) |
|---|---|---|---|---|---|---|
| 1992 | 40,0 | 6,23 (4,2) | 38,0 | 4,51 (3,3) | 41,0 | 6,33 (4,3) |
| 2000 | 5,8 (4,7) | 5,2 (4,1) | 5,9 (4,8) | |||
| 2005 | 43,2 | 6,1 (4,6) | 39,8 | 4,9 (3,6) | 43,8 | 6,3 (4,8) |
| 2007-2008 | 39,2 | 5,5 (3,7) | 37,4 | 4,7 (3,3) | 39,6 | 5,7 (3,8) |
| 2010 | 34,4 | 4,6 (3,1) | 30,6 | 3,4 (2,6) | 35,0 | 4,8 (3,2) |
| 2014-2015 | 32,6 | 4,2 (3,1) | 34,3 | 3,6 (2,7) | 32,3 | 4,3 (3,2) |
CIA World Factbook demographic statistics
The following demographic statistics are from the CIA World Factbook, unless otherwise indicated.
Population
12,661,733
note:
estimates for this country explicitly take into account the effects of excess mortality due to AIDS. This disease can result in lower life expectancy, population, and growth rates; higher infant mortality and death rates; and changes in the distribution of population by age and sex than would otherwise be expected (July 2011 est.)
Population growth rate
2.792% (2011 est.)
Sex ratio
at birth: 1.03 male(s)/female
under 15 years: 1.01 male(s)/female
15-64 years: 0.99 male(s)/female
65 years and over: 0.67 male(s)/female
total population: 0.99 male(s)/female (2006 est.)
Life expectancy at birth
total population: 47.3 years
male: 46.26 years
female: 48.38 years (2006 est.)
Nationality
noun: Rwandan(s)/Rwandese
adjective: Rwandan/Rwandese
Ethnic groups[5]
Religions[5]
- Roman Catholic 49.5%
- Protestant 39.4% (includes Adventist 12.2% and other Protestant 27.2%)
- Other Christian 4.5%
- Islam 1.8%
- Animist 0.1%
- Other 0.6%
- None 3.6%
- Unspecified 0.5%
Languages[5]
- Kinyarwanda only (official universal Bantu vernacular) 93.2%
- Kinyarwanda and other language(s) 6.2%
- French (official) and other language(s) 0.1%
- English (official) and other language(s) 0.1%
- Swahili (or Kiswahili used in commercial centers) 0.02%
- Other 0.03%
- Unspecified 0.3% (2002 est.)
Literacy
definition: age 15 and over can read and write
total population: 70.4%
male: 76.3%
female: 64.7% (2003 est.)
See also
References
| Wikimedia Commons has media related to Demographics of Rwanda. |
- 1 2 Population Division of the Department of Economic and Social Affairs of the United Nations Secretariat, World Population Prospects: The 2010 Revision
- ↑ "United Nations Statistics Division - Demographic and Social Statistics". Retrieved 6 September 2016.
- ↑ http://unstats.un.org/unsd/demographic/products/vitstats/serATab3.pdf
- ↑ "MEASURE DHS: Demographic and Health Surveys". Retrieved 6 September 2016.
- 1 2 3 "Africa :: RWANDA". CIA The World Factbook.