Demographics of Romania
| Demographics of Romania | |
|---|---|
 The evolution of the population between 1961 and 2010 | |
| Population | 20,121,641 (2011 census)[1] |
| Growth rate | -0.29% (2014) |
| Birth rate | 9.27 births/1,000 population (2014) |
| Death rate | 11.88 deaths/1,000 population (2014) |
| Life expectancy | 75 years (2015)[2] |
| • male | 71.4 years |
| • female | 78.8 years |
| Fertility rate | 1.32 children born/woman (2014) |
| Infant mortality rate | 9.01 deaths/1,000 live births (2012)[3] |
| Net migration rate | -0.24 migrants/1,000 population (2015) |
| Age structure | |
| 0–14 years | 3,189,646 (15.8%) |
| 15–64 years | 13,684,251 (68.1%) |
| 65 and over | 3,247,744 (16.1%) |
| Sex ratio | |
| Total | 0.95 males/female (2014) |
| At birth | 1.06 males/female |
| Under 15 | 1.05 males/female |
| 15–64 years | 0.99 males/female |
| 65 and over | 0.69 males/female |
| Nationality | |
| Nationality | noun: Romanian(s), adjective: Romanian |
| Major ethnic | Romanian |
| Minor ethnic | Hungarian, Roma, Ukrainian, German, Russian, Turkish, Serbian, Slovak, etc. |
| Language | |
| Official | Romanian |
| Spoken | Romanian and other minority languages |
This article is about the demographic features of the population of Romania, including population density, ethnicity, education level, health of the populace, economic status, religious affiliations and other aspects of the population.
About 89.4% of the people of Romania are ethnic Romanians, whose language, Romanian, is an Eastern Romance language, descended primarily from Latin with some Bulgarian, Serbian, German, Greek, Hungarian and Turkish borrowings. Romanians are by far the most numerous group of speakers of an Eastern Romance language today. It has been said that they constitute "an island of Latinity"[4] in Eastern Europe, surrounded on all sides either by Slavic peoples or by the Hungarians.
The Hungarian minority in Romania constitutes the country's largest minority, 6.1 per cent of the population.[5]
Population
Romania's population declined steadily in recent years, from 21.7 million in 2002 to 19.9 million in 2014.[6] More specifically, in the last decade, the population of Romania decreased by 7.5%, the most important moment for the country's demography being 2008, when the number of inhabitants dropped by 600,000 people.[7] Among the causes of population decline are high mortality, low fertility rate after 1989, and emigration.[6]
For the entire period 1990–2006 estimated population loss tops 1.5 million. But it is likely to be higher, given the explosion of migration for work after 2001 and the tendency of some migrants to settle permanently in the countries where they live.[8]
Population evolution
Sources give varied estimates for Romania's historical population. The National Institute for Research and Development in Informatics (NIRDI) gives the following numbers:

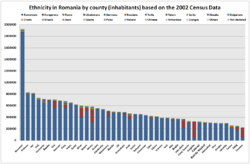
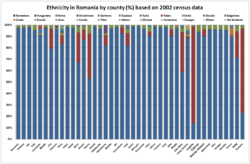
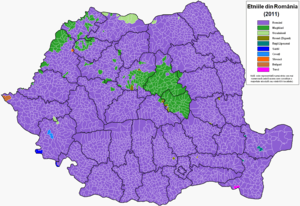
Ethnic groups


Before World War II, minorities represented more than 28% of the total population. During the war that percentage was halved, largely by the loss of the border areas of Bessarabia and northern Bukovina (to the former Soviet Union, now Moldova and Ukraine) and southern Dobrudja (to Bulgaria). Two-thirds of the ethnic German population either left or were deported after World War II, a period that was followed by decades of relatively regular (by communist standards) migration. All these left behind a population of 60,000 ethnic Germans in Romania today. Of a total official population of over three quarter million Jews before World War II, more than half were killed during the Holocaust.[9] Mass emigration, mostly to Israel and United States, has reduced the surviving Jewish community to less than 6,000 in 2002(it is estimated that the real numbers could be 3-4 times higher).[10]
Hungarians (Magyars; see Hungarians in Romania), especially in Harghita, Covasna, and Mureș counties, and the Roma are the principal minorities, with a declining German population (Banat Swabians in Timiș; Transylvanian Saxons in Sibiu, Brașov and elsewhere), and smaller numbers of Czechs, Slovaks, Serbs, Chinese, Croats, and Banat Bulgarians (in Banat), Ukrainians (especially in Maramureș and Bukovina), Greeks of Romania (especially in Brăila and Constanța), Turks and Tatars (mainly in Constanța), Armenians, Russians (Lipovans, Old Believers in Tulcea), Jews and others. Since the Romanian Revolution of 1989, Bucharest has again become an increasingly cosmopolitan city, including identifiable Chinese and Irish presences. Minority populations are greatest in Transylvania and the Banat, areas in the north and west of the country, which were part of the Kingdom of Hungary (after 1867 the Austria-Hungary) until the end of World War I. Even before the union with Romania, ethnic Romanians comprised the overall majority in Transylvania. However, ethnic Hungarians and Germans were the dominant urban population until relatively recently, while Hungarians still constitute the majority in Harghita and Covasna counties.
| Ethnicity | number | % |
|---|---|---|
| Romanians | 12,981,324 | 71.9 |
| Hungarians | 1,425,507 | 7.9 |
| Germans | 745,421 | 4.1 |
| Jews | 728,115 | 4.0 |
| Ruthenians and Ukrainians | 582,115 | 3.2 |
| Russians | 409,150 | 2.3 |
| Bulgarians | 366,384 | 2.0 |
| Romani | 262,501 | 1.5 |
| Turks | 154,772 | 0.9 |
| Gagauzians | 105,750 | 0.6 |
| Czechs and Slovaks | 51,842 | 0.3 |
| Serbs, Croats and Slovenes | 51,062 | 0.3 |
| Poles | 48,310 | 0.3 |
| Greeks | 26,495 | 0.1 |
| Tatars | 22,141 | 0.1 |
| Armenians | 15,544 | 0.0 |
| Hutsuls | 12,456 | 0.0 |
| Albanians | 4,670 | 0.0 |
| Others | 56,355 | 0.3 |
| Undeclared | 7,114 | 0.0 |
| Total | 18,057,028 | 100.0 |
| Ethnic group |
census 19481 | census 19562 | census 19663 | census 19774 | census 19925 | census 20026 | census 20117 | |||||||
|---|---|---|---|---|---|---|---|---|---|---|---|---|---|---|
| Number | % | Number | % | Number | % | Number | % | Number | % | Number | % | Number | % | |
| Romanians | 13,597,613 | 85.7 | 14,996,114 | 85.7 | 16,746,510 | 87.7 | 18,999,565 | 88.1 | 20,408,542 | 89.5 | 19,399,597 | 89.5 | 16,792,868 | 83.4 |
| Hungarians | 1,499,851 | 9.4 | 1,587,675 | 9.1 | 1,619,592 | 8.5 | 1,713,928 | 7.9 | 1,624,959 | 7.1 | 1,431,807 | 6.6 | 1,227,623 | 6.1 |
| Romani | 53,425 | 0.3 | 104,216 | 0.6 | 64,197 | 0.3 | 227,398 | 1.05 | 401,087 | 1.8 | 535,140 | 2.5 | 621,573 | 3.0 |
| Ukrainians | 37,582 | 0.2 | 60,479 | 0.4 | 54,705 | 0.3 | 55,510 | 0.3 | 65,764 | 0.3 | 61,098 | 0.3 | 50,920 | 0.2 |
| Germans | 343,913 | 2.2 | 384,708 | 2.2 | 382,595 | 2.0 | 359,109 | 1.6 | 119,462 | 0.5 | 59,764 | 0.3 | 36,042 | 0.2 |
| Turks | 28,782 | 0.2 | 14,329 | 0.2 | 18,040 | 0.1 | 23,422 | 0.1 | 29,832 | 0.1 | 32,098 | 0.2 | 27,698 | 0.2 |
| Tatars | 20,469 | 0.2 | 22,151 | 0.1 | 23,369 | 0.1 | 24,596 | 0.1 | 23,935 | 0.1 | 20,282 | 0.1 | ||
| Russians | 39,332 | 0.2 | 38,731 | 0.2 | 39,483 | 0.2 | 21,206 | 0.2 | 7,983 | 0.1 | 35,791 | 0.2 | 23,864 | 0.1 |
| Lipovans | 11,090 | 0.1 | 30,623 | 0.2 | ||||||||||
| Serbs | 45,447 | 0.3 | 46,517 | 0.3 | 44,236 | 0.3 | 34,429 | 0.2 | 29,408 | 0.1 | 22,561 | 0.1 | 18,076 | 0.1 |
| Croats | 7,500 | 0.0 | 4,085 | 0.0 | 6,807 | 0.0 | 5,408 | 0.0 | ||||||
| Slovenes | 175 | 0.0 | ||||||||||||
| Slovaks | 35,143 | 0.2 | 23,331 | 0.2 | 22,151 | 0.1 | 21,286 | 0.1 | 19,594 | 0.1 | 17,226 | 0.2 | 13,654 | 0.1 |
| Czechs | 11,821 | 0.0 | 9,978 | 0.0 | 7,683 | 0.0 | 5,797 | 0.0 | 3,941 | 0.0 | 2,477 | 0.0 | ||
| Bulgarians | 13,408 | 0.1 | 12,040 | 0.1 | 11,193 | 0.1 | 10,372 | 0.0 | 9,851 | 0.1 | 8,025 | 0.0 | 7,336 | 0.0 |
| Greeks | 8,696 | 0.1 | 11,166 | 0.0 | 9,088 | 0.0 | 6,262 | 0.0 | 3,940 | 0.0 | 6,472 | 0.0 | 3,668 | 0.0 |
| Jews | 138,795 | 0.9 | 146,264 | 0.8 | 42,888 | 0.2 | 24,667 | 0.1 | 8,955 | 0.0 | 5,785 | 0.0 | 3,271 | 0.0 |
| Poles | 6,753 | 0.0 | 7,627 | 0.0 | 5,860 | 0.0 | 4,641 | 0.0 | 4,232 | 0.0 | 3,559 | 0.0 | 2,543 | 0.0 |
| Armenians | 6,987 | 0.0 | 6,441 | 0.0 | 3,436 | 0.0 | 2,342 | 0.0 | 1,957 | 0.0 | 1,780 | 0.0 | 1,361 | 0.0 |
| Macedonians | 1,176 | 0.0 | 6,867 | 0.0 | 731 | 0.0 | 1,264 | 0.0 | ||||||
| Csangos | 1,266 | 0.0 | 1,536 | 0.0 | ||||||||||
| Aromanians | 982 | 0.0 | 21,736 | 0.1 | ||||||||||
| Others/undeclared | 15,897 | 0.1 | 17,522 | 0.1 | 6,990 | 0.0 | 5,731 | 0.0 | 9,368 | 0.0 | 28,303 | 0.1 | 23,741 | 0.1 |
| Undeclared | 1,236,810 | 6.14 | ||||||||||||
| Total | 15,872,624 | 17,489,450 | 19,103,163 | 21,559,910 | 22,810,035 | 21,680,974 | 20,121,641 | |||||||
| 1 The results of the 1948 census are according to language. 2 Source: . 3 Source: . 4 Source: . 5 Source: . 6 Source: | ||||||||||||||
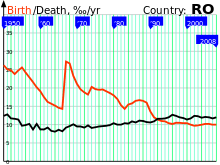
Vital statistics

|
1.9 - 2.1
1.7 - 1.9
1.5 - 1.7
1.4 - 1.5
1.3 - 1.4
< 1.3 |
Before WWI
| Average population (x 1000) | Live births | Deaths | Natural change | Crude birth rate (per 1000) | Crude death rate (per 1000) | Natural change (per 1000) | |
|---|---|---|---|---|---|---|---|
| 1900 | 6 050 | 235 000 | 146 000 | 89 000 | 38.8 | 24.2 | 14.6 |
| 1901 | 6 120 | 241 000 | 160 000 | 81 000 | 39.3 | 26.2 | 13.1 |
| 1902 | 6 210 | 242 000 | 172 000 | 70 000 | 39.0 | 27.7 | 11.3 |
| 1903 | 6 290 | 252 000 | 156 000 | 96 000 | 40.1 | 24.8 | 15.3 |
| 1904 | 6 390 | 256 000 | 156 000 | 100 000 | 40.1 | 24.4 | 15.7 |
| 1905 | 6 480 | 248 000 | 160 000 | 88 000 | 38.3 | 24.7 | 13.6 |
| 1906 | 6 570 | 262 000 | 157 000 | 105 000 | 39.9 | 23.9 | 16.0 |
| 1907 | 6 680 | 274 000 | 176 000 | 98 000 | 41.1 | 26.3 | 14.8 |
| 1908 | 6 770 | 273 000 | 185 000 | 88 000 | 40.3 | 27.4 | 12.9 |
| 1909 | 6 860 | 282 000 | 188 000 | 94 000 | 41.1 | 27.4 | 13.7 |
| 1910 | 6 970 | 274 000 | 173 000 | 101 000 | 39.3 | 24.8 | 14.5 |
| 1911 | 7 090 | 300 000 | 179 000 | 121 000 | 42.3 | 25.3 | 17.0 |
| 1912 | 7 240 | 314 000 | 166 000 | 148 000 | 43.4 | 22.9 | 20.5 |
| 1913 | 7 360 | 310 000 | 192 000 | 118 000 | 42.1 | 26.1 | 16.0 |
| 1914 | 7 770 | 327 000 | 183 000 | 144 000 | 42.1 | 23.5 | 18.6 |
| 1915 | 7 910 | 320 000 | 194 000 | 126 000 | 40.5 | 24.5 | 16.0 |
Between WWI and WWII
| Average population (x 1000) | Live births | Deaths | Natural change | Crude birth rate (per 1000) | Crude death rate (per 1000) | Natural change (per 1000) | |
|---|---|---|---|---|---|---|---|
| 1919 | 15 920 | 366 000 | 328 000 | 38 000 | 23.0 | 20.6 | 2.4 |
| 1920 | 16 010 | 539 000 | 415 000 | 124 000 | 33.7 | 25.9 | 7.8 |
| 1921 | 16 240 | 620 000 | 372 000 | 248 000 | 38.2 | 22.9 | 15.3 |
| 1922 | 16 500 | 614 000 | 376 000 | 238 000 | 37.2 | 22.8 | 14.4 |
| 1923 | 16 770 | 609 000 | 372 000 | 237 000 | 36.4 | 22.1 | 14.3 |
| 1924 | 16 990 | 623 000 | 383 000 | 240 000 | 36.7 | 22.5 | 14.2 |
| 1925 | 17 190 | 606 000 | 362 000 | 244 000 | 35.2 | 21.1 | 14.1 |
| 1926 | 17 460 | 608 000 | 373 000 | 235 000 | 34.8 | 21.4 | 13.4 |
| 1927 | 17 690 | 603 000 | 393 000 | 210 000 | 34.1 | 22.2 | 11.9 |
| 1928 | 17 970 | 624 000 | 352 000 | 272 000 | 34.7 | 19.6 | 15.1 |
| 1929 | 17 640 | 601 000 | 378 000 | 223 000 | 34.1 | 21.4 | 12.7 |
| 1930 | 17 870 | 625 000 | 347 000 | 278 000 | 35.0 | 19.4 | 15.6 |
| 1931 | 18 190 | 605 000 | 379 000 | 226 000 | 33.3 | 20.8 | 12.5 |
| 1932 | 18 427 | 662 000 | 399 000 | 263 000 | 35.9 | 21.7 | 14.2 |
| 1933 | 18 653 | 598 000 | 348 000 | 250 000 | 32.1 | 18.7 | 13.4 |
| 1934 | 18 914 | 612 416 | 390 668 | 221 748 | 32.4 | 20.7 | 11.7 |
| 1935 | 19 088 | 585 503 | 402 720 | 182 783 | 30.7 | 21.1 | 9.6 |
| 1936 | 19 319 | 608 906 | 382 179 | 226 727 | 31.5 | 19.8 | 11.7 |
| 1937 | 19 535 | 601 310 | 377 954 | 223 356 | 30.8 | 19.3 | 11.4 |
| 1938 | 19 750 | 585 423 | 379 445 | 205 978 | 29.6 | 19.2 | 10.4 |
| 1939 | 19 934 | 563 817 | 370 348 | 193 469 | 28.3 | 18.6 | 9.7 |
After WWII
| Average population (x 1000) | Live births | Deaths | Natural change | Crude birth rate (per 1000) | Crude death rate (per 1000) | Natural change (per 1000) | Fertility rates | |
|---|---|---|---|---|---|---|---|---|
| 1946 | 15 760 | 391 273 | 296 439 | 94 834 | 24.8 | 18.8 | 6.0 | |
| 1947 | 15 860 | 370 562 | 349 331 | 21 231 | 23.4 | 22.0 | 1.3 | |
| 1948 | 15 893 | 379 868 | 248 238 | 131 630 | 23.9 | 15.6 | 8.3 | |
| 1949 | 16 084 | 444 065 | 219 881 | 224 184 | 27.6 | 13.7 | 13.9 | |
| 1950 | 16 311 | 426 820 | 202 010 | 224 810 | 26.2 | 12.4 | 13.8 | 3,14 |
| 1951 | 16 464 | 412 534 | 210 021 | 202 513 | 25.1 | 12.8 | 12.3 | 3,01 |
| 1952 | 16 630 | 413 217 | 195 287 | 217 930 | 24.8 | 11.7 | 13.1 | 2,97 |
| 1953 | 16 847 | 401 717 | 194 752 | 206 965 | 23.8 | 11.6 | 12.3 | 2,76 |
| 1954 | 17 040 | 422 346 | 195 091 | 227 255 | 24.8 | 11.4 | 13.3 | 2,98 |
| 1955 | 17 325 | 442 864 | 167 535 | 275 329 | 25.6 | 9.7 | 15.9 | 3,07 |
| 1956 | 17 583 | 425 704 | 174 847 | 250 857 | 24.2 | 9.9 | 14.3 | 2,89 |
| 1957 | 17 829 | 407 819 | 181 923 | 225 896 | 22.9 | 10.2 | 12.7 | 2,73 |
| 1958 | 18 056 | 390 500 | 156 493 | 234 007 | 21.6 | 8.7 | 13.0 | 2,58 |
| 1959 | 18 226 | 368 007 | 186 767 | 181 240 | 20.2 | 10.2 | 9.9 | 2,43 |
| 1960 | 18 403 | 352 241 | 160 720 | 191 521 | 19.1 | 8.7 | 10.4 | 2,34 |
| 1961 | 18 567 | 324 859 | 161 936 | 162 923 | 17.5 | 8.7 | 8.8 | 2,18 |
| 1962 | 18 681 | 301 985 | 172 429 | 129 556 | 16.2 | 9.2 | 6.9 | 2,04 |
| 1963 | 18 813 | 294 886 | 155 767 | 139 119 | 15.7 | 8.3 | 7.4 | 2,01 |
| 1964 | 18 927 | 287 383 | 152 476 | 134 907 | 15.2 | 8.1 | 7.1 | 1,96 |
| 1965 | 19 027 | 278 362 | 163 393 | 114 969 | 14.6 | 8.6 | 6.0 | 1,91 |
| 1966 | 19 141 | 273 678 | 157 445 | 116 233 | 14.3 | 8.2 | 6.1 | 1,90 |
| 1967 | 19 285 | 527 764 | 179 129 | 348 635 | 27.4 | 9.3 | 18.1 | 3,68 |
| 1968 | 19 721 | 526 091 | 188 509 | 337 582 | 26.7 | 9.6 | 17.1 | 3,64 |
| 1969 | 20 010 | 465 764 | 201 225 | 264 539 | 23.3 | 10.1 | 13.2 | 3,20 |
| 1970 | 20 253 | 427 034 | 193 255 | 233 779 | 21.1 | 9.5 | 11.5 | 2,89 |
| 1971 | 20 470 | 400 146 | 194 306 | 205 840 | 19.5 | 9.5 | 10.1 | 2,67 |
| 1972 | 20 663 | 389 153 | 189 793 | 199 360 | 18.8 | 9.2 | 9.6 | 2,55 |
| 1973 | 20 828 | 378 696 | 203 559 | 175 137 | 18.2 | 9.8 | 8.4 | 2,44 |
| 1974 | 21 029 | 427 732 | 191 286 | 236 446 | 20.3 | 9.1 | 11.2 | 2,71 |
| 1975 | 21 245 | 418 185 | 197 538 | 220 647 | 19.7 | 9.3 | 10.4 | 2,60 |
| 1976 | 21 446 | 417 353 | 204 873 | 212 480 | 19.5 | 9.6 | 9.9 | 2,55 |
| 1977 | 21 658 | 423 958 | 208 685 | 215 273 | 19.6 | 9.6 | 9.9 | 2,57 |
| 1978 | 21 855 | 416 598 | 211 846 | 204 752 | 19.1 | 9.7 | 9.4 | 2,52 |
| 1979 | 22 048 | 410 603 | 217 509 | 193 094 | 18.6 | 9.9 | 8.8 | 2,48 |
| 1980 | 22 201 | 398 904 | 231 876 | 167 028 | 18.0 | 10.4 | 7.5 | 2,43 |
| 1981 | 22 353 | 381 101 | 224 635 | 156 466 | 17.0 | 10.0 | 7.0 | 2,36 |
| 1982 | 22 478 | 344 369 | 224 120 | 120 249 | 15.3 | 10.0 | 5.3 | 2,17 |
| 1983 | 22 553 | 321 498 | 233 892 | 87 606 | 14.3 | 10.4 | 3.9 | 2,07 |
| 1984 | 22 625 | 350 741 | 233 699 | 117 042 | 15.5 | 10.3 | 5.2 | 2,27 |
| 1985 | 22 725 | 358 797 | 246 670 | 112 127 | 15.8 | 10.9 | 4.9 | 2,31 |
| 1986 | 22 823 | 376 896 | 242 330 | 134 566 | 16.5 | 10.6 | 5.9 | 2,40 |
| 1987 | 22 940 | 383 199 | 254 286 | 128 913 | 16.7 | 11.1 | 5.6 | 2,39 |
| 1988 | 23 054 | 380 043 | 253 370 | 126 673 | 16.5 | 11.0 | 5.5 | 2,31 |
| 1989 | 23 152 | 369 544 | 247 306 | 122 238 | 16.0 | 10.7 | 5.3 | 2,20 |
| 1990 | 23 207 | 314 746 | 247 086 | 67 660 | 13.6 | 10.6 | 2.9 | 1,83 |
| 1991 | 23 185 | 275 275 | 251 760 | 23 515 | 11.9 | 10.9 | 1.0 | 1,59 |
| 1992 | 22 789 | 260 393 | 263 855 | -3 462 | 11.4 | 11.6 | -0.2 | 1,51 |
| 1993 | 22 755 | 249 994 | 263 323 | -13 329 | 11.0 | 11.6 | -0.6 | 1,43 |
| 1994 | 22 731 | 246 736 | 266 101 | -19 365 | 10.9 | 11.7 | -0.9 | 1,40 |
| 1995 | 22 681 | 236 640 | 271 672 | -35 032 | 10.4 | 12.0 | -1.5 | 1,33 |
| 1996 | 22 608 | 231 348 | 286 158 | -54 810 | 10.2 | 12.7 | -2.4 | 1,30 |
| 1997 | 22 546 | 236 891 | 279 316 | -42 425 | 10.5 | 12.4 | -1.9 | 1,32 |
| 1998 | 22 503 | 237 297 | 269 166 | -31 869 | 10.5 | 12.0 | -1.4 | 1,32 |
| 1999 | 22 458 | 234 600 | 265 194 | -30 594 | 10.4 | 11.8 | -1.4 | 1,30 |
| 2000 | 22 435 | 234 521 | 255 820 | -21 299 | 10.5 | 11.4 | -0.9 | 1,31 |
| 2001 | 22 132 | 220 368 | 259 603 | -39 235 | 10.0 | 11.7 | -1.8 | 1,27 |
| 2002 | 21 803 | 210 529 | 269 666 | -59 137 | 9.7 | 12.4 | -2.7 | 1,25 |
| 2003 | 21 734 | 212 459 | 266 575 | -54 116 | 9.8 | 12.3 | -2.5 | 1,30 |
| 2004 | 21 673 | 216 261 | 258 890 | -42 629 | 10.0 | 11.9 | -2.0 | 1,33 |
| 2005 | 21 635 | 221 020 | 262 101 | -41 081 | 10.2 | 12.1 | -1.9 | 1,40 |
| 2006 | 21 588 | 219 483 | 258 094 | -38 611 | 10.2 | 12.0 | -1.8 | 1,42 |
| 2007 | 21 547 | 213 625 | 252 097 | -38 472 | 10.0 | 11.7 | -1.7 | 1,45 |
| 2008 | 21 513 | 222 749 | 253 177 | -30 428 | 10.3 | 11.8 | -1.5 | 1,60 |
| 2009 | 21 480 | 222 925 | 257 083 | -34 158 | 10.4 | 12.0 | -1.6 | 1,66 |
| 2010 | 21 432 | 211 922 | 259 747 | -47 825 | 9.9 | 12.1 | -2.2 | 1,59 |
| 2011 | 20 121 | 196 373 | 251 370 | -54 997 | 9.7 | 12.5 | -2.8 | 1,47 |
| 2012 | 20 066 | 201 202 | 255 458 | -54 256 | 10.0 | 12.7 | -2.7 | 1,52 |
| 2013 | 19 952 | 198 216 | 249 264 | -51 048 | 9.9 | 12.5 | -2.6 | 1,41 |
| 2014 | 19 897 | [13] | [13] | -59 179 [13] | [13] | [13] | -2.6 | 1,52 |
| 2015 | 19 838 | [13] | [13] | -73 625 [13] | [13] | 10.2 [13] | -3.3 | |
Note: The 2011 Romanian Census gave a figure of 20,121,641.
Current vital statistics
-Number of births from January–March 2011 = ![]() 47,043
47,043
-Number of births from January–March 2012 = ![]() 46,164
46,164
-Number of births from January–March 2013 = ![]() 44,965
44,965
-Number of death from January–March 2011 = ![]() 68,728
68,728
-Number of death from January–March 2012 = ![]() 71,978
71,978
-Number of death from January–March 2013 = ![]() 64,879
64,879
During the period of January–March 2013 the natural increase was :
Natural increase from January–March 2011 = ![]() - 21,685
- 21,685
Natural increase from January–March 2012 = ![]() - 25,814
- 25,814
Natural increase from January–March 2013 = ![]() - 19,914
- 19,914
Largest urban agglomerations
| | |||||||||
|---|---|---|---|---|---|---|---|---|---|
| Rank | Name | County | Pop. | Rank | Name | County | Pop. | ||
 Bucharest  Cluj-Napoca |
1 | Bucharest | Bucharest | 1,883,425 | 11 | Brăila | Brăila | 180,302 |  Timișoara  Iași |
| 2 | Cluj-Napoca | Cluj | 324,576 | 12 | Arad | Arad | 159,704 | ||
| 3 | Timișoara | Timiș | 319,279 | 13 | Pitești | Argeș | 155,383 | ||
| 4 | Iași | Iași | 290,422 | 14 | Sibiu | Sibiu | 147,245 | ||
| 5 | Constanța | Constanța | 283,872 | 15 | Bacău | Bacău | 144,307 | ||
| 6 | Craiova | Dolj | 269,506 | 16 | Târgu Mureș | Mureș | 134,290 | ||
| 7 | Brașov | Brașov | 253,200 | 17 | Baia Mare | Maramureș | 123,738 | ||
| 8 | Galați | Galați | 249,342 | 18 | Buzău | Buzău | 115,494 | ||
| 9 | Ploiești | Prahova | 209,945 | 19 | Botoșani | Botoșani | 106,847 | ||
| 10 | Oradea | Bihor | 196,367 | 20 | Satu Mare | Satu Mare | 102,441 | ||
CIA World Factbook demographic statistics
The following demographic statistics are from the CIA World Factbook, unless otherwise indicated.
Age structure
- 0-14 years: 15.5% (male 1,772,583/female 1,681,539)
- 15–64 years: 69.7% (male 7,711,062/female 7,784,041)
- 65 years and over: 14.7% (male 1,332,120/female 1,934,076) (2010 est.)
As a consequence of the pro-natalist policies of the Nicolae Ceaușescu regime (see Decree 770), Romania has a higher proportion of people born in the late 1960s and 1970s its population than any other Western country except Slovenia. The generations born in 1967 and 1968 were the largest, although fertility remained relatively high until 1990. 8.55% of the Romanian population was born in the period from 1976 to 1980, compared with 6.82% of Americans and 6.33% of Britons.[15]
Urban-rural ratio
- Urban — 55.20%
- Rural — 44.80%
Population growth rate
The population growth rate is -0.127% (2007 estimate).[17] In common with many European countries, Romania has experienced a decline in population in recent years. The population fell by 1,129,000 or 4.95% in the decade 1992–2002. In three counties, Caraș-Severin, Hunedoara and Teleorman, the population fell by more than 10% over the same period. Only two counties, Ilfov and Iași saw their population increase.
Net migration rate
- -0.13 migrant(s)/1,000 population (2006 est.)[17]
Sex ratio
- at birth::1.06 male(s)/female
- under 15 years::1.05 male(s)/female
- 15–64 years::0.99 male(s)/female
- 65 years and over::0.71 male(s)/female
- total population::0.95 male(s)/female (2008 est.)
Infant mortality rate
9.2 deaths/1,000 live births (May 2010);[18] down from 17.3 deaths/1,000 live births in 2002.[19]
Life expectancy at birth
- Total population: 72.18 years
- male: 68.69 years
- female: 75.89 years (2008 est.)
Nationality
The noun form is Romanian(s), and the adjectival form is Romanian.
Religion
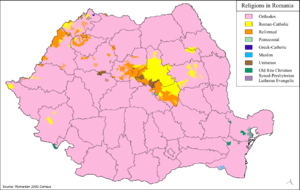
- Romanian Orthodox — 86.7%
- Roman Catholic — 4.7%
- Protestant Churches (Calvin, Lutheran, Unitarian, Pentecostal, Baptist, Adventist) — 5.3%
- Greek Catholic - Uniate — 0.9%
- Islam — 0.3%
- Atheist — ~0.04% (9,271 people)
- No religion — 0.1%
- Other religions — 2.0%
- Refused to declare — 0.1%
Religious affiliation tends to follow ethnic lines, with most ethnic Romanians identifying with the Romanian Orthodox Church. The Greek Catholic or Uniate church, reunified with the Orthodox Church by fiat in 1948, was restored after the 1989 revolution. The 2002 census indicates that 0.9% of the population is Greek Catholic, as opposed to about 10% prior to 1948. Roman Catholics, largely ethnic Hungarians and Germans, constitute 4.7% of the population; Calvinists, Baptists (see Baptist Union of Romania and Convention of the Hungarian Baptist Churches of Romania), Pentecostals, and Lutherans make up another 5%. There are smaller numbers of Unitarians, Muslims, and other religions.
See also
Notes
- ↑ (Romanian) "Recensământul populației și locuințelor - 2011" (PDF). Institutul Național de Statistică. Bucharest. July 2013.
- ↑ "Life expectancy". World Health Organization.
- ↑ "European health for all database (HFA-DB)". World Health Organization Regional Office for Europe.
- ↑ See, for example, Fabio Bordignon, "Italian Decentralisation in Romania", SEF 2003, Warsaw. Abstract available online.
- ↑ http://www.recensamantromania.ro/wp-content/uploads/2012/02/Comunicat_DATE_PROVIZORII_RPL_2011.pdf
- 1 2 (Romanian) "Populația României, scădere alarmantă: Suntem la nivelul lui 1966. Anual dispar două orașe mici". Ziare.com. 10 December 2015.
- ↑ (Romanian) "Evoluția populației României (milioane de locuitori)". Ziarul Financiar. 3 August 2015.
- ↑ (Romanian) Vasile Ghețău (2007). Declinul demografic și viitorul populației României. O perspectivă din anul 2007 asupra populației României în secolul 21 (PDF). Institutul Național de Cercetări Economice al Academiei Române. Editura Alpha MDN. ISBN 978-973-7871-88-6.
- ↑ Jewishvirtuallibrary.org
- ↑ Comunitati evreiesti din România, B'nai B'rith International and Federația Comunitatii Evreiesti din România. Accessed online 4 December 2006
- ↑ Populația pe Neamuri (in Romanian). Institutul Central de Statistică. pp. XXIV. Retrieved 2008-07-20.
- ↑ "Eurostat - Tables, Graphs and Maps Interface (TGM) table".
- 1 2 3 4 5 6 7 8 9 10 "Demographic events in 2015 - National Institute of Statistics".
- ↑ "Population at 20 October 2011" (in Romanian). INSSE. 5 July 2013. Retrieved 5 July 2013.
- ↑ "Countries Compared by People > Total population > Age 25-29 > % of the total. International Statistics at NationMaster.com".
- ↑ National Institute of Statistics, INSSE.ro, July 1, 2007 (Romanian)
- 1 2 "The World Factbook — Central Intelligence Agency".
- ↑ Populatia Romaniei, in continua scadere, July 12, 2010, wall-street.ro, Accessed online on August 2, 2012
- ↑ UNDP.ro (Romanian)
External links
| Wikimedia Commons has media related to Demographics of Romania. |
- United Nations Statistics - Romania
- Romanian National Statistic Institute (site is in Romanian language, pdf files are in Romanian and English)
- Population density map
Romania articles | |||||||
|---|---|---|---|---|---|---|---|
| History | |||||||
| Geography | |||||||
| Politics | |||||||
| Economy | |||||||
| Society |
| ||||||
| |||||||
According to the 2002 census | ||
| Officially recognised minorities |
|  |
| Historical ethnic groups |
| |
| Other minorities or recent immigrants |
| |