Demographics of Newfoundland and Labrador
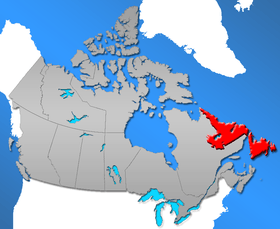
Newfoundland and Labrador (/ˈnjuːfəndlænd ənd læbrəˈdɔːr/; French: Terre-Neuve-et-Labrador,Latin: Terra Nova) is a province of Canada on the country's Atlantic coast in northeastern North America. The province has an area of 405,212 square kilometres (100,130,000 acres) and a population in 2011 of 514,563, with approximately 95% of the provincial population residing on the Island of Newfoundland (including its associated smaller islands), with nearly half of the population residing on the Avalon Peninsula. People from Newfoundland and Labrador are called "Newfoundlanders," "Labradorians" (as appropriate), or "Newfoundlanders and Labradorians".
Population since 1951
| Year | Population | Five Year % change |
Ten Year % change |
Rank Among Provinces |
|---|---|---|---|---|
| 1951 | 361,416 | n/a | n/a | 9 |
| 1956 | 415,074 | 14.8 | n/a | 9 |
| 1961 | 457,853 | 10.3 | 26.7 | 9 |
| 1966 | 493,396 | 7.8 | 18.9 | 9 |
| 1971 | 522,100 | 5.8 | 14.0 | 9 |
| 1976 | 557,720 | 6.8 | 13.0 | 9 |
| 1981 | 567,681 | 1.8 | 8.7 | 9 |
| 1986 | 568,350 | 0.1 | 1.9 | 9 |
| 1991 | 568,475 | 0.02 | 0.1 | 9 |
| 1996 | 551,790 | -2.9 | -2.9 | 9 |
| 2001 | 512,930 | -7.0 | -9.8 | 9 |
| 2006 | 505,469 | -1.5 | -8.4 | 9 |
| 2011 | 514,536 | 1.8 | 0.3 | 9 |
Source: Statistics Canada[1][2]
Ethnicity
More than half the population identified their ethnocultural ancestry as Canadian, while two-fifths identified English ancestry, and one fifth identified Irish ancestry.
| Ethnicity | 2001 | % |
|---|---|---|
| Canadian | 271,345 | 53.41% |
| English | 200,120 | 39.39% |
| Irish | 100,260 | 19.73% |
| Scottish | 30,295 | 5.96% |
| French | 27,785 | 5.47% |
| North American Indian | 16,030 | 3.16% |
| Inuit | 7,445 | 1.47% |
| German | 6,275 | 1.24% |
| Métis | 6,120 | 1.20% |
| Newfoundlander | 3,585 | 0.71% |
| Welsh | 2,790 | 0.55% |
| Dutch (Netherlands) | 1,385 | 0.27% |
| Italian | 1,180 | 0.23% |
| Norwegian | 1,180 | 0.23% |
| Chinese | 1,110 | 0.22% |
| American (USA) | 1,065 | 0.21% |
| East Indian | 940 | 0.19% |
| British | 925 | 0.18% |
| Spanish | 765 | 0.15% |
| Portuguese | 735 | 0.14% |
| Polish | 665 | 0.13% |
| Swedish | 655 | 0.13% |
| Ukrainian | 580 | 0.11% |
| Lebanese | 515 | 0.10% |
| Danish | 455 | 0.09% |
| Jewish | 370 | 0.07% |
| Filipino | 340 | 0.07% |
| Russian | 285 | 0.06% |
| Greek | 245 | 0.05% |
| Hungarian (Magyar) | 245 | 0.05% |
| Austrian | 225 | 0.04% |
| African (Black), n.i.e. | 180 | 0.04% |
| Egyptian | 165 | 0.03% |
| Finnish | 145 | 0.03% |
| Black | 120 | 0.02% |
| Jamaican | 120 | 0.02% |
| Acadian | 115 | 0.02% |
| Arab, n.i.e. | 115 | 0.02% |
| Belgian | 115 | 0.02% |
| Czech | 115 | 0.02% |
| Romanian | 115 | 0.02% |
| South African | 105 | 0.02% |
| Mongolian (2013) | 1 | 0.00% |
| Indonesian (2013) | 3 | 0.00% |
The same data on ethnocultural ancestry, grouped more geographically by Statistics Canada, are shown below:
| Origins | 2001 | % |
|---|---|---|
| North American | 274,755 | 54.08% |
| British Isles | 266,010 | 52.36% |
| Aboriginal | 28,065 | 5.52% |
| French | 27,835 | 5.48% |
| Western European | 7,705 | 1.52% |
| Southern European | 3,285 | 0.65% |
| Northern European | 2,510 | 0.49% |
| Eastern European | 2,050 | 0.40% |
| East and Southeast Asian | 1,685 | 0.33% |
| Origins | 2001 | % |
|---|---|---|
| South Asian | 1,110 | 0.22% |
| Arab | 915 | 0.18% |
| Other European | 520 | 0.10% |
| African | 465 | 0.09% |
| Caribbean | 270 | 0.05% |
| West Asian | 130 | 0.03% |
| Latin, Central and South American |
75 | 0.01% |
| Oceania | 45 | 0.01% |
Percentages are calculated as a proportion of the total number of respondents (508,075) and may total more than 100% due to dual responses.
Only groups of more than 0.02% are shown[3]
Visible minorities and Aboriginals
| Visible minority and Aboriginal population (Canada 2006 Census) | |||
|---|---|---|---|
| Population group | Population | % of total population | |
| White | 471,440 | 94.2% | |
| Visible minority group Source:[4] | South Asian | 1,590 | 0.3% |
| Chinese | 1,325 | 0.3% | |
| Black | 905 | 0.2% | |
| Filipino | 305 | 0.1% | |
| Latin American | 480 | 0.1% | |
| Arab | 540 | 0.1% | |
| Southeast Asian | 120 | 0% | |
| West Asian | 115 | 0% | |
| Korean | 60 | 0% | |
| Japanese | 140 | 0% | |
| Visible minority, n.i.e. | 75 | 0% | |
| Multiple visible minority | 65 | 0% | |
| Total visible minority population | 5,720 | 1.1% | |
| Aboriginal group Source:[5] | First Nations | 7,765 | 1.6% |
| Métis | 6,470 | 1.3% | |
| Inuit | 4,715 | 0.9% | |
| Aboriginal, n.i.e. | 4,205 | 0.8% | |
| Multiple Aboriginal identity | 290 | 0.1% | |
| Total Aboriginal population | 23,450 | 4.7% | |
| Total population | 500,610 | 100% | |
Languages
The 2006 Canadian census showed a population of 505,469.
Of the 499,830 singular responses to the census question concerning mother tongue the most commonly reported languages were:
| 2006 | % | 2001 | % | ||
|---|---|---|---|---|---|
| 1. | English | 488,405 | 97.71% | 499,750 | 98.49% |
| 2. | French | 1,885 | 0.38% | 2,180 | 0.43% |
| 3. | Algonquian languages | 1,625 | 0.33% | 1,510 | 0.30% |
| Montagnais–Naskapi | 1,585 | 0.32% | 1,495 | 0.29% | |
| 4. | Chinese | 1,080 | 0.22% | 525 | 0.10% |
| Cantonese | 185 | 0.04% | 55 | 0.01% | |
| Mandarin | 120 | 0.02% | 25 | ~ | |
| 5. | Spanish | 670 | 0.13% | 50 | 0.01% |
| 6. | German | 655 | 0.13% | 340 | 0.07% |
| 7. | Inuktitut | 595 | 0.12% | 550 | 0.11% |
| 8. | Urdu | 550 | 0.11% | 90 | 0.02% |
| 9. | Arabic | 540 | 0.11% | 210 | 0.04% |
| 10. | Dutch | 300 | 0.06% | 95 | 0.02% |
| 11. | Russian | 225 | 0.05% | 75 | 0.01% |
| 12. | Scandinavian languages | 220 | 0.04% | 125 | 0.02% |
| Norwegian | 85 | 0.02% | 40 | 0.01% | |
| Danish | 65 | 0.01% | 55 | 0.01% | |
| Swedish | 65 | 0.01% | 25 | ~ | |
| 13. | Italian | 195 | 0.04% | 115 | 0.02% |
| 14= | Germanic languages n.i.e. | 180 | 0.04% | 75 | 0.01% |
| 14= | Tagalog (Filipino) | 180 | 0.04% | 130 | 0.03% |
| 16. | Serbo-Croatian (all) | 170 | 0.03% | 130 | 0.03% |
| Serbian | 135 | 0.03% | 15 | ~ | |
| Croatian | 35 | 0.01% | 40 | 0.01% | |
| Serbo-Croatian | 0 | ~ | 75 | 0.01% | |
| 2006 | % | 2001 | % | ||
|---|---|---|---|---|---|
| 17. | Bengali | 165 | 0.03% | 55 | 0.01% |
| 18. | Portuguese | 150 | 0.03% | 105 | 0.02% |
| 19. | Hungarian | 140 | 0.03% | 45 | 0.01% |
| 20. | Panjabi (Punjabi) | 120 | 0.02% | 95 | 0.02% |
| 21= | African languages n.i.e. | 100 | 0.02% | 10 | ~ |
| 21= | Non-verbal languages | 100 | 0.02% | N | N |
| 23= | Bantu languages | 95 | 0.02% | 0 | ~ |
| 23= | Bulgarian | 95 | 0.02% | 75 | 0.01% |
| 25. | Niger–Congo languages n.i.e. | 85 | 0.13% | 40 | 0.1% |
| 26. | Romanian | 75 | 0.02% | 15 | ~ |
| 27= | Greek | 70 | 0.01% | 40 | 0.01% |
| 27= | Japanese | 70 | 0.01% | 45 | 0.01% |
| 29. | Telugu | 65 | 0.01% | 45 | 0.01% |
| 30= | Persian | 60 | 0.01% | 70 | 0.01% |
| 30= | Ukrainian | 60 | 0.01% | 20 | ~ |
| 32= | Czech | 50 | 0.01% | 15 | ~ |
| 32= | Gujarati | 50 | 0.01% | 50 | 0.01% |
| 32= | Hindi | 50 | 0.01% | 55 | 0.01% |
| 32= | Korean | 50 | 0.01% | 50 | 0.01% |
| 36. | Malayalam | 40 | 0.01% | 10 | ~ |
| 37. | Turkish | 40 | 0.01% | 25 | ~ |
| 38. | Welsh | 35 | 0.01% | 20 | ~ |
| 39. | Gaelic languages | 30 | 0.01% | 10 | ~ |
| 40. | Mongolian language (2013) | 1 | 0.00% | ~ | |
Note: "n.i.e.": not included elsewhere
There were also about 25 single-language responses for Amharic, 25 for Bisayan languages, 20 for Sinhala and 20 for Slovak. In addition, there were also 435 responses of English and a non-official language; 30 of French and a non-official language; 295 of English and French; and 10 of English, French, and a non-official language. (Figures shown are for the number of single language responses and the percentage of total single-language responses.)[6]
Migration
Immigration
The 2006 Canadian census counted a total of 8,380 immigrants living in Newfoundland and Labrador.
The most commonly reported origins for these immigrants were:[7]
| Rank | Origin | # Immigrants |
|---|---|---|
| 1. | United Kingdom | 2,335 |
| 2. | United States | 1,405 |
| 3. | India | 440 |
| 4. | Germany | 390 |
| 5. | China | 345 |
| 6. | Pakistan | 170 |
| 7. | Philippines | 160 |
| 8= | Ireland (Éire) | 150 |
| 8= | Netherlands | 150 |
| 10= | Egypt | 125 |
| 10= | South Africa | 125 |
| 12. | Colombia | 120 |
There were also about 115 immigrants from Portugal; about 105 each from Hong Kong and from Sudan; about 100 from the former Yugoslavia; about 95 each from El Salvador and from France; about 85 from Iraq; and about 75 each from Sri Lanka and from Russia.
Internal migration
A total of 41,840 people moved to Newfoundland and Labrador from other parts of Canada between 1996 and 2006 while 79,125 people moved in the opposite direction. These movements resulted in a net outmigration of 18,820 people to Alberta, 9,900 to Ontario 4,690 to Nova Scotia, 1,615 to British Columbia, 940 to Saskatchewan, 825 to the Northwest Territories, and 700 to Prince Edward Island; and a net influx of 690 people from Manitoba. During this period there was also a net outmigration of 580 francophones to Quebec and 230 francophones moving to Ontario, and a net influx of 320 anglophones from Quebec. (All net inter-provincial movements of more than 500 persons and all official minority movements of more than 100 persons are given.)[8][9]
Cities and towns
Ten Largest Urban Areas in the province by population[10]
| Urban Area | 2006 |
|---|---|
| St. John's | 181,113 |
| Corner Brook | 26,623 |
| Grand Falls-Windsor | 13,558 |
| Bay Roberts | 10,507 |
| Gander | 9,951 |
| Labrador City | 7,240 |
| Happy Valley – Goose Bay | 7,572 |
| Stephenville | 6,588 |
Largest municipalities by population
| Municipality | 2001 | 2006 |
|---|---|---|
| St. John's | 99,182 | 100,646 |
| Mount Pearl | 24,964 | 24,671 |
| Conception Bay South | 19,772 | 21,966 |
| Corner Brook | 20,103 | 20,083 |
| Grand Falls-Windsor | 13,340 | 13,558 |
| Paradise | 9,598 | 12,584 |
| Gander | 9,651 | 9,951 |
| Happy Valley – Goose Bay | 7,969 | 7,572 |
| Labrador City | 7,744 | 7,240 |
| Stephenville | 7,109 | 6,588 |
See also
References
- ↑ StatCan 2001 Census - population
- ↑ "Population and dwelling counts (2006 Census)". Statistics Canada. Retrieved 2011-01-10.
- ↑ Ethnic Origin (232), Sex (3) and Single and Multiple Responses (3) (2001 Census)
- ↑ and Labrador&SearchType=Begins&SearchPR=01&B1=All&Custom=, Community Profiles from the 2006 Census, Statistics Canada - Province/Territory
- ↑ and Labrador&SearchType=Begins&SearchPR=01&B1=All&Custom=, Aboriginal Population Profile from the 2006 Census, Statistics Canada - Province/Territory
- ↑ Detailed Mother Tongue (186), Knowledge of Official Languages (5), Age Groups (17A) and Sex (3) (2006 Census)
- ↑ Immigrant Status and Period of Immigration (8) and Place of Birth (261) (2006 Census)
- ↑ Province or Territory of Residence 5 Years Ago (14), Mother Tongue (8), Age Groups (16) and Sex (3) (2006 Census)
- ↑ Province or Territory of Residence 5 Years Ago (14), Mother Tongue (8), Age Groups (16) and Sex (3) (2001 census)
- ↑ Population and dwelling counts, for urban areas, 2006 and 2001 censuses - 100% data
| Ethnic ancestry |
| ||||||||||||||||||||||||||||||||||||||||||||||||||||||||||||||||||||||||
|---|---|---|---|---|---|---|---|---|---|---|---|---|---|---|---|---|---|---|---|---|---|---|---|---|---|---|---|---|---|---|---|---|---|---|---|---|---|---|---|---|---|---|---|---|---|---|---|---|---|---|---|---|---|---|---|---|---|---|---|---|---|---|---|---|---|---|---|---|---|---|---|---|---|
| Demographics | |||||||||||||||||||||||||||||||||||||||||||||||||||||||||||||||||||||||||
| Culture & society | |||||||||||||||||||||||||||||||||||||||||||||||||||||||||||||||||||||||||
| List of Canadians |
| ||||||||||||||||||||||||||||||||||||||||||||||||||||||||||||||||||||||||
| |||||||||||||||||||||||||||||||||||||||||||||||||||||||||||||||||||||||||
| Census divisions | |
|---|---|
| Cities | |
| Other communities |
|
| |
| Provinces | |
|---|---|
| Territories | |
| |