Demographics of New York City

| New York City's five boroughs | ||||||
|---|---|---|---|---|---|---|
| Jurisdiction | Population | Land area | Density | |||
| Borough | County | Estimate (2015)[1] | square miles | square km | persons / sq. mi | persons / sq. km |
New York |
1,644,518 | 22.83 | 59.1 | 72,033 | 27,826 | |
Bronx |
1,455,444 | 42 | 110 | 34,653 | 13,231 | |
Kings |
2,636,735 | 71 | 180 | 37,137 | 14,649 | |
Queens |
2,339,150 | 109 | 280 | 21,460 | 8,354 | |
Richmond |
474,558 | 58.5 | 152 | 8,112 | 3,132 | |
| 8,550,405 | 303.33 | 781.1 | 28,188 | 10,947 | ||
| 19,795,791 | 47,214 | 122,284 | 416.4 | 159 | ||
Sources: see individual borough articles | ||||||
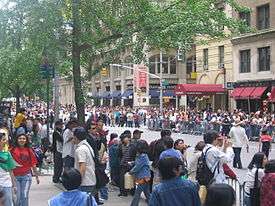
New York City's demographics show that it is a large and ethnically diverse metropolis.[2] It is the largest city in the United States with a population defined by a long history of international immigration. New York City was home to nearly 8.5 million people in 2014,[3] accounting for over 40% of the population of New York State and a slightly lower percentage of the New York metropolitan area, home to approximately 23.6 million. Over the last decade the city has been growing faster than the region. The New York region continues to be by far the leading metropolitan gateway for legal immigrants admitted into the United States.[4][5][6][7]
Throughout its history, New York City has been a major point of entry for immigrants; the term "melting pot" was coined to describe densely populated immigrant neighborhoods on the Lower East Side. As many as 800 languages are spoken in New York,[8][9][10] making it the most linguistically diverse city in the world.[9][11][12] English remains the most widely spoken language, although there are areas in the outer boroughs in which up to 25% of people speak English as an alternate language, and/or have limited or no English language fluency. English is least spoken in neighborhoods such as Flushing, Sunset Park, and Corona.
Population
| Historical population | ||
|---|---|---|
| Year | Pop. | ±% |
| 1698 | 4,937 | — |
| 1712 | 5,840 | +18.3% |
| 1723 | 7,248 | +24.1% |
| 1737 | 10,664 | +47.1% |
| 1746 | 11,717 | +9.9% |
| 1756 | 13,046 | +11.3% |
| 1771 | 21,863 | +67.6% |
| 1790 | 33,131 | +51.5% |
| 1800 | 60,515 | +82.7% |
| 1810 | 96,373 | +59.3% |
| 1820 | 123,706 | +28.4% |
| 1830 | 202,589 | +63.8% |
| 1840 | 312,710 | +54.4% |
| 1850 | 515,547 | +64.9% |
| 1860 | 813,669 | +57.8% |
| 1870 | 942,292 | +15.8% |
| 1880 | 1,206,299 | +28.0% |
| 1890 | 1,515,301 | +25.6% |
| 1900 | 3,437,202 | +126.8% |
| 1910 | 4,766,883 | +38.7% |
| 1920 | 5,620,048 | +17.9% |
| 1930 | 6,930,446 | +23.3% |
| 1940 | 7,454,995 | +7.6% |
| 1950 | 7,891,957 | +5.9% |
| 1960 | 7,781,984 | −1.4% |
| 1970 | 7,894,862 | +1.5% |
| 1980 | 7,071,639 | −10.4% |
| 1990 | 7,322,564 | +3.5% |
| 2000 | 8,008,288 | +9.4% |
| 2010 | 8,175,133 | +2.1% |
| 2014 | 8,491,079 | +3.9% |
| 1880 & 1890 figures include part of the Bronx. Beginning with 1900, figures are for consolidated city of five boroughs. For the same area before 1900, see #Historical Population data, below. Sources: 1698–1771,[13] 1790–1990,[14] 2000 and 2010 Censuses,[15] and 2014 Census estimates[16] | ||
New York City is the most populous city in the United States, with an estimated 8,491,079 people living in the city, according to U.S. Census estimates dating July 1, 2014[16] (up from 8,175,133 in 2010; 8.0 million in 2000; and 7.3 million in 1990).[15] This amounts to about 40% of New York State's population and a similar percentage of the metropolitan regional population. New York's two key demographic features are its population density and cultural diversity. The city's population density of 26,403 people per square mile (10,194/km²), makes it the densest of any American municipality with a population above 100,000.[17] Manhattan's population density is 66,940 people per square mile (25,846/km²), highest of any county in the United States.[18][19]
New York City is multicultural. About 36% of the city's population is foreign-born,[20] one of the highest among US cities. The eleven nations constituting the largest sources of modern immigration to New York City are the Dominican Republic, China, Jamaica, Guyana, Mexico, Ecuador, Haiti, Trinidad and Tobago, Colombia, Russia and El Salvador.[21]
The New York City metropolitan area is home to the largest Jewish community outside Israel.[22] It is also home to nearly a quarter of the nation's Indian Americans and 15% of all Korean Americans[23][24] and the largest Asian Indian population in the Western Hemisphere; the largest African American community of any city in the country; and including 6 Chinatowns in the city proper,[25] comprised as of 2008 a population of 659,596 overseas Chinese,[26] the largest outside of Asia. New York City alone, according to the 2010 Census, has now become home to more than one million Asian Americans, greater than the combined totals of San Francisco and Los Angeles.[27] New York contains the highest total Asian population of any U.S. city proper.[28] 6.0% of New York City is of Chinese ethnicity, with about forty percent of them living in the borough of Queens alone. Koreans make up 1.2% of the city's population, and Japanese at 0.3%. Filipinos are the largest southeast Asian ethnic group at 0.8%, followed by Vietnamese who make up only 0.2% of New York City's population. Indians are the largest South Asian group, comprising 2.4% of the city's population, and Bangladeshis and Pakistanis at 0.7% and 0.5%, respectively.[29]
The largest ethnic groups as of the 2005 census estimates are: African American, African or Caribbean, Puerto Ricans, Italians, West Indians, Dominicans, Chinese, Irish, Russian, and German.[30][31] The Puerto Rican population of New York City is the largest outside Puerto Rico.[32] Italians emigrated to the city in large numbers in the early 20th century, establishing several "Little Italies". The Irish also have a notable presence, along with Germans.
New York City has a high degree of income variation. In 2005 the median household income in the highest census tract was reported to be $188,697, while in the lowest it was $9,320.[33] The variance is driven by wage growth in high income brackets, while wages have stagnated for middle and lower income brackets. In 2006 the average weekly wage in Manhattan was $1,453, the highest and fastest growing among the largest counties in the United States.[34] The borough is also experiencing a "baby boom" among the wealthy that is unique among U.S. cities. Since 2000, the number of children under age 5 living in Manhattan has grown by more than 32%.[35]
In 2000, about 3 out of every 10 New York City housing units were owner-occupied, compared to about 2 owner-occupied units out of every 3 units in the U.S. as a whole.[36] Rental vacancy is usually between 3% and 4.5%, well below the 5% threshold defined to be a housing emergency, justifying the continuation of rent control and rent stabilization. About 33% of rental units fall under rent stabilization, according to which increases are adjudicated periodically by city agencies. Rent control covers only a very small number of rental units.[37] Some critics point to New York City's strict zoning and other regulations as partial causes for the housing shortage, but during the city's decline in population from the 1960s through the 1980s, a large number of apartment buildings suffered suspected arson fires or were abandoned by their owners. Once the population trend was reversed, with rising prospects for rentals and sales, new construction has resumed, but generally for purchasers in higher income brackets.
New York is the largest city in the United States, with the city proper's population more than double the next largest city, Los Angeles (or roughly equivalent to the combined populations of Los Angeles, Chicago, and Houston, the United States' second, third, and fourth most populous cities respectively). Demographers estimate New York's population will reach between 9.4 and 9.7 million by 2030.[38] In 2000 the reported life expectancy of New Yorkers was above the national average. Life expectancy for females born in 2009 in New York City is 80.2 years and for males is 74.5 years.[39]
| New York City compared | |||||
| 2010 Census Data | New York City | Los Angeles | Chicago | New York State | United States |
| Total population | 8,175,133 | 3,792,820 | 2,695,598 | 19,378,102 | 308,745,538 |
| Population, percent change, 2000 to 2010 | +2.1% | +2.6% | -6.9% | +2.1% | +9.7% |
| Population density | 27,012 /sq. mi. | 8,092 /sq. mi. | 11,864 /sq. mi. | 408.7 /sq. mi. | 87.4 /sq. mi. |
| Median household income (1999) | $38,293 | $36,687 | $38,625 | $43,393 | $41,994 |
| Per capita income (1999) | $22,402 | $20,671 | $20,175 | $23,389 | $21,587 |
| Bachelor's degree or higher | 27% | 26% | 26% | 27% | 24% |
| Foreign born | 36% | 41% | 21.7% | 20% | 13% |
| White | 44.6% | 49.8% | 45.0%[40] | 66.4% | 72.4% |
| Black | 25.1% | 9.6% | 32.9% | 15.5% | 12.6% |
| Hispanic (any race) | 27.5% | 48.5% | 28.9% | 17.3% | 16.3% |
| Asian | 11.8% | 11.3% | 5.5% | 5.9% | 4.8% |
New York's two key demographic features are its density and diversity. The city has an extremely high population density of 26,403 people per square mile (10,194/km²), about 10,000 more people per square mile than the next densest large American city, San Francisco.[41] Manhattan's population density is 66,940 people per square mile (25,846/km²).[19]
The city has a long tradition of attracting international immigration and Americans seeking careers in certain sectors. As of 2006, New York City has ranked number one for seven consecutive years as the city most U.S. residents would most like to live in or near.[42]
Immigration
Throughout its history New York City has been a principal entry point for immigration to the United States. These immigrants often form ethnic enclaves, neighborhoods dominated by one ethnicity. The city experienced major immigration from Europe in the 19th century and another major wave in the early 20th century, being admitted into the United States of America primarily through Ellis Island. Since the passage of the Immigration and Nationality Act of 1965, and particularly since the 1980s, New York City has seen renewed rates of high immigration. Newer immigrants are from Latin America, the Caribbean, Asia, Eastern Europe and Africa. 36% of the city's population is foreign-born.[20] Among U.S. cities, this proportion is higher only in Los Angeles and Miami.[19] In New York no single country or region of origin dominates. The eleven largest countries of origin are the Dominican Republic, China, Jamaica, Guyana, Mexico, Ecuador, Haiti, Trinidad and Tobago, Colombia, Russia and El Salvador.[43] Between 1990 and 2000 the city admitted 1,224,524 immigrants.[44] Demographers and city officials have observed that immigration to New York City has been slowing since 1997. This is mostly due to more and more immigrants choosing directly to locate to the city's suburbs and then commute to the city or work in many of its booming edge cities like Fort Lee, NJ, Jersey City, Hempstead, NY, Morristown, NJ, Stamford, CT, White Plains, NY and others. Despite the slowdown in immigration the city's overall immigrant population has continued to increase and in 2006 it numbered 3.038 million (37.0%) up from 2.871 million (35.9%) in 2000.[45][46] By 2013, the population of foreign-born individuals living in New York City had increased to 3.07 million, and as a percentage of total population, was the highest it had been in the past 100 years.[47]
Demographic profile
Minority ancestries
Immigrant Africans, Caribbeans, and African Americans make up 25.1% of New York City's population. According to the U.S. Census Bureau, there were 2,086,566 black people residing in New York City. Percentage wise, approximately two out of every five black residents of New York City resides in Brooklyn (primarily in the Central, Northern, and Eastern sections of the borough), one out of every five resides in Bronx (mainly in the borough's Northeastern, Southeastern and Southern sections) one out of every five resides in Queens (mainly in the borough's Southeastern area), with the remaining black residents residing in Manhattan (primarily in Harlem) and Staten Island (mainly the North Shore of the borough).
Native Americans make up 0.4% of New York City's population. According to the survey, there were 29,569 Native Americans residing in New York City. Of 29,569 Native Americans, 2,075 were of the Cherokee tribal grouping. In addition, 213 were of the Navajo tribal grouping. Also, 42 people identified themselves as Chippewa, and 47 people identified themselves as Sioux. There is a number of Mohawks indigenous to the New York city area and/or Upstate New York, and many Mohawks arrived in the 1930s to work in the skyscraper building construction industry.[48] And a few Lenape Indians indigenous to the New York city area still remain in the city, migrated from other rural parts to Manhattan.[49]
Asian Americans make up 11.8% of New York City's population. According to the survey, there were 976,807 Asian Americans residing in New York City. Of 976,807 Asian Americans, 445,145 were of Chinese descent, representing 5.4% of the city's population. In addition, there were 226,888 Indian Americans residing in the city, representing 2.7% of the population. Approximately 103,660 people identified themselves as "Other Asian", a category that includes people of Cambodian, Laotian, Hmong, and Pakistani descent. Individuals in this category represent 1.2% of the city's population. There were 88,162 Korean Americans residing in the city, representing 1.1% of the population. Other Asian American groups include those of Filipino (68,826, 0.8%), Japanese (26,096, 0.3%), and Vietnamese (18,030, 0.2%) descent.
Pacific Islander Americans make up 0.1% of New York City's population. According to the survey, there were 4,941 Pacific Islander Americans residing in New York City. Of 4,941 Pacific Islander Americans, 1,992 were Native Hawaiian. Approximately 904 were of Samoan descent, and 504 were of Guamanian descent. In addition, 1,541 were of other Pacific Islander ancestries.
There is a considerable Bulgarian population in New York. Bulgarians migrated in New York in the 1900s.[50]
Multiracial Americans make up 2.1% of New York City's population. According to the survey, there were 177,643 multiracial Americans residing in New York City. People of black and white ancestry numbered at 37,124, making up 0.4% of the population. People of white and Asian ancestry numbered at 22,242, making up 0.3% of the population. People of white/Native American ancestry (10,762) and black/Native American ancestry (10,221) each made up 0.1% of the city's population. The term "Multiracial American", however, can be very misleading. For example, many people of Latin American background may have various racial ancestries. Furthermore, there are many Americans who have multiple racial ancestries who are not aware of it. Therefore, the actual numbers are likely much higher.
Hispanics and Latinos make up 27.5% of New York City's population. According to the American Community Survey, there were 2,287,905 Hispanic or Latino Americans residing in New York City. The Hispanic/Latino population is categorized with four groups, "Puerto Rican" (785,618 or 9.4%), "Mexican" (297,581 or 3.6%), "Cuban" (42,377 or 0.5%), and "Other Hispanic or Latino" (1,165,576 or 14.0%).[51]
According to the 2006-2007 Center for Latin American, Caribbean & Latino Studies:[52]
- Puerto Rican: (1,278,628)
- Dominican: (602,093)
- Mexican: (289,755)
- Ecuadorian: (201,708)
- Colombian: (113,469)
- Salvadoran:(100,396)
- Other Hispanic or Latino: (351,635)
Note: This source contains all of the numerical information in the data above.
White ancestries
White Americans make up 44.6% of New York City's population. According to the survey, there were 3,704,243 White Americans residing in New York City. White Americans of non-Hispanic origin make up 35.1% of the city's population. There are 2,918,976 non-Hispanic whites residing in the city. Much of New York City's European American population consists of individuals of Italian, Irish, German, Russian, Polish, English, and Greek ancestry.[53]
According to the 2006–2008 American Community Survey, the top ten White, European ancestries were the following:[54]
- Italian: 8.2% (684,230)
- Irish: 5.3% (443,364)
- German: 3.6% (296,901)
- Russian: 3.1% (260,821)
- Polish: 2.8% (237,919)
- English: 1.9% (160,472)
- Greek: 1.0% (83,575)
- French: 0.9% (73,587)
- Hungarian: 0.7% (59,225)
- Ukrainian: 0.6% (49,643)
Other smaller European ancestries include:
- Portuguese: 0.5% (46,384)
- Scottish: 0.5% (41,787)
- Scotch-Irish: 0.3% (28,770)
- Dutch: 0.3% (24,776)
- Norwegian: 0.3% (24,737)
- Swedish: 0.3% (22,206)[54]
Diversity of New York City's boroughs
According to a 2001 study by Claritas, four of the city's five boroughs ranked among the nation's twenty most diverse counties. Queens ranked 1st, Brooklyn 3rd, Manhattan 7th, and The Bronx 17th. In addition, Hudson County and Essex County, New Jersey, both of which are part of the New York Metropolitan Area, ranked 6th and 15th, respectively.[55]
The city has several demographically unique characteristics. Queens is the only large county in the United States where the median income among black households, about $52,000 a year, has surpassed that of whites.[56]
The New York City metropolitan area is home to the largest Jewish community outside Israel.[57] It is also home to nearly a quarter of the nation's Indian American population,[58] and the largest African American community of any city in the country. New York City, with about 800,000 Puerto Rican residents, has the largest Puerto Rican population outside of Puerto Rico. Another historically significant ethnic group are Italians, who emigrated to the city in large numbers in the early 20th century. New York City is home to the largest Italian American population in the United States. The Irish and Germans also have a notable presence.
| Borough | 1970 |
1980 |
1990 |
2000 |
2006 |
|---|---|---|---|---|---|
| Brooklyn | 17.5 | 23.8 | 29.2 | 37.8 | 37.8 |
| Queens | 21.0 | 28.6 | 36.2 | 46.1 | 48.5 |
| Manhattan | 20.0 | 24.4 | 25.8 | 29.4 | 28.7 |
| Bronx | 15.6 | 18.4 | 22.8 | 29.0 | 31.8 |
| Staten Island | 9.0 | 9.8 | 11.8 | 16.4 | 20.9 |
| Total | 18.2 | 23.6 | 28.4 | 35.9 | 37.0 |
| Jurisdiction |
Population 2000 census |
% white |
% black or African American |
% Asian |
% Other |
% mixed race |
% Hispanic/ Latino of any race |
% Catholic |
% not affiliated |
% Jewish |
% Protestant |
Estimate of % not reporting | |
|---|---|---|---|---|---|---|---|---|---|---|---|---|---|
| Race | Ethnicity | Religious groups | |||||||||||
| Brooklyn | 2,465,326 | 41.2 | 36.4 | 7.5 | 10.6 | 4.3 | 19.8 | 37 | 4 | 15 | 8 | 33 | |
| Queens | 2,229,379 | 44.1 | 20.0 | 17.6 | 12.3 | 6.1 | 25.0 | 29 | 37 | 11 | 5 | 15 | |
| Manhattan | 1,537,195 | 54.4 | 17.4 | 9.4 | 14.7 | 4.1 | 27.2 | 37 | 11 | 20 | 9 | 19 | |
| Bronx | 1,332,650 | 29.9 | 35.6 | 3.0 | 25.7 | 5.8 | 48.4 | 44 | 14 | 6 | 5 | 29 | |
| Staten Island | 443,728 | 77.6 | 9.7 | 5.7 | 4.3 | 2.7 | 12.1 | 60 | 11 | 8 | 5 | 14 | |
| NYC Total | 8,008,278 | 44.7 | 26.6 | 9.8 | 14.0 | 4.9 | 27.0 | 37 | 17 | 13 | 6 | 24 | |
| NY State | 18,976,457 | 67.9 | 15.9 | 5.5 | 7.5 | 3.1 | 15.1 | 42 | 20 | 9 | 10 | 16 | |
| USA | 281,421,906 | 75.1 | 12.3 | 3.6 | 6.5 | 2.4 | 12.5 | 22 | 37 | 2 | 23 | 12 | |
| Source: 2000 Census[60]
American Indian, Native Alaskan, Native Hawaiian, and Pacific Islander make up 2.9% of the population of NYC, and have been included with "Other". | |||||||||||||
| Source for religious groups: ARDA[61] | |||||||||||||
Households
The 2000 census counted 2,021,588 households with a median income of $38,293. 30% of households had children under the age of 18, and 37% were married couples living together. 19% had a single female householder, and 39% were non-families. 32% of all households were made up of individuals, and 10% were single residents 65 years of age or older. The average household size was 2.59 persons, and the average family size was 3.32.
The age range was as follows: 24% were under the age of 18, 10% between 18 and 24, 33% between 25 and 44, 21% between 45 and 64, and 12% were 65 or older. The median age in New York City in 2000 was 34 years. For every 100 females there were 90 males. For every 100 females age 18 and over, there were 86 males.
The borough of Manhattan is experiencing a "baby boom" that is unique among U.S. cities. Since 2000, the number of children under age 5 living in Manhattan has grown by more than 32%.[62] The increase is driven mostly by affluent white families with median household incomes over $300,000.
Income
Overall, nominal household income in New York City is characterized by large variations. This phenomenon is especially true of Manhattan, which in 2005 was home to the highest incomes U.S. census tract, with a household income of $188,697, as well as the lowest, where household income was $9,320.[63] The disparity is driven in part by wage growth in high income brackets. In 2006 the average weekly wage in Manhattan was $1,453, the highest among the largest counties in the United States.[34] Wages in Manhattan were the fastest growing among the nation's 10 largest counties.[34] Among young adults in New York who work full-time, women now earn more money than men — approximately $5,000 more in 2005.[64] Nationally, women's wages still lag behind men.
New York City's borough of Manhattan is the highest nominal income county in the United States. In particular, ZIP code 10021 on Manhattan's Upper East Side, with more than 100,000 inhabitants and a per capita income of over $90,000, has one of the largest concentrations of income in the United States. The other boroughs, especially Queens and Staten Island, have large middle-class populations.
New York City's per capita income in 2000 was $22,402; men and women had a median income of $37,435 and $32,949 respectively. 21.2% of the population and 18.5% of families had incomes below the federal poverty line; 30.0% of this group were under the age of 18 and 17.8% were 65 and older.
The New Yorker with the highest wealth and income is oil magnate David H. Koch whose net worth is an estimated $44 billion (Forbes, March 2013)[65] to $34 billion (Bloomberg, April 2013),[66] an increase of $3 to $5 billion a year since 2007, when his wealth was about $12 billion.[67] Of Forbes Magazine's 400 richest American billionaires, 70 live in New York City.[65] New York City's recent mayor, Michael Bloomberg, is himself one of the nation's richest men. As of 2009 New York has regained the number one spot as the city with most billionaires (55), after losing out to Moscow in 2008.
| Area | Median House- hold Income |
Mean House- hold Income |
Percent- age in Poverty |
|---|---|---|---|
| The Bronx | $34,156 | $46,298 | 27.1% |
| Brooklyn | $41,406 | $60,020 | 21.9% |
| Manhattan | $64,217 | $121,549 | 17.6% |
| Queens | $53,171 | $67,027 | 12.0% |
| Staten Island | $66,985 | $81,498 | 9.8% |
| New York City | $48,631 | $75,809 | 18.5% |
| New York State | $53,514 | $77,865 | 13.7% |
| United States | $50,140 | $69,193 | 13.0% |
Religion
Christianity (59%), particularly Catholicism (33%), was the most prevalently practiced religion in New York as of 2014,[68] followed by Judaism, with approximately 1.2 million Jews in New York City,[69][70] about 14% of the population.[71]Islam, Hinduism, Sikhism, Buddhism, and atheism are also prominent throughout New York City. In 2014, 24% self-identified with no organized religious affiliation.[68]
Projections
New York has ranked first in population among American cities since the first census in 1790. New York will maintain this position, although there are varying forecasts on how much the population will increase. The most realistic population projections from the Department of City Planning anticipate a 1.1 million increase by 2030, bringing the city's population total to 9.1 million.
While the city's projected 2030 population will be a new high, only two boroughs, Staten Island and Queens have reached their population peak every year for the last 5 years. The study projects that by 2030, Queens will have 2.57 million people and Staten Island 552,000. Manhattan, with 1.83 million, Bronx with 1.46 million and Brooklyn with 2.72 million, will still be below their population peaks.[72]
Disputed 2010 Census data
On March 27, 2011, New York City Mayor Michael Bloomberg announced that the city would file a formal challenge to the Census results, as a result of alleged undercounting in the boroughs of Queens and Brooklyn.[73] The mayor has asserted that the numbers for Queens and Brooklyn, the two most populous boroughs, are implausible.[74] According to the Census, they grew by only 0.1% and 1.6%, respectively, while the other boroughs grew by between 3% and 5%. In addition, the Mayor claims, the census showed improbably high amounts of vacant housing in vital neighborhoods such as Jackson Heights, Queens.
Historical population data
| Historical Population of the present area of New York City and its boroughs * [15][75][76][77] | ||||||
|---|---|---|---|---|---|---|
| Year | Manhattan | Brooklyn | Queens | Bronx | Staten Is. | Total |
| 1698 | 4,937 | 2,017 | n/a | n/a | 727 | 7,681 |
| 1771 | 21,863 | 3,623 | n/a | n/a | 2,847 | 28,423 |
| 1790 | 33,131 | 4,549 | 6,159 | 1,781 | 3,827 | 49,447 |
| 1800 | 60,515 | 5,740 | 6,642 | 1,755 | 4,563 | 79,215 |
| 1810 | 96,373 | 8,303 | 7,444 | 2,267 | 5,347 | 119,734 |
| 1820 | 123,706 | 11,187 | 8,246 | 2,782 | 6,135 | 152,056 |
| 1830 | 202,589 | 20,535 | 9,049 | 3,023 | 7,082 | 242,278 |
| 1840 | 312,710 | 47,613 | 14,480 | 5,346 | 10,965 | 391,114 |
| 1850 | 515,547 | 138,882 | 18,593 | 8,032 | 15,061 | 696,115 |
| 1860 | 813,669 | 279,122 | 32,903 | 23,593 | 25,492 | 1,174,779 |
| 1870 | 942,292 | 419,921 | 45,468 | 37,393 | 33,029 | 1,478,103 |
| 1880 | 1,164,673 | 599,495 | 56,559 | 51,980 | 38,991 | 1,911,698 |
| 1890 | 1,441,216 | 838,547 | 87,050 | 88,908 | 51,693 | 2,507,414 |
| †1900 | 1,850,093 | 1,166,582 | 152,999 | 200,507 | 67,021 | 3,437,202 |
| 1910 | 2,331,542 | 1,634,351 | 284,041 | 430,980 | 85,969 | 4,766,883 |
| 1920 | 2,284,103 | 2,018,356 | 469,042 | 732,016 | 116,531 | 5,620,048 |
| 1930 | 1,867,312 | 2,560,401 | 1,079,129 | 1,265,258 | 158,346 | 6,930,446 |
| 1940 | 1,889,924 | 2,698,285 | 1,297,634 | 1,394,711 | 174,441 | 7,454,995 |
| 1950 | 1,960,101 | 2,738,175 | 1,550,849 | 1,451,277 | 191,555 | 7,891,957 |
| 1960 | 1,698,281 | 2,627,319 | 1,809,578 | 1,424,815 | 221,991 | 7,781,984 |
| 1970 | 1,539,233 | 2,602,012 | 1,986,473 | 1,471,701 | 295,443 | 7,894,862 |
| 1980 | 1,428,285 | 2,230,936 | 1,891,325 | 1,168,972 | 352,121 | 7,071,639 |
| 1990 | 1,487,536 | 2,300,664 | 1,951,598 | 1,203,789 | 378,977 | 7,322,564 |
| 2000 | 1,537,195 | 2,465,326 | 2,229,379 | 1,332,650 | 443,728 | 8,008,278 |
| 2010 | 1,585,873 | 2,504,700 | 2,230,722 | 1,385,108 | 468,730 | 8,175,133 |
| 2015 | 1,644,518 | 2,636,735 | 2,339,150 | 1,455,444 | 474,558 | 8,550,405 |
| * All population figures are consistent with present-day boundaries. † First census after the consolidation of the five boroughs | ||||||
Ethnicities and enclaves

White
Black
Asian
Hispanic
Other
African diaspora

According to the 2010 Census, New York City had the largest population of self-defined black residents of any U.S. city, with over 2 million within the city's boundaries, although this number has decreased since 2000.[78] New York City had more black people than did the entire state of California until the 1980 Census. The black population consists of immigrants and their descendants from Africa and the Caribbean as well as native-born African-Americans. Many of the city's black residents live in Brooklyn and The Bronx. Several of the city's neighborhoods are historical birthplaces of urban black culture in America, among them the Brooklyn neighborhood of Bedford–Stuyvesant and Manhattan's Harlem and various sections of Eastern Queens and The Bronx. Bedford-Stuyvesant is considered to have the highest concentration of black residents in the United States. New York City has the largest population of black immigrants (at 686,814) and descendants of immigrants from the Caribbean (especially from Jamaica, Trinidad and Tobago, Barbados, Guyana, Belize, Grenada, and Haiti), and of sub-Saharan Africans. In a news item of April 3, 2006, however, the New York Times noted that for the first time since the American Civil War, the recorded African American population was declining, because of emigration to other regions, a declining African American birthrate in New York, and decreased immigration of blacks from the Caribbean and Africa.[79]
In 2005, the median income among black households in Queens was almost $52,000 a year, surpassing that of white households.[80]
The Bronx
- Parkchester
- Baychester
- Castle Hill
- Co-op City
- Fordham
- Morrisania
- Mott Haven
- Wakefield
- Williamsbridge
Brooklyn
- Bedford-Stuyvesant
- Brownsville
- Bushwick
- Canarsie
- Crown Heights
- East Flatbush
- East New York
- Flatbush
- Gowanus
- Ocean Hill
- Red Hook
- Coney Island
- Fort Greene
Manhattan
Queens
- Corona
- East Elmhurst
- Far Rockaway
- Jamaica, Queens
- Rosedale
- St. Albans including Addisleigh Park
- South Jamaica
- South Ozone Park
Staten Island
Asian
Chinese

Main articles: Chinatown, Manhattan; Little Fuzhou; Chinatown, Flushing; Chinatown, Brooklyn; and Chinese Americans in New York City
The New York City Metropolitan Area contains the largest ethnic Chinese population outside Asia, enumerating an estimated 735,019 individuals as of 2012,[81] including at least 9 Chinatowns, comprising the original Manhattan Chinatown, three in Queens (the Flushing Chinatown, the Elmhurst Chinatown, and the newly emerged Chinatown in Corona), three in Brooklyn (the Sunset Park Chinatown, the Avenue U Chinatown, and the Bensonhurst Chinatown), and one each in Edison, New Jersey and Nassau County, Long Island,[82] not to mention fledgling ethnic Chinese enclaves emerging throughout the New York City metropolitan area.[83]
Filipino
New York City was home to an estimated 82,313 Filipinos in 2011, representing a 7.7% increase from the estimated 77,191 in 2008, with 56%, or about 46,000, in Queens.[84] Immigration from the Philippines began mainly after 1965, when immigration quotas that prevented Filipino immigration for many years were abolished. While there was earlier immigration from the Philippines, it was in low numbers and mainly concentrated in Hawaii and California. Since then, Filipinos have settled in Northeastern cities, with a majority in the New York City metropolitan area. Most of these immigrants have been professionals (doctors, nurses, other medical professions, accountants and engineers). The Filipino median household income in New York City was $81,929 in 2013, and 68% held a bachelor's degree or higher.[84]
New York City annually hosts the Philippine Independence Day Parade, which is traditionally held on the first Sunday of June at Madison Avenue. The celebration occupies nearly twenty-seven city blocks which includes a 3.5-hour parade and an all-day long street fair and cultural performances.
A "Little Manila" can be found in Woodside, in the borough of Queens.[85] Filipinos are also concentrated in Jackson Heights and Elmhurst in Queens.[86] There are also smaller Filipino communities in Jamaica, Queens and parts of Brooklyn. The Benigno Aquino Triangle is located on Hillside Avenue in Hollis, Queens to commemorate the slain Filipino political leader and to recognize the large Filipino American population in the area.[87]
Although not technically part of New York City, other large Filipino populations just outside the city's borders can be found in neighboring Northern and Central New Jersey, particularly in Bergen, Hudson, Middlesex,[88] and Passaic counties. By 2013 Census estimates, the New York City metropolitan area was estimated to be home to 224,266 Filipino Americans, 88.5% (about 200,000) of them single-race Filipinos.[89] Over 150,000 Fipino-born immigrants made their home in the New York City tri-state metropolitan region in 2011.[90] In 2012, a Census-estimated 235,222 single- and multi-racial Filipino Americans lived in the broader New York-Newark-Bridgeport, NY-NJ-CT-PA Combined Statistical Area.[91]
Korean

Main articles: Korean Americans in New York City; Koreatown, Manhattan; and Koreatown, Long Island
New York City is home to 100,000 ethnic Koreans, with two-thirds living in Queens.[92] On the other hand, the overall Greater New York Combined Statistical Area[93] enumerated 218,764 Korean American residents as of the 2010 United States Census, the second largest population of Koreans outside of Korea.[94]
South Asian
According to 2007 American Community Survey estimates, New York City is home to approximately 315,000 people from the Indian subcontinent, which includes the countries of India (236,117), Pakistan (39,002), Bangladesh (34,332), and Sri Lanka (5,010). South Asians constitute 3.8% of New York City's population.[95] The New York City Metropolitan Area is home to approximately 600,000 Indian Americans, representing the largest Asian Indian population in the Western Hemisphere. A majority of the South Asian residents are concentrated in Queens neighborhoods such as Jackson Heights, Flushing, City Line, Ozone Park, Glen Oaks, Floral Park, Bellerose, Jamaica, Kew Gardens, and Elmhurst. In the borough of Queens, the South Asian population is approximately near 200,000 and counting, where they constitute 8.2% of the population. South Asians from the Caribbean majority from Guyana, Trinidad, and a small number from Jamaica are also large in number.
According to the 2010 United States Census, there are 192,209 Asian Indians, 53,174 Bangladeshis, 41,887 Pakistanis, and 3,696 Sri Lankans in New York City.[96]
The New York City Metropolitan Area contains the largest Sri Lankan community in the United States (second largest in North America after Toronto, Ontario, Canada), receiving the highest legal permanent resident Sri Lankan immigrant population.[97] The Little Sri Lanka in the Tompkinsville neighborhood of the borough of Staten Island is one of the largest Sri Lankan communities outside of the country of Sri Lanka itself.[98][99]
Japanese
As of the 2000 Census about over half of the 37,279 people of Japanese ancestry in New York State lived in New York City.[100]
Middle Eastern
Arab

Arabs first immigrated to New York city in the 1880s, the vast majority of them came from modern day Lebanon and Syria. Before the advent of modern Lebanon in August 1920, and due to the political and historical nature of Ottoman-ruled Syria, the majority of Lebanese and Syrians referred to themselves as "Syrian" on arrival to Ellis Island.[101] Little by little, starting in the 1930s, immigrants from Lebanon started referring to themselves as "Lebanese American" and immigrants from Syria retained the designation "Syrian American". From 1880 to 1960 the overwhelming majority (90%) of Lebanese and Syrian immigrants were of the Christian faith.[102] After 1960, especially after the Immigration and Nationality Act of 1965, Arab Muslims from other Arab countries and territories such as Palestine, Jordan, and Egypt started arriving in New York. The Syrian/Lebanese mother colony was located around Washington street in Lower Manhattan, in a neighborhood called Little Syria.[103] Syrian immigration to the United States was very small with respect to the other ethnic groups or peoples that arrived in America. In 1910, at the peak of Syrian immigration, only 60 000 Syrians entered the United States.[101]
Around the late 1930s Little Syria started to go into decline with the construction of skyscrapers in Lower Manhattan. In the name of urban renewal, the skyscraper era was ushered in and preceded with the destruction of 5 story tenements that Syrians called home. The final blow to Little Syria commenced with the construction of the Brooklyn battery tunnel in 1940. A large percentage of the community moved to the area around downtown Brooklyn; and set up shops and businesses on Atlantic Avenue. St. George's Syrian Catholic Church is the last physical reminder of the Syrian- and Lebanese-American community that once lived in Little Syria.[101] In Brooklyn there are two long time established businesses still open on Atlantic Avenue. Damascus Bakery is still in business since 1936, and Sahadi's has had a strong loyal customer base since 1948. By the 1960s the community was to move yet again this time to Park Slope and Bay Ridge.[104]
The New York metro area contains the largest concentration of populations with Arab and Middle Eastern ancestry in the U.S., with 230,899 residents of the metro area claiming Arab ancestry in the 2000 U.S. Census.[105] An estimated 70,000 lived in New York City proper as of 2000.[106][107] New York City holds the New York Arab-American Comedy Festival, founded in 2003 by comedians Dean Obeidallah and Maysoon Zayid.
European
German
Carl Schurz, a refugee from the unsuccessful first German democratic revolution of 1848, served as United States Secretary of the Interior and as United States Senator from Missouri. Carl Schurz Park in Manhattan is named after him.
The influence of German immigration can still be felt in areas of New York City. The Yorkville neighborhood on the Upper East Side of Manhattan was a center of German-American culture. As of the 2000 census 255,536 New Yorkers reported German ancestry.[108]
In the middle of the 19th century, Little Germany, situated in what is now termed Alphabet City, was the first non-English-speaking urban enclave in the United States.
Greek
Greek immigration to New York City began mainly in the 1890s. The push factors for immigration were the Balkan Wars and World War I. Greek immigration to New York City took place between 1890 until around 1917. In the latter years more women arrived and communities began to grow, especially in Astoria, Queens. Greeks again began to arrive in large numbers after 1945, as they fled the economic devastation caused by World War II and the Greek Civil War.
In the first immigration wave, most of the Greek immigrants were men. Many of them worked in industrial labor jobs, and others created a niche in the fur business. This immigration wave brought 450,000 Greeks to the Northeast, largely concentrated in New York City. The second immigration wave taking place after 1945 and 1982, was smaller with a total of 211,000 immigrants, mostly within the Northeast. However, new immigrants helped revive assimilating Greek communities and added new energy to a sense of ethnic identity.
The largest concentration of Greeks can still be found in Astoria. The Greek community there was established in the early 20th century immigration. The neighborhood still has many Greek food stores and restaurants. Residents of Greek descent make up 1.0% of New York City's population.
Irish
The Irish community is one of New York's major ethnic groups and has been a significant proportion of the city's population since the waves of immigration in the mid-19th century. New York City's St. Patrick's Day Parade dates to 1762.
During the Great Irish Famine (1845–1851), Irish families were forced to emigrate from Ireland; by 1854, between 1.5 and 2 million people were forced to leave the country - about a quarter of the pre-famine population. In the United States, most of the recently arrived Irish became city dwellers as that was where work was. In addition, arriving with little money, many settled in the cities at which their ships made port. By 1850, the Irish made up a quarter of the population in Boston, New York City, Philadelphia, and Baltimore. Their arrival in the United States before other waves of Catholic immigrants meant that ethnic Irish long dominated the Roman Catholic Church in America. They created a strong network of churches and parochial schools to support their communities.
The Irish have long played a significant role in city politics, the Roman Catholic Church, and the New York City Fire Department and Police Department. As of the 2000 census, 520,810 New Yorkers reported Irish ancestry.[109]
According to a 2006 genetic survey by Trinity College in Dublin, Ireland, about one in 50 New Yorkers of European origin carry a distinctive genetic signature on their Y chromosomes inherited from Niall of the Nine Hostages, an Irish high king of the 5th century A.D.[110]
- Hell's Kitchen, Manhattan
- Woodlawn, Bronx
- Woodside, Queens
- Maspeth, Queens
- Sunnyside, Queens
- North Riverdale, Bronx
- Riverdale, Bronx
- Bay Ridge, Brooklyn
- Marine Park, Brooklyn
- Gerritsen Beach, Brooklyn
- Vinegar Hill, Brooklyn
- Belle Harbor, Queens
- Breezy Point, Queens
- Rockaway Beach, Queens
- Roxbury, Queens
- St. George, Staten Island
- Middle Village, Queens
Italian
New York City has the largest population of Italian Americans in the United States of America as well as North America, many of whom inhabit ethnic enclaves in Brooklyn, the Bronx, Manhattan, Queens, and Staten Island. New York City is home to the third largest Italian population outside of Italy, behind Sao Paulo, Brazil and Buenos Aires, Argentina, respectively.
The largest wave of Italian immigration to the United States took place in the late 19th century and early 20th century. Between 1820 and 1978, 5.3 million Italians immigrated to the United States, including over two million between 1900 and 1910. Only the Irish and Germans immigrated in larger numbers. Italian families first settled in Little Italy's neighborhoods, the first and most famous one being the one around Mulberry Street, in Manhattan. This settlement, however, is rapidly becoming part of the adjacent Chinatown as the older Italian residents die and their children move elsewhere. As of the 2000 census, 692,739 New Yorkers reported Italian ancestry, making them the largest European ethnic group in the city.[111] In 2011, the American Community Survey found there were 49,075 persons of Italian birth in New York City.[112]
- Arthur Avenue (the Bronx's Little Italy)
- Bensonhurst, Brooklyn (Brooklyn's Little Italy)
- Bergen Beach, Brooklyn
- Morris Park, Bronx
- Pelham Bay, Bronx
- Cobble Hill, Brooklyn
- Carroll Gardens, Brooklyn
- Dyker Heights, Brooklyn
- Bay Ridge, Brooklyn
- Williamsburg, Brooklyn
- East Village, Manhattan
- Greenwich Village, Manhattan
- Mulberry Street (Manhattan's Little Italy)
- Pleasant Avenue, East Harlem (Italian Harlem), Manhattan
- Howard Beach, Queens
- Ozone Park, Queens
- Staten Island
- Mill Basin, Brooklyn
- Middle Village, Queens
- Whitestone, Queens
Polish
Polish immigration to New York City began at the end of the 20th century. In the 1980s, as a result of the Polish government's crackdown on the burgeoning Solidarność labor and political movement, Polish migration to the U.S. swelled. Polish-Americans and Polish immigrants in the city generally reside in Brooklyn (neighborhoods of Greenpoint and Williamsburg) and in Queens (neighborhoods of Maspeth and Ridgewood). The combined neighborhood of Greenpoint/Williamsburg is sometimes referred to as "Little Poland" because of its large population of primarily working-class Polish immigrants, reportedly the second largest concentration in the United States, after Chicago. As of the 2000 census, 213,447 New Yorkers reported Polish ancestry.[113]
New York is home to a number of Polish and Polish-American cultural, community, and scientific institutions, including the Polish Institute of Arts and Sciences of America (PIASA) and the Polish Cultural Institute. Polish-language publications with circulation reaching outside the city include The Polish Review, an English-language scholarly journal published since 1956 by PIASA; Nowy Dziennik , founded in 1971; and Polska Gazeta , founded in the year 2000. The Polska Gazeta is the leading Polish-language daily newspaper in the tri-state area, delivering daily news to over 17,000 readers in New York, New Jersey, Connecticut, Pennsylvania, Long Island and Delaware. The Polish Newspaper SuperExpress , covering New York, New Jersey & Connecticut started publication in 1996.
The Pulaski Day Parade in New York on Fifth Avenue has been celebrated since 1937 to commemorate Kazimierz Pułaski, a Polish hero of the American Revolutionary War. It closely coincides with the October 11 General Pulaski Memorial Day, a national observance of his death at the Siege of Savannah, and his held on the first Sunday of October. In these parades march Polish dancers, Polish soccer teams and their mascots, Polish Scouts - ZHP and Polish school ambassadors and representatives, such as Mikolaj Pastorino (Nicholas Pastorino) and Lech Wałęsa. The Pulaski Day Parade is one of the largest parades in New York City.
Romanian
The Romanian community of New York City is the largest such community in North America. The 2000 Census reported 161,900 Romanians were living in New York City. They are mainly concentrated in Queens, as well as in parts of Manhattan and Staten Island. The Romanian Day Festival, for which the City closes a section of Broadway, demonstrates the strong sense of community of Romanians living in New York.
Russian
New York City contains a very large and growing Russian-Jewish population estimated at around 300,000. There are large numbers of Russian-Jews in Brooklyn, mostly in neighborhoods of Southern Brooklyn, notably Brighton Beach, also known as "Little Odessa", where there are many businesses and billboards with signage entirely in the Russian language. There is a significant Russian Orthodox population in New York City as well.
Ukrainian
New York City contains a large and growing Ukrainian population. New York's Ukrainian population was traditionally centered around the East Village in Manhattan, as well as Brighton Beach (also known as "Little Odessa"), in Brooklyn. Urban flight and recent waves of new immigration have spread Ukrainians throughout the boroughs, with a heavy concentration in Brooklyn.
Jewish
The New York metropolitan area is home to the largest Jewish population in the world outside Israel. While most are descendants of Jews who moved from Europe, a growing number are of Asian and Middle Eastern origin. After dropping from a peak of 2.5 million in the 1950s to a low of 1.4 million in 2002 the population of Jews in the New York metropolitan area grew to 1.54 million in 2011. A study by the UJA-Federation of New York released in 2012[114] showed that the proportion of liberal Jews was decreasing while the proportion of generally conservative Orthodox Jews and recent immigrants from Russia was increasing. Much of this growth is in Brooklyn, which in 2012 was 23% Jewish and where most of the Russian immigrants live and nearly all of the ultra-orthodox.[115] The study by UJA-Federation of New York has been criticized by J.J. Goldberg, an observer at The Jewish Daily Forward, as excluding suburban Jews, for example in New Jersey, that are outside the service area of UJA-Federation of New York and also for lack of granularity with respect to the Orthodox of New York City.[116] The New York metropolitan area's Jewish population in 2001 was approximately 1.97 million, 600,000 fewer than in Israel's largest metropolitan area, denoted as Gush Dan. In 2012, an estimated 1,086,000 Ashkenazic Jews lived in New York City and constituted about 12% of the city's population, while approximately 100,000 Sephardic Jews live in the city too. New York City is also home to the world headquarters of the Hasidic Chabad-Lubavitch group and the Bobover, Pupa, Vizhnitz and Satmar branches of Hasidism, ultra-Orthodox sects of Judaism.
The first Jewish presence in New York City dates to the arrival of 23 Jewish refugees in 1654, who fled from Recife, Brazil, after the Portuguese conquered New Holland and brought the Inquisition with them.[117] Major immigration of Jews to New York began in the 1880s, with the increase of Anti-Semitic actions in Central and Eastern Europe. The number of Jews in New York City soared throughout the beginning of the 20th century and reached a peak of 2 million in the 1950s, when Jews constituted one-quarter of the city's population. New York City's Jewish population then began to decline because of low fertility rates and migration to suburbs and other states, particularly California and Florida.
A new wave of Ashkenazi, Kavkazi, Bukharian, and Georgian Jewish immigrants from the former Soviet Union began arriving in the 1980s and 1990s. Sephardic Jews including Syrian, Moroccan and other Jews of non-European origin have also lived in New York City since the 17th century. Many Jews, including the newer immigrants, have settled in Queens, south Brooklyn, and the Bronx, where at present most live in neighborhoods such as Riverdale. Sephardic Jews estimated at 100,000 strong have settled along Ocean Parkway in Brooklyn creating a unified community consisting of about 75,000 people in this area, while the other Sephardic Jews live in the Upper East Side of Manhattan and in Staten Island.
19th-century Jewish immigrants settled mainly in the tenement houses of the Lower East Side of Manhattan. New York City's current Jewish population is dispersed among all the boroughs; Brooklyn's Jewish population in 2011 was estimated as 561,000, and Manhattan's was 240,000.[118]
The Orthodox community is rapidly growing due to higher birthrates among Orthodox (especially Hasidic) Jews, while the numbers of Conservative and Reform Jews are declining.[119] 60% of the Jewish children in New York are Orthodox, 37% Hasidic. This accelerating dynamic is accompanied by a substantial rise in the percentage of Jews who live in poverty.[115]
Like the Irish and Italian, the Jewish community has played an important role in recent New York City politics; Jewish voters traditionally vote in large numbers and have often supported politically liberal policies. As the proportion of liberal Conservative and Reform Jews decreases and that of conservative Russian and Orthodox Jews increases in the 21st Century the political interests of New York Jews are changing. The Russian immigrants have shown a tendency to vote Republican while the ultra-orthodox are social conservatives who have a pressing need for supportive social services. There is little support among either group for the liberal community institutions which have been built by the liberal Jewish community. A significant portion of the rapidly growing Hasidic community is pro-Israel and supports the Israeli Settlement Movement.
Latin American
Puerto Rican
New York City has the largest Puerto Rican population outside of Puerto Rico. Attributable to the changing citizenship status of the island's residents, Puerto Ricans, can technically be said to have come to the City first as immigrants and subsequently as migrants. The first group of Puerto Ricans moved to New York in the mid-19th century, when Puerto Rico was a Spanish colony and its people Spanish subjects. The following wave of Puerto Ricans to move to New York did so after the Spanish–American War of 1898 made Puerto Rico a U.S. possession and after the Jones–Shafroth Act of 1917 gave Puerto Ricans U.S. citizenship, which allows travel without the need of a passport between the island and the United States mainland. The largest wave of migration came in the 1950s, in what became known as "The Great Migration"; as a result, more than a million Puerto Ricans once called New York City home. Presently the Puerto Rican population is around 800,000.
Puerto Ricans have historically lived in neighborhoods such as the Lower East Side (also known in the community as Loisaida), Spanish Harlem and Williamsburg, Brooklyn since the 1950s. However, there has been an increase in Puerto Ricans in outlying areas of the city, such as the North Shore of Staten Island, and the eastern Bronx.
Dominican
Immigration records of Dominicans in the United States date from the late 19th century, and New York City has had a Dominican community since the 1930s. From the 1960s onward, after the fall of the Rafael Trujillo military regime, large waves of migration have thoroughly transnationalized the Dominican Republic, metaphorically blurring its frontier with the United States.
In 2006 New York City's Dominican population decreased for the first time since the 1980s, dropping by 1.3% from 609,885 in 2006 to 602,093 in 2007. They are the city's second-largest Hispanic group and, in 2009, it was estimated that they composed 24.9% of New York City's Latino population. According to Census data analysis by CUNY’s Center for Latin American, Caribbean & Latino Studies, shows Dominicans as the new largest group of Hispanics in NYC. There were about 747,473 Dominicans in the five boroughs in 2013, compared with 719,444 Puerto Ricans.[120]
Areas with high a concentration of Dominicans are in Washington Heights, Corona, and certain areas in the Bronx.
Mexican
At the 2010 Census, there were 457,288 Mexican Americans living in New York City.[121] In 2009, it was estimated that of the city's Hispanic population, 13.5% was of Mexican origin.[120] Mexicans are the fastest growing group of Hispanic population.[78] Some estimates suggest that Mexicans will surpass both Puerto Ricans and Dominicans in 2023 to become the city’s largest national Latino sub-group.[120] As of 2011, the Mexican Consulate estimated about 500,000 Mexicans lived in New York City, of whom 35,000 spoke a Mexican indigenous language.[122]
Ecuadorian
In 2009, it was estimated that 211,378 Ecuadorian Americans lived in New York City, representing 8.9% of the city's Hispanic population. They are the fourth largest sub-group of Hispanics, after Puerto Ricans, Dominicans and Mexicans.[120]
Colombian
Colombians have come in small numbers to New York City since the 1960s. The major exodus of Colombians from Colombia came in the early 1980s when many of Colombia's cities were facing hardships from drug traffickers, crime and lack of employment. 75% of Colombians in New York City live in Queens, specifically in Jackson Heights, Corona, Elmhurst and Murray Hill.[123]
Salvadoran
Since 1990, the Salvadoran population has been growing very rapidly in New York City. More than 50% of Salvadorans live in Queens, and the growth of their population is most notable in South Jamaica and Far Rockaway. Many Salvadorans reside in the Bronx as well. There are also pockets of Salvadorans in Brooklyn and in East Harlem, Manhattan.
See also
- Demographics of the Bronx
- Demographics of Brooklyn
- Demographics of Manhattan
- Demographics of Queens
- Demographics of Staten Island
- Illegal immigration to New York City
- New York City ethnic enclaves
References
- ↑ "Current Population Estimates: NYC". NYC.gov. Retrieved December 6, 2016.
- ↑ Ian Gordon; Tony Travers; Christine Whitehead; London School of Economics; Political Science (July 2007). "The Impact of Recent Immigration on the London Economy" (PDF). The City of London Corporation. Retrieved September 8, 2013.
- ↑ "Annual Estimates of the Resident Population for Incorporated Places of 50,000 or More, Ranked by July 1, 2014 Population: April 1, 2010 to July 1, 2014 - United States -- Places of 50,000+ Population - 2014 Population Estimates". United States Census Bureau. Retrieved May 23, 2015.
- ↑ "Yearbook of Immigration Statistics: 2012 Supplemental Table 2". U.S. Department of Homeland Security. Retrieved April 2, 2013.
- ↑ "Yearbook of Immigration Statistics: 2011 Supplemental Table 2". U.S. Department of Homeland Security. Retrieved April 2, 2013.
- ↑ "Yearbook of Immigration Statistics: 2010 Supplemental Table 2". U.S. Department of Homeland Security. Retrieved April 2, 2013.
- ↑ "Yearbook of Immigration Statistics: 2009 Supplemental Table 2". U.S. Department of Homeland Security. Retrieved April 2, 2013.
- ↑ "Endangered Language Alliance". 2012. Retrieved September 7, 2013.
- 1 2 "Linguistics- Say what?". The Economist. September 10, 2011. Retrieved October 24, 2013.
- ↑ N. R. Kleinfield (January 15, 2016). "New Yorkers, Self-Assured and Opinionated, Defend Their Values". The New York Times on MSN. Retrieved January 15, 2016.
- ↑ Mark Turin (August 9, 2013). "The World's Most Linguistically Diverse Location? New York City". PopAnth. Retrieved May 2, 2015.
- ↑ Roberts, Sam (April 28, 2010). "Listening to (and Saving) the World's Languages". The New York Times. Retrieved December 1, 2012.
- ↑ Greene and Harrington (1932). American Population Before the Federal Census of 1790. New York., as cited in: Rosenwaike, Ira (1972). Population History of New York City. Syracuse, N.Y.: Syracuse University Press. p. 8. ISBN 0-8156-2155-8.
- ↑ Gibson, Campbell.Population of the 100 Largest Cities and Other Urban Places in the United States:1790 to 1990, United States Census Bureau, June 1998. Retrieved June 12, 2007.
- 1 2 3 "Table PL-P1 NYC: Total Population New York City and Boroughs, 2000 and 2010" (PDF). nyc.gov. Retrieved 16 May 2016.
- 1 2 "Annual Estimates of the Resident Population: April 1, 2010 to July 1, 2014 - 2014 Population Estimates". United States Census Bureau. Retrieved May 2, 2015.
- ↑ United States -- Places and (in selected states) County Subdivisions with 50,000 or More Population; and for Puerto Rico, United States Census Bureau United States Census, 2000. Accessed June 12, 2007.
- ↑ "Population Density", Geographic Information Systems - GIS of Interest. Accessed May 17, 2007. "What I discovered is that out of the 3140 counties listed in the Census population data only 178 counties were calculated to have a population density over one person per acre. Not surprisingly, New York County (which contains Manhattan) had the highest population density with a calculated 104.218 persons per acre."
- 1 2 3 "Census 2000 Data for the State of New York". U.S. Census Bureau. Retrieved July 19, 2006.
- 1 2 New York City Department of City Planning (2005). "The Newest New Yorkers: 2000" (PDF). Retrieved March 27, 2007.
- ↑ "Appendix Table 5-4: Ten Largest Sources of the Foreign-Born by County New York Metropolitan Region, 2000" (PDF). New York City Department of City Planning. 2005. Retrieved March 26, 2007.
- ↑ "World Jewish Population". SimpleToRemember.com – Judaism Online. Retrieved May 12, 2011.
- ↑ "New York-Newark-Bridgeport, NY-NJ-CT-PA CSA ACS Demographic and Housing Estimates: 2009". U.S. Census Bureau. Retrieved May 12, 2011.
- ↑ "United States ACS Demographic and Housing Estimates: 2009". U.S. Census Bureau. Retrieved May 12, 2011.
- ↑ Kirk Semple (June 23, 2011). "Asian New Yorkers Seek Power to Match Numbers". The New York Times Company. Retrieved July 5, 2011.
- ↑ "New York-Newark-Bridgeport, NY-NJ-CT-PA Combined Statistical Area ACS Demographic and Housing Estimates: 2008". Retrieved April 17, 2010.
- ↑ Kirk Semple (June 23, 2011). "Asian New Yorkers Seek Power to Match Numbers". The New York Times Company. Retrieved July 5, 2011.
Asians, a group more commonly associated with the West Coast, are surging in New York, where they have long been eclipsed in the city’s kaleidoscopic racial and ethnic mix. For the first time, according to census figures released in the spring, their numbers have topped one million — nearly 1 in 8 New Yorkers — which is more than the Asian population in the cities of San Francisco and Los Angeles combined.
- ↑ "Asian American Statistics". © 2011 Améredia Incorporated. Retrieved July 5, 2011.
- ↑ "Table SF1-P9 NYC: Total Asian Population by Selected Subgroups" (PDF). NYC.gov. Retrieved August 27, 2011.
- ↑ "NYC2005 — Results from the 2005 American Community Survey: Socioeconomic Characteristics by Race/Hispanic Origin and Ancestry Group" (PDF). New York City Department of City Planning. 2005. Retrieved August 14, 2007.
- ↑ "Population - New York City Department of City Planning". nyc.gov.
- ↑ Archive of the Mayor's Press Office, Mayor Giuliani Proclaims Puerto Rican Week in New York City, Tuesday, June 9, 1998.
- ↑ Roberts, Sam (April 9, 2005). "In Manhattan, Poor Make 2 Cents for Each Dollar to the Rich". The New York Times. Retrieved March 27, 2007.
- 1 2 3 "Average Weekly Wage in Manhattan at $1,453 in Second Quarter 2006" (PDF). Bureau of Labor Statistics, U.S. Department of Labor. February 20, 2007. Retrieved February 21, 2007.
- ↑ Roberts, Sam (March 27, 2007). "In Surge in Manhattan Toddlers, Rich White Families Lead Way". The New York Times. Retrieved March 27, 2007.
- ↑ U.S. Census Bureau, Statistical Abstract of the United States, 2003 (page 617), Table 957: Housing Units and Tenure for Large Cities: 2000
- ↑ Housing Vacancy Survey
- ↑ New York City Department of City Planning (December 2006). "New York City Population Projections by Age/Sex and Borough, 2000-2030" (PDF). Retrieved March 27, 2007. See also Roberts, Sam (February 19, 2006). "By 2025, Planners See a Million New Stories in the Crowded City". New York Times. Retrieved July 19, 2006.
- ↑ New York City Department of Health and Mental Hygiene (April 21, 2003). "Summary of Vital Statistics" (PDF). Retrieved April 21, 2007.
- ↑ "Chicago (city), Illinois". State & County QuickFacts. U.S. Census Bureau.
- ↑ For cities with more than 200,000 residents."G.I.S. Lounge U.S. Population Density, 2000 Census". GiS Lounge. Retrieved January 29, 2006.
- ↑ Harris Interactive (September 11, 2005). "California and New York City Most Popular Places People would choose to Live". Retrieved March 2, 2007.
- ↑ New York City Department of City Planning (2005). "Appendix Table 5-4: Ten Largest Sources of the Foreign-Born by County New York Metropolitan Region, 2000" (PDF). Retrieved March 26, 2007.
- ↑ New York City Department of City Planning (2000). "2000 Census" (PDF). Retrieved May 24, 2007.
- ↑ The New York Observer: Beveridge Fizzy On Future
- ↑ 2006 American Community Survey: New York City
- ↑ "More Foreign-Born Immigrants Live In NYC Than There Are People In Chicago". Huffington Post. December 19, 2013. Retrieved February 25, 2015.
- ↑ "Yahoo". Yahoo.
- ↑ http://www.washington-heights.us/history/archives/native_american_life_in_washington_heights_and_inwood_135.html
- ↑ google.com Encyclopedia of New York City: Second Edition https://books.google.com/books?id=lI5ERUmHf3YC&pg=PT937&dq=bulgarian+population+new+york&hl=en&sa=X&ved=0ahUKEwj7ztGE_PvMAhVH3GMKHYFYBS0Q6AEIHDAA#v=onepage&q=bulgarian%20population%20new%20york&f=falsetitle=The Encyclopedia of New York City: Second Edition Check
|url=value (help). Missing or empty|title=(help) - ↑ American Community Survey 2007-2009
- ↑ "Page Not Found" (PDF). cuny.edu.
- ↑ American FactFinder
- 1 2 American Community Survey 2007–2009
- ↑ "Claritas Study Ranks Racial/Ethnic Diversity in Counties Nationwide; Analysis Shows California Leads Nation In Diversity Among Counties Of 100,000-Plus Population". Business Wire. July 23, 2001.
- ↑ Roberts, Sam (January 10, 2006). "Black Incomes Surpass Whites in Queens". The New York Times. Retrieved March 28, 2007.
- ↑ "Jewish Community Study of New York" (PDF). United Jewish Appeal-Federation of New York. 2002. Retrieved March 26, 2007.
- ↑ Asian American Federation of New York (2004). "Census Profile:New York City's Indian American Population" (PDF). Retrieved March 28, 2007.
- ↑ "The Newest New Yorkers: 2000" (PDF). New York City Department of City Planning. 2005. Retrieved May 5, 2007.
- ↑ "U.S. Census Bureau Census 2000". Retrieved March 21, 2010.
- ↑ "The Association of Religion Data Archives (ARDA), Year 2000 Report". 2000. Retrieved March 21, 2010. Churches were asked for their membership numbers. ARDA estimates that most of the churches not reporting were black Protestant congregations.
- ↑ Roberts, Sam (March 27, 2007). "In Surge in Manhattan Toddlers, Rich White Families Lead Way". The New York Times. Retrieved March 27, 2007.
- ↑ Roberts, Sam (April 9, 2005). "In Manhattan, Poor Make 2 Cents for Each Dollar to the Rich". The New York Times. Retrieved March 27, 2007.
- ↑ Roberts, Sam (July 20, 2007). "Women are Winners". The New York Times. Retrieved May 1, 2010.
- 1 2 billion "David Koch Tops 70 N.Y. Billionaires on Forbes List; Conn. Has 11" Check
|url=value (help). March 5, 2013. - ↑ "Bloomberg Billionaires". April 9, 2013.
- ↑ New York Magazine (November 6, 2006). "Mind the Income Gap". Retrieved November 8, 2006.
- 1 2 Major U.S. metropolitan areas differ in their religious profiles, Pew Research Center, Accessed July 30, 2015.
- ↑ "World Jewish Population". SimpleToRemember.com – Judaism Online. Retrieved September 2, 2012.
- ↑ "Jewish Community Study of New York: 2011 Comprehensive Report" (PDF). UJA-Federation of New York. Retrieved August 13, 2014.
- ↑ "Religious Landscape Study: New York City Metro Area" Pew Research Center
- ↑ New York City Department of City Planning: NYC Population Projections by Age/Sex and Borough, 2000-2030
- ↑ NYC To File Formal Challenge to 2010 Census under Count Question Resolution Process
- ↑ "Mike Bloomberg - On the 2010 Census Results". MikeBloomberg.com.
- ↑ U.S. Census Bureau, Population Division, Table 5. Annual Estimates of the Resident Population for Minor Civil Divisions in New York, Listed Alphabetically Within County: April 1, 2000 to July 1, 2009 (SUB-EST2009-05-36) and Table 1. Annual Estimates of the Resident Population for Incorporated Places Over 100,000, Ranked by July 1, 2009 Population: April 1, 2000 to July 1, 2009 (SUB-EST2009-01), Release Date: June 2010, retrieved on July 31, 2010
- ↑ Forstall, Richard L., Population of States and Counties of the United States: 1790 to 1990, U.S. Bureau of the Census, Washington, DC, 1996 ISBN 0-934213-48-8, (Part III, Kentucky to Oklahoma) retrieved April 3, 2011; see also the author's introduction and general notes
- ↑ "Population", article by Jane Allen with tables by Nathan Kantrowitz in The Encyclopedia of New York City, edited by Kenneth T. Jackson, New-York Historical Society & Yale University Press, 1995, pages 910-914, ISBN 0-300-05536-6
- 1 2 "New York city, New York QuickLinks". U.S. Census Bureau. Retrieved December 1, 2013.
- ↑ The New York Times (April 3, 2006). "New York City Losing Blacks, Census Shows". Retrieved April 4, 2006.
- ↑ The New York Times (October 1, 2006). "Black Incomes Surpass Whites in Queens". Retrieved October 1, 2006.
- ↑ "ACS DEMOGRAPHIC AND HOUSING ESTIMATES 2012 American Community Survey 1-Year Estimates New York-Newark-Bridgeport, NY-NJ-CT-PA CSA". U.S. Census Bureau. Retrieved October 27, 2013.
- ↑ Lawrence A. McGlinn, Department of Geography SUNY-New Paltz. "BEYOND CHINATOWN: DUAL IMMIGRATION AND THE CHINESE POPULATION OF METROPOLITAN NEW YORK CITY, 2000, Page 6" (PDF). Middle States Geographer, 2002, 35: 110-119, Journal of the Middle States Division of the Association of American Geographers. Retrieved June 27, 2012.
- ↑ Waxman, Sarah. "The History of New York's Chinatown". ny.com. Retrieved May 4, 2009.
- 1 2 "Profile of New York City's Filipino Americans: 2013 Edition" (PDF). Asian American Federation. 2013. Retrieved December 8, 2014.
- ↑ Marquez, Liaa (January 19, 2011). "Little Manila rises in New York City's Queens borough". GMA News. Retrieved December 23, 2014.
Previously an Irish neighborhood, Woodside has grown to be one of the most diverse areas in the city. Amid Mexican-, Indian-, and Korean-owned stores lies a hefty sampling of the Philippines. The area now serves as home to the rising population of Filipinos in the city.
- ↑ Noel Pangilinan (February 5, 2013). "Who are the people in your neighborhood? NYC immigrants by the numbers". ImmigraNation.com, reprinted from Queens7.com. Retrieved December 23, 2014.
- ↑ Greenstreet Highlights : NYC Parks. Accessed December 13, 2014.
- ↑ "ACS DEMOGRAPHIC AND HOUSING ESTIMATES - 2013 American Community Survey 1-Year Estimates". United States Census Bureau. Retrieved December 23, 2014.
- ↑ "SELECTED POPULATION PROFILE IN THE UNITED STATES 2013 American Community Survey 1-Year Estimates". United States Census Bureau. Retrieved December 9, 2014.
- ↑ Sierra Stoney; Jeanne Batalova (June 5, 2013). "Filipino Immigrants in the United States". Migration Policy Institute. Retrieved December 9, 2014.
- ↑ "SELECTED POPULATION PROFILE IN THE UNITED STATES 2012 American Community Survey 1-Year Estimates". United States Census Bureau. Retrieved December 9, 2014.
- ↑ "ACS DEMOGRAPHIC AND HOUSING ESTIMATES more information 2011 American Community Survey 1-Year Estimates, Geographies New York City, New York and Queens County, New York". Retrieved September 10, 2013.
- ↑ "Profile of General Population and Housing Characteristics: 2010 Demographic Profile Data New York-Newark-Bridgeport, NY-NJ-CT-PA CSA". U.S. Census Bureau. Retrieved September 10, 2013.
- ↑ Chi-Hoon Kim (2015). "Savoring Gotham: A Food Lover's Companion to New York City: A Food Lover's...". Oxford University Press, Google Books. Retrieved October 11, 2015.
- ↑ Asian American Federation of New York (2004). "Census Profile:New York City's Indian American Population" (PDF). Retrieved March 28, 2007. Asian American Federation of New York (2004). "Census Profile:New York City's Pakistani American Population" (PDF). Retrieved April 21, 2007.
- ↑ "Total Asian Population by Selected Subgroups" (PDF).
- ↑ "Yearbook of Immigration Statistics: 2010 Supplemental Table 2". U.S. Department of Homeland Security. Retrieved June 7, 2011.
- ↑ Harrison Peck. "NYC The Official Guide - Must-See Little Sri Lanka: 7 Great Things to See and Do". © 2006–2011 NYC & Company, Inc. All rights reserved. Retrieved November 27, 2011.
- ↑ Amy Zavatto (August 5, 2010). "Frommer's - New York City: Exploring Staten Island's Little Sri Lanka". © 2000-2011 by John Wiley & Sons, Inc. All rights reserved. Retrieved November 27, 2011.
- ↑ Robertson, Creg. "Japanese." In: Eisenstadt, Peter R. and Laura-Eve Moss (editors). The Encyclopedia of New York State. Syracuse University Press, 2005. ISBN 081560808X, 9780815608080. p. 808.
- 1 2 3 Caratzas, Michael D. "{Former} St. George's Syrian Church Designation Report" New York City Landmarks Preservation Commission (July 14, 2009)
- ↑ Benson, Kathleen., Kayal, Philip M. A Community of Many Worlds: Arab Americans in New York City. Museum of the City of New York/Syracuse University Press. New York, 2002. Page 3
- ↑ Benson, Kathleen., Kayal, Philip M. A Community of Many Worlds: Arab Americans in New York City. Museum of the City of New York/Syracuse University Press. New York, 2002. Page 12
- ↑ Benson, Kathleen., Kayal, Philip M. A Community of Many Worlds: Arab Americans in New York City. Museum of the City of New York/Syracuse University Press. New York, 2002. Page 24
- ↑ http://aai.3cdn.net/9298c231f3a79e30c6_g7m6bx9hs.pdf Arab American Population Highlights Arab American Institute Foundation
- ↑ "The Arab Population in the U.S.". jewishvirtuallibrary.org.
- ↑ "NewsMax Archives". newsmax.com.
- ↑ New York City Department of City Planning (2000). "2000 Census" (PDF). Retrieved May 24, 2007.
- ↑ New York City Department of City Planning (2000). "2000 Census" (PDF). Retrieved May 24, 2007.
- ↑ Moore, Laoise T.; McEvoy, B; Cape, E; Simms, K; Bradley, DG (February 2006). "A Y-Chromosome Signature of Hegemony in Gaelic Ireland". The American Journal of Human Genetics. 78 (2): 334–338. doi:10.1086/500055. PMC 1380239
 . PMID 16358217. See also Wade, Nicholas (January 18, 2006). "If Irish Claim Nobility, Science May Approve". New York Times. Retrieved July 16, 2006.
 - ↑ New York City Department of City Planning (2000). "2000 Census" (PDF). Retrieved May 24, 2007.
- ↑ New York City Department of City Planning, "The Newest New Yorkers - Characteristics of the City's Foreign Born Population", 2013
- ↑ New York City Department of City Planning (2000). "2000 Census" (PDF). Retrieved May 24, 2007.
- ↑ Steven M. Cohen, Jacob B. Ukeles, Ron Miller (June 2012). "Jewish Community Study of New York: 2011". UJA-Federation of New York. Retrieved June 14, 2012.
- 1 2 Josh Nathan-Kazis (June 14, 2012, issue of June 22, 2012). "Changing Face of New York Jewry: Led by Orthodox, Population Grows and Shifts Dramatically". The Jewish Daily Forward. Retrieved June 14, 2012. Check date values in:
|date=(help) - ↑ J.J. Goldberg (June 15, 2012, issue of June 22, 2012). "Time To Rethink the New York Jew Study Leaves Out Suburbs and Ignores Splits Among Orthodox". Jewish Daily Forward. Retrieved June 16, 2012. Check date values in:
|date=(help) - ↑ Kritzler, Edward. "Jewish Pirates of the Caribbean." Random House Digital, Inc. p. 148
- ↑ Simone Weichselbaum (June 26, 2012). "Nearly one in four Brooklyn residents are Jews, new study finds". New York Daily News. Retrieved September 5, 2013.
- ↑ http://www.ujafedny.org/assets/documents/PDF/who-we-are/community-study-02/JCommStudyConnections.pdf
- 1 2 3 4 Bergad, Laird W (April 2011). The Latino Population of New York City 2009 (PDF). Latino Data Project. Center for Latin American, Caribbean & Latino Studies. Retrieved February 10, 2013.
- ↑ http://www.nyc.gov/html/dcp/pdf/census/census2010/t_sf1_p8_nyc.pdf
- ↑ Claudio Torrens (May 28, 2011). "Some NY immigrants cite lack of Spanish as barrier". UTSanDiego.com. Retrieved February 10, 2013.
- ↑ (Pages 12 & 61)
External links
| ||
| ||