Demographics of Massachusetts
Massachusetts had an estimated 2014 population of 6.745 million.[1] As of 2007, Massachusetts is estimated to be the third most densely populated U.S. state, with 822.7 per square mile, after New Jersey and Rhode Island, and ahead of Connecticut and Maryland.
| Historical population | |||
|---|---|---|---|
| Census | Pop. | %± | |
| 1790 | 378,787 | — | |
| 1800 | 422,845 | 11.6% | |
| 1810 | 472,040 | 11.6% | |
| 1820 | 523,287 | 10.9% | |
| 1830 | 610,408 | 16.6% | |
| 1840 | 737,699 | 20.9% | |
| 1850 | 994,514 | 34.8% | |
| 1860 | 1,231,066 | 23.8% | |
| 1870 | 1,457,351 | 18.4% | |
| 1880 | 1,783,085 | 22.4% | |
| 1890 | 2,238,947 | 25.6% | |
| 1900 | 2,805,346 | 25.3% | |
| 1910 | 3,366,416 | 20.0% | |
| 1920 | 3,852,356 | 14.4% | |
| 1930 | 4,249,614 | 10.3% | |
| 1940 | 4,316,721 | 1.6% | |
| 1950 | 4,690,514 | 8.7% | |
| 1960 | 5,148,578 | 9.8% | |
| 1970 | 5,689,170 | 10.5% | |
| 1980 | 5,737,037 | 0.8% | |
| 1990 | 6,016,425 | 4.9% | |
| 2000 | 6,349,097 | 5.5% | |
| 2010 | 6,547,629 | 3.1% | |
| Sources:[1][2][3] | |||
Massachusetts has seen both population increases and decreases in recent years. For example, while some Bay Staters are leaving, others including European, Asian, Hispanic and African immigrants, arrive to replace them. Massachusetts in 2004 included 881,400 foreign-born residents.
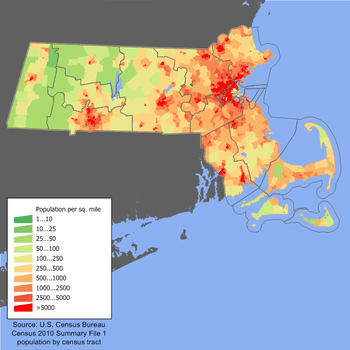
Most Bay Staters live within a 60 mile radius of the State House on Beacon Hill, often called Greater Boston: the City of Boston, neighboring cities and towns, the North Shore, South Shore, the northern, western, and southern suburbs, and most of southeastern and central Massachusetts. Eastern Massachusetts is more urban than Western Massachusetts, which is primarily rural, save for the cities of Springfield, Chicopee, Holyoke and Northampton, which serve as centers of population density in the Pioneer Valley of the Connecticut River. The center of population of Massachusetts is located in Middlesex County, in the town of Natick.[4]
Race, ethnicity, and ancestry
The largest ancestry groups are:[5]
-
 22.8% Irish
 -
 13.9% Italian
 -
 10.7% English
 -
 7.8% French
 -
 6.4% German
 -
 5.0% Polish
 -
 4.7% Portuguese
 -
 4.4% American
 -
 4.1% Puerto Rican
 -
 3.8% French Canadian
 -
 2.4% Scottish
 -
 2.0% Chinese
 -
 1.9% Russian
 -
 1.8% West Indian
 -
 1.8% Sub-Saharan African
 -
 1.8% Dominican
 -
 1.8% Swedish
 -
 1.2% Greek
 -
 1.1% Asian Indian
 -
 1.1% Arab
The five largest reported ancestries in Massachusetts are Irish (22.8%), Italian (13.9%), French/French Canadian (or Franco-American) (11.6%), English (10.7%), and German (6.4%).
Massachusetts is the most Irish state in the country in percentage of total population. Irish Americans are most concentrated in the eastern and southeastern parts of the state; the South Shore region has an Irish population above 40% (giving it the nickname of the "Irish Riviera") Massachusetts also has large communities of people of Finnish and Swedish descent; Armenian, Lebanese descent; and Italian descent. Other influential ethnicities are Greek Americans, Lithuanian Americans and Polish Americans. Massachusetts "Yankees," of colonial English ancestry, still have a strong presence. French Americans form a significant part of the population in central and northwestern Massachusetts, while Polish Americans are prevalent in the Springfield area and English Americans are common in the rural areas of western Massachusetts.
Boston's largest immigrant groups are Haitians. Fall River and New Bedford on the south coast have large populations of Portuguese, Brazilian, and Cape Verdean heritage, all of which are also prevalent in the Brockton area. There is a growing Brazilian population in the Boston area (especially in Framingham). Lowell, in the northeast of the state, is home to a large Cambodian (Khmer) community, second in the country only to the concentration of Cambodians in Long Beach, California. Massachusetts also has the fastest growing population of South Asians, including Indian people, which are concentrated in certain areas of Greater Boston and outside such as Shrewsbury, Woburn, Malden, Quincy, Somerville, and Cambridge.
Although many of the Native Americans have intermarried with other ethnic groups (or died in King Philip's War of 1675), the Wampanoag tribe maintains reservations at Aquinnah, at Grafton, on Martha's Vineyard, and at Mashpee on Cape Cod.[6][7] The Nipmuck maintain two state-recognized reservations in the central part of the state. Many Wampanoags and other native people live outside of reservations.
| Racial composition | 2013 Est.[8] |
|---|---|
| White | 83.2% |
| White (Non-Hispanic) | 75.1% |
| Hispanic | 10.5% |
| Black | 8.1% |
| Asian | 6.0% |
| Native | 0.5% |
| Other race | 0.1% |
| Two or more races | 2.1% |
| By race | White | Black | AIAN* | Asian | NHPI* |
|---|---|---|---|---|---|
| 2000 (total population) | 89.23% | 6.97% | 0.62% | 4.22% | 0.15% |
| 2000 (Hispanic only) | 5.64% | 1.09% | 0.12% | 0.06% | 0.05% |
| 2005 (total population) | 87.89% | 7.58% | 0.65% | 5.13% | 0.17% |
| 2005 (Hispanic only) | 6.63% | 1.29% | 0.14% | 0.07% | 0.05% |
| Growth 2000–05 (total population) | -0.73% | 9.65% | 4.39% | 22.61% | 13.10% |
| Growth 2000–05 (non-Hispanic only) | -2.03% | 7.84% | 2.72% | 22.74% | 14.37% |
| Growth 2000–05 (Hispanic only) | 18.51% | 19.43% | 11.24% | 13.47% | 10.30% |
| * AIAN is American Indian or Alaskan Native; NHPI is Native Hawaiian or Pacific Islander | |||||
Languages
The most common form of American English spoken in Massachusetts, other than General American English, are the New England accent and the Boston accent.
| Language | Percentage of population (as of 2010)[9] |
|---|---|
| Spanish | 7.50% |
| Portuguese | 2.97% |
| Chinese (including Cantonese and Mandarin) | 1.59% |
| French | 1.11% |
| French Creole | 0.89% |
| Italian | 0.72% |
| Russian | 0.62% |
| Vietnamese | 0.58% |
| Greek | 0.41% |
| Arabic and Cambodian (including Mon-Khmer) (tied) | 0.37% |
As of 2010, 78.93% (4,823,127) of Massachusetts residents age 5 and older spoke English at home as a primary language, while 7.50% (458,256) spoke Spanish, 2.97% (181,437) Portuguese, 1.59% (96,690) Chinese (which includes Cantonese and Mandarin), 1.11% (67,788) French, 0.89% (54,456) French Creole, 0.72% (43,798) Italian, 0.62% (37,865) Russian, and Vietnamese was spoken as a main language by 0.58% (35,283) of the population over the age of five. In total, 21.07% (1,287,419) of Massachusetts's population age 5 and older spoke a mother language other than English.[9]
Religion
As the United States does not collect religious data, it is unknown how many people of each religion live in Massachusetts. Some polls only measure religious adherence of church rather than the whole population. Massachusetts was founded and settled by Puritans in the 17th century. The descendants of the Puritans belong to many different churches; in the direct line of inheritance are the Congregational/United Church of Christ and Unitarian Universalist Association. Both of these denominations are noted for their strong support of social justice, civil rights, and moral issues, including strong and early advocacy of abolition of slavery, women's rights, and (after 2000) legal recognition of same-sex marriage. The headquarters of the Unitarian Universalist Association is located on Beacon Hill in Boston. Today Protestants make up less than 1/4 of the state's population. Roman Catholics now predominate because of massive immigration from Ireland, Quebec, Italy, Poland, Portugal, Puerto Rico, and the Dominican Republic. A large Jewish population came to the Boston area 1880–1920. Many Jews from Eastern Europe have also been immigrating to the Boston area since the fall of Communism. Islam has also been growing in recent years and now numbers between 30,000 and 80,000. Mary Baker Eddy made the Boston Mother Church of Christian Science the world headquarters. Buddhists, Pagans, Hindus, Seventh-day Adventists, and Mormons also can be found. Kripalu and the Insight Meditation Center (Barre) are examples of non-western religious centers in Massachusetts. Bahá'ís are also present.
According to the Association of Religion Data Archives the largest single denominations are the Roman Catholic Church with 3,092,296; the United Church of Christ with 121,826; and the Episcopal Church with 98,963 adherents. Jewish congregations had about 275,000 members.[10]
As of 2001, the religious affiliations of the people of Massachusetts were:[11]
| Religion or Denomination | % of Population |
|---|---|
| Catholic | 44 |
| No Religion | 23 |
| Baptist | 4 |
| Christian (no denomination specified) | 3 |
| Methodist | 2 |
| Lutheran | 1 |
| Presbyterian | 1 |
| Protestant | 4 |
| Pentecostal | 2 |
| Episcopal | 3 |
| Jewish | 1.8 |
| Muslim | 1.2 |
| Church of Christ | 1 |
| Congregational/United Church of Christ | 3 |
| Buddhist | 1 |
| Other | 5 |
Emigration and immigration

The latest (2009) estimated Census population figures show that Massachusetts has grown by over 3 percent, to 6,593,587 since 2000.[1] This slow growth is likely attributable to the fact that Massachusetts continues to attract top scholars and researchers from across the United States as well as large numbers of immigrants, combined with steady emigration away from the state towards New Hampshire and southern and western regions of the U.S. because of high housing costs, weather, and traffic.
Recent census data shows that the number of immigrants living in Massachusetts has increased over 5% from 2000–2005. The biggest influxes are Latin Americans. According to the census, the population of Central Americans rose by 67.7 percent between 2000 and 2005, and the number of South Americans rose by 107.5 percent. And among South Americans, the largest group to increase appeared to be Brazilians, whose numbers rose by 131.4 percent, to 84,836. This surge of immigrants tends to offset emigration, and, of course, given the 350,000 increase in population in the Commonwealth between 1990 and 2000, many immigrants to Massachusetts come from elsewhere in the USA.
Following the shift to a high-tech economy and the numerous factory closures, few jobs remain for low skilled male workers, who are dropping out of the workforce in large numbers. The percentage of men in the labor force fell from 77.7% in 1989 to 72.8% in 2005. This national trend is most pronounced in Massachusetts. In the case of men without high school diplomas, 10% have left the labor force between 1990 and 2000.[12]
References
- 1 2 3 "Annual Estimates of the Resident Population for the United States, Regions, States, and Puerto Rico: April 1, 2000 to July 1, 2009". United States Census Bureau. Archived from the original on January 17, 2010. Retrieved 2009-12-23.
- ↑ "Population: 1790 to 1990" (PDF). (35.4 KB) census.gov
- ↑ Resident Population of the 50 States, the District of Columbia, and Puerto Rico: Census 2000 census.gov
- ↑ Population and Population Centers by State: 2000. United States Census Bureau, United States Deparatment of Commerce. Retrieved January 14, 2007.
- ↑ Data Access and Dissemination Systems (DADS). "American FactFinder - Results". census.gov.
- ↑ Associated Press. Wampanoag Tribe Receives Federal Recognition WBZ-TV, Boston Massachusetts. Retrieved February 20, 2007. Archived September 28, 2007, at the Wayback Machine.
- ↑ Weber, David. Mashpee Wampanoag Indians receive federal recognition The Boston Globe February 15, 2007. Retrieved February 20, 2007.
- ↑ "Massachusetts QuickFacts from the US Census Bureau". census.gov.
- 1 2 "Massachusetts". Modern Language Association. Retrieved August 21, 2013.
- ↑ "Association of Religion Data Archives". Retrieved 13 October 2015.
- ↑ "American Religious Identification Survey". Exhibit 15. The Graduate Center, City University of New York. Archived from the original on October 24, 2005.
- ↑ Article The Boston Globe December 10, 2006, "Bay State's labor force diminishing"
Further reading
- "Blacks' arrival in Massachusetts" (Archive). WGBH-TV. February 26, 1988.
- "Violence against Asian immigrants" (Archive). WGBH-TV. November 19, 1987.
| Wikimedia Commons has media related to Demographics of Massachusetts. |
Boston (capital) | |
| Topics |
|
| Society | |
| Regions | |
| Counties | |
| Cities |
|