Demographics of India
| Demographics of India | |
|---|---|
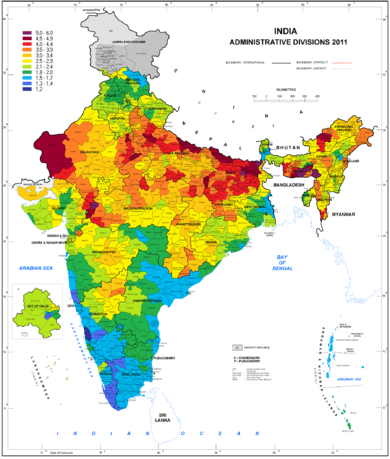
 Map showing the population density of each district in India. | |
| Population | 1,336,286,256 (May 2016 est.)[1] |
| Density | 383 people per.sq.km (2011 est.) |
| Growth rate |
|
| Birth rate | 19.3 births/1,000 population (2016 est.) |
| Death rate | 7.3 deaths/1,000 population (2016 est.) |
| Life expectancy | 68.89 years (2009 est.) |
| • male | 67.46 years (2009 est.) |
| • female | 72.61 years (2009 est.) |
| Fertility rate | 2.3 children born/woman (SRS 2013) |
| Infant mortality rate | 40 deaths/1,000 live births (2013 est.) |
| Age structure | |
| 0–14 years | 31.2% (male 190,075,426/female 172,799,553) (2009 est.) |
| 15–64 years | 63.6% (male 381,446,079/female 359,802,209) (2009 est.) |
| 65 and over | 5.3% (male 29,364,920/female 32,591,030) (2009 est.) |
| Sex ratio | |
| At birth | 1.10 male(s)/female (2013 est.) |
| Under 15 | 1.10 male(s)/female (2009 est.) |
| 15–64 years | 1.06 male(s)/female (2009 est.) |
| 65 and over | 0.90 male(s)/female (2009 est.) |
| Nationality | |
| Major ethnic | See Ethnic Groups of India |
| Language | |
| Official | See Languages of India |


(per 1000 births, under age 1, national average)
India is the second most populous country in the world, with 1,336,286,256 (1.3 billion) people (May 2016),[1][5] nearly a fifth of the world's population. Already containing 18% of the world's population, India is projected to be the world's most populous country by 2022,[6][7] surpassing China, its population reaching 1.7 billion by 2050.[7][8][9] Thus, India is expected to become the first political entity in history to be home to more than 1.5 billion people. Its population growth rate is 1.2%, ranking 94th in the world in 2013.[10] The Indian population had reached the billion mark by 1998.
India has more than 50% of its population below the age of 25 and more than 65% below the age of 35. It is expected that, in 2020, the average age of an Indian will be 29 years, compared to 37 for China and 48 for Japan; and, by 2030, India's dependency ratio should be just over 0.4.[11]
India has more than two thousand ethnic groups,[12] and every major religion is represented, as are four major families of languages (Indo-European, Dravidian, Austroasiatic and Sino-Tibetan languages) as well as two language isolates (the Nihali language[13] spoken in parts of Maharashtra and the Burushaski language spoken in parts of Jammu and Kashmir).
Further complexity is lent by the great variation that occurs across this population on social parameters such as income and education. Only the continent of Africa exceeds the linguistic, genetic and cultural diversity of the nation of India.[14]
The sex ratio is 944 females for 1000 males (2016).[15]
History
It has been estimated that the population was about 100 million in 1600 and remained nearly static until the late 19th century. It reached 255 million according to the first census taken in 1881.[16][17]
Studies of India's population since 1881 have focused on such topics as total population, birth and death rates, growth rates, geographic distribution, literacy, the rural and urban divide, cities of a million, and the three cities with populations over eight million: Delhi, Greater Mumbai (Bombay), and Kolkata (Calcutta).[18]
Mortality rates fell in the period 1920–45, primarily due to biological immunisation. Other factors included rising incomes, better living conditions, improved nutrition, a safer and cleaner environment, and better official health policies and medical care.[19]
Salient features
India occupies 2.41% of the world's land area but supports over 18% of the world's population. At the 2001 census 72.2% of the population[20] lived in about 638,000 villages[21] and the remaining 27.8%[20] lived in more than 5,100 towns and over 380 urban agglomerations.[22]
India's population has exceeded that of the entire continent of Africa by 200 million people.[23] However, because Africa's population growth is nearly double that of India, it is expected to surpass both China and India by 2025.
Comparative demographics
| Category | Global Ranking | References |
|---|---|---|
| Area | 7th | [24] |
| Population | 2nd | [24] |
| Population growth rate | 102nd of 212 | in 2010[25] |
| Population density | 24th of 212 | in 2010[25] |
| Male to Female ratio, at birth | 12th of 214 | in 2009[26] |
List of states and union territories by demographics
| Census Year | Population | Change (%) |
|---|---|---|
| 1951 | 361,088,000 | – |
| 1961 | 439,235,000 | 21.6 |
| 1971 | 548,160,000 | 24.8 |
| 1981 | 683,329,000 | 24.7 |
| 1991 | 846,387,888 | 23.9 |
| 2001 | 1,028,737,436 | 21.5 |
| 2011 | 1,210,726,932 | 17.7 |
| Rank | State/UT | Population[28] | Percent (%) | Male | Female | Sex Ratio | Rural[29] | Urban[29] | Area[30] (km2) | Density (per km2) |
|---|---|---|---|---|---|---|---|---|---|---|
| 1 | Uttar Pradesh | 199,812,341 | 16.50 | 104,480,510 | 95,331,831 | 930 | 155,111,022 | 44,470,455 | 240,928 | 828 |
| 2 | Maharashtra | 112,374,333 | 9.28 | 58,243,056 | 54,131,277 | 929 | 61,545,441 | 50,827,531 | 307,713 | 365 |
| 3 | Bihar | 104,099,452 | 8.60 | 54,278,157 | 49,821,295 | 918 | 92,075,028 | 11,729,609 | 94,163 | 1,102 |
| 4 | West Bengal | 91,276,115 | 7.54 | 46,809,027 | 44,467,088 | 950 | 62,213,676 | 29,134,060 | 88,752 | 1,030 |
| 5 | Madhya Pradesh | 72,626,809 | 6.00 | 37,612,306 | 35,014,503 | 931 | 52,537,899 | 20,059,666 | 308,245 | 236 |
| 6 | Tamil Nadu | 72,147,030 | 5.96 | 36,137,975 | 36,009,055 | 996 | 37,189,229 | 34,949,729 | 130,058 | 555 |
| 7 | Rajasthan | 68,548,437 | 5.66 | 35,550,997 | 32,997,440 | 928 | 51,540,236 | 17,080,776 | 342,239 | 201 |
| 8 | Karnataka | 61,095,297 | 5.05 | 30,966,657 | 30,128,640 | 973 | 37,552,529 | 23,578,175 | 191,791 | 319 |
| 9 | Gujarat | 60,439,692 | 4.99 | 31,491,260 | 28,948,432 | 919 | 34,670,817 | 25,712,811 | 196,024 | 308 |
| 10 | Andhra Pradesh | 49,386,799 | 4.08 | 24,738,068 | 24,648,731 | 996 | 34,776,389 | 14,610,410 | 160,205 | 308 |
| 11 | Odisha | 41,974,218 | 3.47 | 21,212,136 | 20,762,082 | 979 | 34,951,234 | 6,996,124 | 155,707 | 269 |
| 12 | Telangana | 35,193,978 | 2.91 | 17,704,078 | 17,489,900 | 988 | 21,585,313 | 13,608,665 | 114,840 | 307 |
| 13 | Kerala | 33,406,061 | 2.76 | 16,027,412 | 17,378,649 | 1084 | 17,445,506 | 15,932,171 | 38,863 | 859 |
| 14 | Jharkhand | 32,988,134 | 2.72 | 16,930,315 | 16,057,819 | 948 | 25,036,946 | 7,929,292 | 79,714 | 414 |
| 15 | Assam | 31,205,576 | 2.58 | 15,939,443 | 15,266,133 | 958 | 26,780,526 | 4,388,756 | 78,438 | 397 |
| 16 | Punjab | 27,743,338 | 2.29 | 14,639,465 | 13,103,873 | 895 | 17,316,800 | 10,387,436 | 50,362 | 550 |
| 17 | Chhattisgarh | 25,545,198 | 2.11 | 12,832,895 | 12,712,303 | 991 | 19,603,658 | 5,936,538 | 135,191 | 189 |
| 18 | Haryana | 25,351,462 | 2.09 | 13,494,734 | 11,856,728 | 879 | 16,531,493 | 8,821,588 | 44,212 | 573 |
| 19 | Delhi (UT) | 16,787,941 | 1.39 | 8,887,326 | 7,800,615 | 868 | 944,727 | 12,905,780 | 1,484 | 11,297 |
| 20 | Jammu and Kashmir | 12,541,302 | 1.04 | 6,640,662 | 5,900,640 | 889 | 9,134,820 | 3,414,106 | 222,236 | 56 |
| 21 | Uttarakhand | 10,086,292 | 0.83 | 5,137,773 | 4,948,519 | 963 | 7,025,583 | 3,091,169 | 53,483 | 189 |
| 22 | Himachal Pradesh | 6,864,602 | 0.57 | 3,481,873 | 3,382,729 | 972 | 6,167,805 | 688,704 | 55,673 | 123 |
| 23 | Tripura | 3,673,917 | 0.30 | 1,874,376 | 1,799,541 | 960 | 2,710,051 | 960,981 | 10,486 | 350 |
| 24 | Meghalaya | 2,966,889 | 0.25 | 1,491,832 | 1,475,057 | 989 | 2,368,971 | 595,036 | 22,429 | 132 |
| 25 | Manipur | 2,721,756 | 0.22 | 1,290,171 | 1,280,219 | 992 | 1,899,624 | 822,132 | 22,327 | 122 |
| 26 | Nagaland | 1,978,502 | 0.16 | 1,024,649 | 953,853 | 931 | 1,406,861 | 573,741 | 16,579 | 119 |
| 27 | Goa | 1,458,545 | 0.12 | 739,140 | 719,405 | 973 | 551,414 | 906,309 | 3,702 | 394 |
| 28 | Arunachal Pradesh | 1,383,727 | 0.11 | 713,912 | 669,815 | 938 | 1,069,165 | 313,446 | 83,743 | 17 |
| 29 | Puducherry (UT) | 1,247,953 | 0.10 | 612,511 | 635,442 | 1037 | 394,341 | 850,123 | 479 | 2,598 |
| 30 | Mizoram | 1,097,206 | 0.09 | 555,339 | 541,867 | 976 | 529,037 | 561,997 | 21,081 | 52 |
| 31 | Chandigarh (UT) | 1,055,450 | 0.09 | 580,663 | 474,787 | 818 | 29,004 | 1,025,682 | 114 | 9,252 |
| 32 | Sikkim | 610,577 | 0.05 | 323,070 | 287,507 | 890 | 455,962 | 151,726 | 7,096 | 86 |
| 33 | Andaman and Nicobar Islands (UT) | 380,581 | 0.03 | 202,871 | 177,710 | 876 | 244,411 | 135,533 | 8,249 | 46 |
| 34 | Dadra and Nagar Haveli (UT) | 343,709 | 0.03 | 193,760 | 149,949 | 774 | 183,024 | 159,829 | 491 | 698 |
| 35 | Daman and Diu (UT) | 243,247 | 0.02 | 150,301 | 92,946 | 618 | 60,331 | 182,580 | 112 | 2,169 |
| 36 | Lakshadweep (UT) | 64,473 | 0.01 | 33,123 | 31,350 | 946 | 14,121 | 50,308 | 32 | 2,013 |
| – | Total (India) | 1,210,854,977 | 100 | 623,724,248 | 586,469,174 | 943 | 833,087,662 | 377,105,760 | 3,287,240 | 382 |
Religious demographics
The table below summarises India's demographics (excluding Mao-Maram, Paomata and Purul subdivisions of Senapati District of Manipur state due to cancellation of census results) according to religion at the 2011 census in per cent. The data is "unadjusted" (without excluding Assam and Jammu and Kashmir); the 1981 census was not conducted in Assam and the 1991 census was not conducted in Jammu and Kashmir.
| Religion | Population | Percent (%) |
|---|---|---|
| All | 1,210,854,977 | 100.00 |
| Hindus | 966,378,868 | 79.80 |
| Muslims | 172,245,158 | 14.23 |
| Christians | 27,819,588 | 2.30 |
| Sikhs | 20,833,116 | 1.72 |
| Buddhists | 8,442,972 | 0.70 |
| Jains | 4,451,753 | 0.37 |
| Others | 7,937,734 | 0.66 |
| Not stated | 2,867,303 | 0.24 |
| Composition | Hindus | Muslims | Christians | Sikhs | Buddhists | Jains | Others |
|---|---|---|---|---|---|---|---|
| Percent of total population (%)[32] | 80.50 | 13.40 | 2.30 | 1.90 | 0.80 | 0.40 | 0.60 |
| 10-year growth (est. 2001–2011) (%) | 16.8 | 24.6 | 15.5 | 8.4 | 6.1 | 5.4 | 103.1 |
| No. of females per 1000 males (average = 943) | 939 | 951 | 1023 | 903 | 965 | 954 | 995 |
| Literacy rate (%) | 64.5 | 60.0 | 80.3 | 70.4 | 73.0 | 95.0 | 50.0 |
| Work participation rate (%) | 40.4 | 31.3 | 39.7 | 37.7 | 40.6 | 32.9 | 48.4 |
| Rural sex ratio | 923 | 953 | 1001 | 895 | 958 | 937 | 995 |
| Urban sex ratio | 922 | 907 | 1026 | 886 | 944 | 941 | 966 |
| Child sex ratio (0–6 yrs) | 925 | 950 | 964 | 786 | 942 | 870 | 976 |
| Religion | 1951 (%) | 1961 (%) | 1971 (%) | 1981 (%) | 1991 (%) | 2001 (%) | 2011 (%)[37] |
|---|---|---|---|---|---|---|---|
| Hinduism | 84.10 | 83.45 | 82.73 | 82.30 | 81.53 | 80.46 | 79.80 |
| Islam | 9.80 | 10.69 | 11.21 | 11.75 | 12.61 | 13.43 | 14.23 |
| Christianity | 2.30 | 2.44 | 2.60 | 2.44 | 2.32 | 2.34 | 2.30 |
| Sikhism | 1.79 | 1.79 | 1.89 | 1.92 | 1.94 | 1.87 | 1.72 |
| Buddhism | 0.74 | 0.74 | 0.70 | 0.70 | 0.77 | 0.77 | 0.70 |
| Jainism | 0.46 | 0.46 | 0.48 | 0.47 | 0.40 | 0.41 | 0.37 |
| Zoroastrianism | 0.13 | 0.09 | 0.09 | 0.09 | 0.08 | 0.06 | NA |
| Others | 0.43 | 0.43 | 0.41 | 0.42 | 0.44 | 0.72 | 0.90 |
Neonatal and infant demographics
The table below represents the infant mortality rate trends in India, by gender, in the last 15 years. In the urban areas of India, average male infant mortality rates are slightly higher than the female infant mortality rates.
| Year | Male | Female |
|---|---|---|
| 1998[39] | 70 | 74 |
| 2005[40] | 56 | 58 |
| 2009[41] | 49 | 52 |
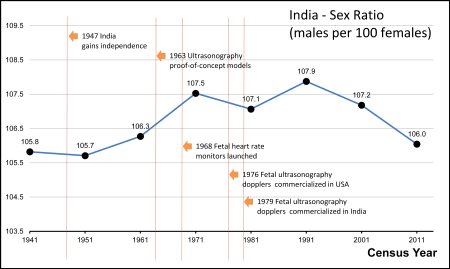
Some activists believe India's 2011 census shows a serious decline in the number of girls under the age of seven – activists fear eight million female foetuses may have been aborted between 2001 and 2011.[42] These claims are controversial. Scientists who study human sex ratios and demographic trends suggest that birth sex ratio between 1.08 and 1.12 can be because of natural factors, such as the age of mother at baby's birth, age of father at baby's birth, number of babies per couple, economic stress, endocrinological factors, etc.[43] The 2011 census birth sex ratio in India, of 917 girls to 1000 boys, is similar to 870–930 girls to 1000 boys birth sex ratios observed in Japanese, Chinese, Cuban, Filipino and Hawaiian ethnic groups in the United States between 1940 and 2005. They are also similar to birth sex ratios below 900 girls to 1000 boys observed in mothers of different age groups and gestation periods in the United States.[44][45]
Population within the age group of 0–6
| State/UT Code | State/UT | Total | Male | Female |
|---|---|---|---|---|
| 1 | Jammu and Kashmir | 2,008,670 | 1,080,662 | 927,982 |
| 2 | Himachal Pradesh | 763,864 | 400,681 | 363,183 |
| 3 | Punjab | 2,941,570 | 1,593,262 | 1,348,308 |
| 4 | Chandigarh | 117,953 | 63,187 | 54,766 |
| 5 | Uttarakhand | 1,328,844 | 704,769 | 624,075 |
| 6 | Haryana | 3,297,724 | 1,802,047 | 1,495,677 |
| 7 | Delhi | 1,970,510 | 1,055,735 | 914,775 |
| 8 | Rajasthan | 10,504,916 | 5,580,212 | 4,924,004 |
| 9 | Uttar Pradesh | 29,728,235 | 15,653,175 | 14,075,060 |
| 10 | Bihar | 18,582,229 | 9,615,280 | 8,966,949 |
| 11 | Sikkim | 61,077 | 31,418 | 29,659 |
| 12 | Arunachal Pradesh | 202,759 | 103,430 | 99,330 |
| 13 | Nagaland | 285,981 | 147,111 | 138,870 |
| 14 | Manipur | 353,237 | 182,684 | 170,553 |
| 15 | Mizoram | 165,536 | 83,965 | 81,571 |
| 16 | Tripura | 444,055 | 227,354 | 216,701 |
| 17 | Meghalaya | 555,822 | 282,189 | 273,633 |
| 18 | Assam | 4,511,307 | 2,305,088 | 2,206,219 |
| 19 | West Bengal | 10,112,599 | 5,187,264 | 4,925,335 |
| 20 | Jharkhand | 5,237,582 | 2,695,921 | 2,541,661 |
| 21 | Odisha | 5,035,650 | 2,603,208 | 2,432,442 |
| 22 | Chhattisgarh | 3,584,028 | 1,824,987 | 1,759,041 |
| 23 | Madhya Pradesh | 10,548,295 | 5,516,957 | 5,031,338 |
| 24 | Gujarat | 7,564,464 | 3,974,286 | 3,519,890 |
| 25 | Daman and Diu | 25,880 | 13,556 | 12,314 |
| 26 | Dadra and Nagar Haveli | 49,196 | 25,575 | 23,621 |
| 27 | Maharashtra | 12,848,375 | 6,822,262 | 6,026,113 |
| 28 | Andhra Pradesh | 8,642,686 | 4,448,330 | 4,194,356 |
| 29 | Karnataka | 6,855,801 | 3,527,844 | 3,327,957 |
| 30 | Goa | 139,495 | 72,669 | 66,826 |
| 31 | Lakshadweep | 7,088 | 3,715 | 3,373 |
| 32 | Kerala | 3,322,247 | 1,695,889 | 1,626,358 |
| 33 | Tamil Nadu | 6,894,821 | 3,542,351 | 3,352,470 |
| 34 | Puducherry | 127,610 | 64,932 | 62,678 |
| 35 | Andaman and Nicobar Islands | 39,497 | 20,094 | 19,403 |
| – | Total (India) | 158,789,287 | 82,952,135 | 75,837,152 |
Population above the age of 7

| State/UT Code | State/UT | Total | Male | Female |
|---|---|---|---|---|
| 1 | Jammu and Kashmir | – | – | – |
| 2 | Himachal Pradesh | – | – | – |
| 3 | Punjab | – | – | – |
| 4 | Chandigarh | – | – | – |
| 5 | Uttarakhand | – | – | – |
| 6 | Haryana | 22,055,357 | 11,703,083 | 10,352,274 |
| 7 | Delhi | 14,782,725 | 7,920,675 | 6,862,050 |
| 8 | Rajasthan | 58,116,096 | 30,039,874 | 28,076,222 |
| 9 | Uttar Pradesh | 169,853,242 | 88,943,240 | 80,910,002 |
| 10 | Bihar | 85,222,408 | 44,570,067 | 40,652,341 |
| 11 | Sikkim | 546,611 | 290,243 | 256,368 |
| 12 | Arunachal Pradesh | 1,179,852 | 616,802 | 563,050 |
| 13 | Nagaland | 1,694,621 | 878,596 | 816,025 |
| 14 | Manipur | 2,368,519 | 1,187,080 | 1,181,439 |
| 15 | Mizoram | 925,478 | 468,374 | 457,104 |
| 16 | Tripura | 3,226,977 | 1,644,513 | 1,582,464 |
| 17 | Meghalaya | 2,408,185 | 1,210,479 | 1,197,706 |
| 18 | Assam | 26,657,965 | 13,649,839 | 13,008,126 |
| 19 | West Bengal | 81,235,137 | 41,740,125 | 39,495,012 |
| 20 | Jharkhand | 27,728,656 | 14,235,767 | 13,492,889 |
| 21 | Odisha | 36,911,708 | 18,598,470 | 18,313,238 |
| 22 | Chhattisgarh | 21,956,168 | 11,002,928 | 10,953,240 |
| 23 | Madhya Pradesh | 62,049,270 | 32,095,963 | 29,953,307 |
| 24 | Gujarat | 52,889,452 | 27,507,996 | 25,381,456 |
| 25 | Daman and Diu | 217,031 | 136,544 | 80,487 |
| 26 | Dadra and Nagar Haveli | 293,657 | 167,603 | 126,054 |
| 27 | Maharashtra | 99,524,597 | 51,539,135 | 47,985,462 |
| 28 | Andhra Pradesh | 76,022,847 | 38,061,551 | 37,961,296 |
| 29 | Karnataka | 54,274,903 | 27,529,898 | 26,745,005 |
| 30 | Goa | 1,318,228 | 668,042 | 650,186 |
| 31 | Lakshadweep | 57,341 | 29,391 | 27,950 |
| 32 | Kerala | – | – | – |
| 33 | Tamil Nadu | 65,244,137 | 32,616,520 | 32,627,617 |
| 34 | Puducherry | 1,116,854 | 545,553 | 571,301 |
| 35 | Andaman and Nicobar Islands | 340,447 | 182,236 | 158,211 |
| – | Total (India) | 1,051,404,135 | 540,772,113 | 510,632,022 |
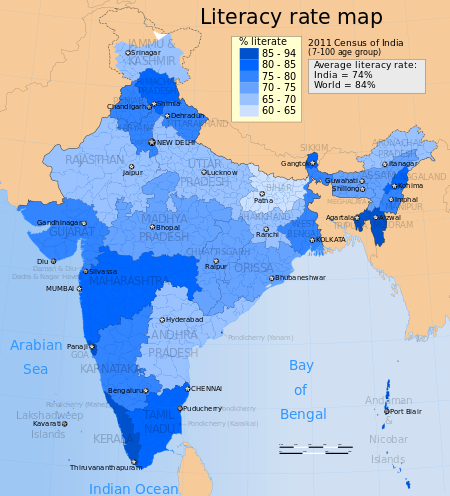
Literacy rate
| State/UT Code | State/UT | Overall (%) | Male (%) | Female (%) |
|---|---|---|---|---|
| 1 | Jammu and Kashmir | 86.61 | 87.26 | 86.23 |
| 2 | Himachal Pradesh | 83.78 | 90.83 | 76.60 |
| 3 | Punjab | 76.60 | 81.48 | 71.34 |
| 4 | Chandigarh | 86.43 | 90.54 | 81.38 |
| 5 | Uttarakhand | 79.63 | 88.33 | 70.70 |
| 6 | Haryana | 76.64 | 85.38 | 66.77 |
| 7 | Delhi | 86.34 | 91.03 | 80.93 |
| 8 | Rajasthan | 67.06 | 80.51 | 52.66 |
| 9 | Uttar Pradesh | 69.72 | 79.24 | 59.26 |
| 10 | Bihar | 63.82 | 73.39 | 53.33 |
| 11 | Sikkim | 82.20 | 87.29 | 76.43 |
| 12 | Arunachal Pradesh | 66.95 | 73.69 | 59.57 |
| 13 | Nagaland | 80.11 | 83.29 | 76.69 |
| 14 | Manipur | 79.85 | 86.49 | 73.17 |
| 15 | Mizoram | 91.58 | 93.72 | 89.40 |
| 16 | Tripura | 87.75 | 92.18 | 83.15 |
| 17 | Meghalaya | 75.48 | 77.17 | 73.78 |
| 18 | Assam | 73.18 | 78.81 | 67.27 |
| 19 | West Bengal | 77.08 | 82.67 | 71.16 |
| 20 | Jharkhand | 67.63 | 78.45 | 56.21 |
| 21 | Odisha | 72.90 | 82.40 | 64.36 |
| 22 | Chhattisgarh | 71.04 | 81.45 | 60.59 |
| 23 | Madhya Pradesh | 70.63 | 80.53 | 60.02 |
| 24 | Gujarat | 79.31 | 87.23 | 70.73 |
| 25 | Daman and Diu | 87.07 | 91.48 | 79.59 |
| 26 | Dadra and Nagar Haveli | 77.65 | 86.46 | 65.93 |
| 27 | Maharashtra | 83.20 | 89.82 | 75.48 |
| 28 | Andhra Pradesh | 67.66 | 75.56 | 59.74 |
| 29 | Karnataka | 75.60 | 82.85 | 68.13 |
| 30 | Goa | 87.40 | 92.81 | 81.84 |
| 31 | Lakshadweep | 92.28 | 96.11 | 88.25 |
| 32 | Kerala | 93.91 | 96.02 | 91.98 |
| 33 | Tamil Nadu | 80.33 | 86.81 | 73.86 |
| 34 | Puducherry | 86.55 | 92.12 | 81.22 |
| 35 | Andaman and Nicobar Islands | 86.27 | 90.11 | 81.84 |
| – | Overall (India) | 74.03 | 82.14 | 65.46 |
Linguistic demographics
41.03% of the Indians speak Hindi while the rest speak Assamese, Bengali, Gujarati, Kannada, Malayalam, Marathi, Odia, Punjabi, Tamil, Telugu, Urdu and a variety of other languages.
The table immediately below excludes Mao-Maram, Paomata and Purul subdivisions of Senapati District of Manipur state due to cancellation of census results.
| Rank | Language | Speakers | Percentage (%) |
|---|---|---|---|
| 1 | Hindi dialects[50] | 422,048,642 | 41.030 |
| 2 | Bengali | 83,369,769 | 8.110 |
| 3 | Telugu | 74,002,856 | 7.190 |
| 4 | Marathi | 71,936,894 | 6.990 |
| 5 | Tamil | 60,793,814 | 5.910 |
| 6 | Urdu | 51,536,111 | 5.010 |
| 7 | Gujarati | 46,091,617 | 4.480 |
| 8 | Kannada | 37,924,011 | 3.690 |
| 9 | Malayalam | 33,066,392 | 3.210 |
| 10 | Odia | 33,017,446 | 3.210 |
| 11 | Punjabi | 29,102,477 | 2.830 |
| 12 | Assamese | 13,168,484 | 1.280 |
| 13 | Maithili | 12,179,122 | 1.180 |
| 14 | Bhili/Bhilodi | 9,582,957 | 0.930 |
| 15 | Santali | 6,469,600 | 0.630 |
| 16 | Kashmiri | 5,527,698 | 0.540 |
| 17 | Nepali | 2,871,749 | 0.280 |
| 18 | Gondi | 2,713,790 | 0.260 |
| 19 | Sindhi | 2,535,485 | 0.250 |
| 20 | Konkani | 2,489,015 | 0.240 |
| 21 | Dogri | 2,282,589 | 0.220 |
| 22 | Khandeshi | 2,075,258 | 0.200 |
| 23 | Kurukh | 1,751,489 | 0.170 |
| 24 | Tulu | 1,722,768 | 0.170 |
| 25 | Meitei (Manipuri) | 1,466,705 | 0.140 |
| 26 | Bodo | 1,350,478 | 0.130 |
| 27 | Khasi – Garo | 1,128,575 | 0.112 |
| 28 | Mundari | 1,061,352 | 0.105 |
| 29 | Ho | 1,042,724 | 0.103 |
Largest cities
| | |||||||||
|---|---|---|---|---|---|---|---|---|---|
| Rank | Name | State/UT | Pop. | Rank | Name | State/UT | Pop. | ||
 Mumbai  Delhi |
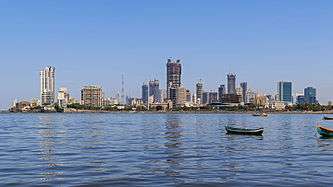
1 | Mumbai | Maharashtra | 12,478,447 | 11 | Jaipur | Rajasthan | 3,073,350 | .jpg) Bengaluru Hyderabad |
| 2 | Delhi | Delhi | 11,007,835 | 12 | Kanpur | Uttar Pradesh | 2,920,067 | ||
| 3 | Bengaluru | Karnataka | 8,425,970 | 13 | Lucknow | Uttar Pradesh | 2,901,474 | ||
| 4 | Hyderabad | Telangana | 6,809,970 | 14 | Nagpur | Maharashtra | 2,405,421 | ||
| 5 | Ahmedabad | Gujarat | 5,570,585 | 15 | Indore | Madhya Pradesh | 1,960 521 | ||
| 6 | Chennai | Tamil Nadu | 4,681,087 | 16 | Thane | Maharastra | 1,818,872 | ||
| 7 | Kolkata | West Bengal | 4,486,679 | 17 | Bhopal | Madhya Pradesh | 1,795,648 | ||
| 8 | Surat | Gujarat | 4,462,002 | 18 | Visakhapatnam | Andhra Pradesh | 1,730,320 | ||
| 9 | Varanasi | Uttar Pradesh | 3,676,841 | 19 | Pimpri-Chinchwad | Maharashtra | 1,729,359 | ||
| 10 | Pune | Maharashtra | 3,115,431 | 20 | Patna | Bihar | 1,683,200 | ||
Vital statistics
UN estimates
| Period | Births per year | Deaths per year | Natural change per year | CBR1 | CDR1 | NC1 | TFR1 | IMR1 |
|---|---|---|---|---|---|---|---|---|
| 1950–1955 | 16,832,000 | 9,928,000 | 6,904,000 | 43.3 | 25.5 | 17.7 | 5.90 | 165.0 |
| 1955–1960 | 17,981,000 | 9,686,000 | 8,295,000 | 42.1 | 22.7 | 19.4 | 5.90 | 153.1 |
| 1960–1965 | 19,086,000 | 9,358,000 | 9,728,000 | 40.4 | 19.8 | 20.6 | 5.82 | 140.1 |
| 1965–1970 | 20,611,000 | 9,057,000 | 11,554,000 | 39.2 | 17.2 | 22.0 | 5.69 | 128.5 |
| 1970–1975 | 22,022,000 | 8,821,000 | 13,201,000 | 37.5 | 15.0 | 22.5 | 5.26 | 118.0 |
| 1975–1980 | 24,003,000 | 8,584,000 | 15,419,000 | 36.3 | 13.0 | 23.3 | 4.89 | 106.4 |
| 1980–1985 | 25,577,000 | 8,763,000 | 16,814,000 | 34.5 | 11.8 | 22.7 | 4.47 | 95.0 |
| 1985–1990 | 26,935,000 | 9,073,000 | 17,862,000 | 32.5 | 10.9 | 21.5 | 4.11 | 85.1 |
| 1990–1995 | 27,566,000 | 9,400,000 | 18,166,000 | 30.0 | 10.2 | 19.8 | 3.72 | 76.4 |
| 1995–2000 | 27,443,000 | 9,458,000 | 17,985,000 | 27.2 | 9.4 | 17.8 | 3.31 | 68.9 |
| 2000–2005 | 27,158,000 | 9,545,000 | 17,614,000 | 25.3 | 8.4 | 16.9 | 3.14 | 60.7 |
| 2005–2010 | 27,271,000 | 9,757,000 | 17,514,000 | 22.9 | 7.9 | 15.0 | 2.80 | 52.9 |
| 2010–2015 | – | – | – | 20.4 | 7.4 | 14.0 | 2.48 | – |
| 1 CBR = crude birth rate (per 1000); CDR = crude death rate (per 1000); NC = natural change (per 1000); TFR = total fertility rate (number of children per woman); IMR = infant mortality rate per 1000 births | ||||||||
Census of India: sample registration system

| Year | Average population (x 1000) |
Live births1 | Deaths1 | Natural change | Crude birth rate (per 1000) |
Crude death rate (per 1000) |
Natural change (per 1000) |
Total fertility rate |
|---|---|---|---|---|---|---|---|---|
| 1981 | 716,493 | 24,289,000 | 8,956,000 | 15,333,000 | 33.9 | 12.5 | 21.4 | – |
| 1982 | 733,152 | 24,781,000 | 8,725,000 | 16,056,000 | 33.8 | 11.9 | 21.9 | – |
| 1983 | 750,034 | 25,276,000 | 8,925,000 | 16,351,000 | 33.7 | 11.9 | 21.8 | – |
| 1984 | 767,147 | 26,006,000 | 9,666,000 | 16,340,000 | 33.9 | 12.6 | 21.3 | – |
| 1985 | 784,491 | 25,810,000 | 9,257,000 | 16,553,000 | 32.9 | 11.8 | 21.1 | – |
| 1986 | 802,052 | 26,147,000 | 8,903,000 | 17,244,000 | 32.6 | 11.1 | 21.5 | – |
| 1987 | 819,800 | 26,316,000 | 8,936,000 | 17,380,000 | 32.1 | 10.9 | 21.2 | – |
| 1988 | 837,700 | 26,388,000 | 9,215,000 | 17,173,000 | 31.5 | 11.0 | 20.5 | – |
| 1989 | 855,707 | 26,185,000 | 8,814,000 | 17,371,000 | 30.6 | 10.3 | 20.3 | – |
| 1990 | 873,785 | 26,388,000 | 8,476,000 | 17,912,000 | 30.2 | 9.7 | 20.5 | 3.80 |
| 1991 | 891,910 | 26,133,000 | 8,741,000 | 17,392,000 | 29.3 | 9.8 | 19.5 | – |
| 1992 | 910,065 | 26,392,000 | 9,192,000 | 17,200,000 | 29.0 | 10.1 | 18.9 | – |
| 1993 | 928,226 | 26,640,000 | 8,633,000 | 18,007,000 | 28.7 | 9.3 | 19.4 | – |
| 1994 | 946,373 | 27,161,000 | 8,801,000 | 18,360,000 | 28.7 | 9.3 | 19.4 | – |
| 1995 | 964,486 | 27,295,000 | 8,680,000 | 18,615,000 | 28.3 | 9.0 | 19.3 | 3.50 |
| 1996 | 982,553 | 26,824,000 | 8,745,000 | 18,079,000 | 27.3 | 8.9 | 18.4 | – |
| 1997 | 1,000,558 | 27,215,000 | 8,905,000 | 18,310,000 | 27.2 | 8.9 | 18.3 | – |
| 1998 | 1,018,471 | 26,989,000 | 9,166,000 | 17,823,000 | 26.5 | 9.0 | 17.5 | – |
| 1999 | 1,036,259 | 26,943,000 | 9,015,000 | 17,928,000 | 26.0 | 8.7 | 17.3 | – |
| 2000 | 1,053,898 | 27,191,000 | 8,958,000 | 18,233,000 | 25.8 | 8.5 | 17.3 | 3.20 |
| 2001 | 1,071,374 | 27,213,000 | 9,000,000 | 18,213,000 | 25.4 | 8.4 | 17.0 | – |
| 2002 | 1,088,694 | 27,217,000 | 8,818,000 | 18,399,000 | 25.0 | 8.1 | 16.9 | – |
| 2003 | 1,105,886 | 27,426,000 | 8,847,000 | 18,579,000 | 24.8 | 8.0 | 16.8 | – |
| 2004 | 1,122,991 | 27,064,000 | 8,422,000 | 18,642,000 | 24.1 | 7.5 | 16.6 | – |
| 2005 | 1,140,043 | 27,133,000 | 8,664,000 | 18,469,000 | 23.8 | 7.6 | 16.2 | 2.90 |
| 2006 | 1,157,039 | 27,190,000 | 8,678,000 | 18,512,000 | 23.5 | 7.5 | 16.0 | – |
| 2007 | 1,173,972 | 27,119,000 | 8,687,000 | 18,432,000 | 23.1 | 7.4 | 15.7 | – |
| 2008 | 1,190,864 | 27,152,000 | 8,812,000 | 18,340,000 | 22.8 | 7.4 | 15.4 | 2.60 |
| 2009 | 1,207,740 | 27,174,000 | 8,817,000 | 18,357,000 | 22.5 | 7.3 | 15.2 | 2.60 |
| 2010 | 1,224,614 | 27,064,000 | 8,817,000 | 18,247,000 | 22.1 | 7.2 | 14.9 | 2.50 |
| 2011 | 1,242,738 | 27,092,000 | 8,823,000 | 18,268,000 | 21.8 | 7.1 | 14.7 | 2.44 |
| 2012 | 1,261,006 | 27,237,000 | 8,827,000 | 18,410,000 | 21.6 | 7.0 | 14.6 | 2.40 |
| 2013 | 1,279,416 | 27,379,500 | 8,956,000 | 18,423,600 | 21.4 | 7.0 | 14.4 | 2.30 |
| 1 The numbers of births and deaths were calculated from the birth and death rates and the average population. | ||||||||
Structure of the population
Structure of the population (09.02.2011) (Census) (Includes data for the Indian-held part of Jammu and Kashmir, the final status of which has not yet been determined):[56]
| Age group | Male | Female | Total | Percentage (%) |
|---|---|---|---|---|
| 0–4 | 58,632,074 | 54,174,704 | 112,806,778 | 9.32 |
| 5–9 | 66,300,466 | 60,627,660 | 126,928,126 | 10.48 |
| 10–14 | 69,418,835 | 63,290,377 | 132,709,212 | 10.96 |
| 15–19 | 63,982,396 | 56,544,053 | 120,526,449 | 9.95 |
| 20–24 | 57,584,693 | 53,839,529 | 111,424,222 | 9.20 |
| 25–29 | 51,344,208 | 50,069,757 | 101,413,965 | 8.38 |
| 30–34 | 44,660,674 | 43,934,277 | 88,594,951 | 7.32 |
| 35–39 | 42,919,381 | 42,221,303 | 85,140,684 | 7.03 |
| 40–44 | 37,545,386 | 34,892,726 | 72,438,112 | 5.98 |
| 45–49 | 32,138,114 | 30,180,213 | 62,318,327 | 5.15 |
| 50–54 | 25,843,266 | 23,225,988 | 49,069,254 | 4.05 |
| 55–59 | 19,456,012 | 19,690,043 | 39,146,055 | 3.23 |
| 60–64 | 18,701,749 | 18,961,958 | 37,663,707 | 3.11 |
| 65–69 | 12,944,326 | 13,510,657 | 26,454,983 | 2.18 |
| 70–74 | 9,651,499 | 9,557,343 | 19,208,842 | 1.59 |
| 75–79 | 4,490,603 | 4,741,900 | 9,232,503 | 0.76 |
| 80–84 | 2,927,040 | 3,293,189 | 6,220,229 | 0.51 |
| 85–89 | 1,120,106 | 1,263,061 | 2,383,167 | 0.20 |
| 90–94 | 652,465 | 794,069 | 1,446,534 | 0.12 |
| 95–99 | 294,759 | 338,538 | 633,297 | 0.05 |
| 100+ | 289,325 | 316,453 | 605,778 | 0.05 |
| Unknown | 2,372,881 | 2,116,921 | 4,489,802 | 0.37 |
| Total | 623,270,258 | 587,584,719 | 1,210,854,977 | 100.00 |
Fertility rate
From the Demographic Health Survey:[57]
| Year | CBR – Total | TFR – Total1 | CBR – Urban | TFR – Urban1 | CBR – Rural | TFR – Rural1 |
|---|---|---|---|---|---|---|
| 1992–1993 | 28.7 | 3.39 (2.64) | 24.1 | 2.70 (2.09) | 30.4 | 3.67 (2.86) |
| 1998–1999 | 24.8 | 2.85 (2.13) | 20.9 | 2.27 (1.73) | 26.2 | 3.07 (2.28) |
| 2003–2005 | 23.1 | 2.68 (1.90) | 18.8 | 2.06 (1.60) | 25.0 | 2.98 (2.10) |
| CBR = crude birth rate (per 1000); TFR = total fertility rate (number of children per woman). 1Number in parenthesis represents the wanted fertility rate. | ||||||
Regional vital statistics
| State/UT | Birth Rate | Death Rate | Natural Growth Rate | Infant Mortality Rate | ||||||||
|---|---|---|---|---|---|---|---|---|---|---|---|---|
| Total | Rural | Urban | Total | Rural | Urban | Total | Rural | Urban | Total | Rural | Urban | |
| Andaman and Nicobar Islands | 15.6 | 15.5 | 15.8 | 4.3 | 4.8 | 3.3 | 11.3 | 10.7 | 12.6 | 25 | 29 | 18 |
| Andhra Pradesh | 17.9 | 18.3 | 16.7 | 7.6 | 8.6 | 5.4 | 10.2 | 9.7 | 11.3 | 46 | 51 | 33 |
| Arunachal Pradesh | 20.5 | 22.1 | 14.6 | 5.9 | 6.9 | 2.3 | 14.6 | 15.2 | 12.3 | 31 | 34 | 12 |
| Assam | 23.2 | 24.4 | 15.8 | 8.2 | 8.6 | 5.8 | 14.9 | 15.8 | 10.1 | 58 | 60 | 36 |
| Bihar | 28.1 | 28.8 | 22.0 | 6.8 | 7.0 | 5.6 | 21.3 | 21.8 | 16.4 | 48 | 49 | 38 |
| Chandigarh | 15.6 | 21.6 | 15.0 | 3.9 | 3.7 | 3.9 | 11.6 | 17.9 | 11.0 | 22 | 20 | 23 |
| Chhattisgarh | 25.3 | 26.8 | 18.6 | 8.0 | 8.4 | 6.2 | 17.3 | 18.4 | 12.4 | 51 | 52 | 44 |
| Dadra and Nagar Haveli | 26.6 | 26.0 | 28.6 | 4.7 | 5.1 | 3.3 | 21.9 | 20.9 | 25.3 | 38 | 43 | 22 |
| Daman and Diu | 18.8 | 19.1 | 18.3 | 4.9 | 4.9 | 4.8 | 13.9 | 14.2 | 13.6 | 23 | 19 | 29 |
| Delhi | 17.8 | 19.7 | 17.5 | 4.2 | 4.6 | 4.1 | 13.6 | 15.0 | 13.4 | 30 | 37 | 29 |
| Goa | 13.2 | 12.6 | 13.7 | 6.6 | 8.1 | 5.7 | 6.6 | 4.5 | 8.0 | 10 | 10 | 10 |
| Gujarat | 21.8 | 23.3 | 19.4 | 6.7 | 7.5 | 5.5 | 15.1 | 15.8 | 14.0 | 44 | 51 | 30 |
| Haryana | 22.3 | 23.3 | 19.8 | 6.6 | 7.0 | 5.6 | 15.7 | 16.3 | 14.3 | 48 | 51 | 38 |
| Himachal Pradesh | 16.9 | 17.5 | 11.5 | 6.9 | 7.2 | 4.2 | 10.0 | 10.3 | 7.3 | 40 | 41 | 29 |
| Jammu and Kashmir | 18.3 | 19.5 | 13.5 | 5.7 | 5.9 | 4.7 | 12.6 | 13.6 | 8.8 | 43 | 45 | 32 |
| Jharkhand | 25.3 | 26.7 | 19.3 | 7.0 | 7.4 | 5.4 | 18.3 | 19.3 | 13.9 | 42 | 44 | 30 |
| Karnataka | 19.2 | 20.2 | 17.5 | 7.1 | 8.1 | 5.4 | 12.1 | 12.1 | 12.1 | 38 | 43 | 28 |
| Kerala | 14.8 | 14.8 | 14.8 | 7.0 | 7.1 | 6.7 | 7.8 | 7.7 | 8.1 | 13 | 14 | 10 |
| Lakshadweep | 14.3 | 15.5 | 13.2 | 6.4 | 6.1 | 6.7 | 8.0 | 9.5 | 6.5 | 25 | 23 | 27 |
| Madhya Pradesh | 27.3 | 29.2 | 20.5 | 8.3 | 9.0 | 6.0 | 18.9 | 20.2 | 14.5 | 62 | 67 | 42 |
| Maharashtra | 17.1 | 17.6 | 16.4 | 6.5 | 7.5 | 5.3 | 10.6 | 10.2 | 11.1 | 28 | 34 | 20 |
| Manipur | 14.9 | 14.8 | 15.3 | 4.2 | 4.3 | 4.0 | 10.7 | 10.5 | 11.3 | 14 | 15 | 9 |
| Meghalaya | 24.5 | 26.6 | 14.8 | 7.9 | 8.4 | 5.6 | 16.6 | 18.2 | 9.2 | 55 | 58 | 37 |
| Mizoram | 17.1 | 21.1 | 13.0 | 4.5 | 5.4 | 3.7 | 12.5 | 15.7 | 9.3 | 37 | 47 | 21 |
| Nagaland | 16.8 | 17.0 | 16.0 | 3.6 | 3.7 | 3.3 | 13.2 | 13.3 | 12.7 | 23 | 24 | 20 |
| Odisha | 20.5 | 21.4 | 15.2 | 8.6 | 9.0 | 6.6 | 11.9 | 12.4 | 8.6 | 61 | 63 | 43 |
| Puducherry | 16.7 | 16.7 | 16.7 | 7.4 | 8.2 | 7.0 | 9.3 | 8.5 | 9.6 | 22 | 25 | 21 |
| Punjab | 16.6 | 17.2 | 15.6 | 7.0 | 7.7 | 5.8 | 9.6 | 9.5 | 9.8 | 34 | 37 | 28 |
| Rajasthan | 26.7 | 27.9 | 22.9 | 6.7 | 6.9 | 6.0 | 20.0 | 20.9 | 16.9 | 55 | 61 | 31 |
| Sikkim | 17.8 | 18.1 | 16.1 | 5.6 | 5.9 | 3.8 | 12.3 | 12.3 | 12.3 | 30 | 31 | 19 |
| Tamil Nadu | 15.9 | 16.0 | 15.8 | 7.6 | 8.2 | 6.9 | 8.3 | 7.8 | 8.9 | 24 | 25 | 22 |
| Tripura | 14.9 | 15.6 | 11.5 | 5.0 | 4.8 | 5.7 | 9.9 | 10.8 | 5.8 | 27 | 29 | 19 |
| Uttar Pradesh | 28.3 | 29.2 | 24.2 | 8.1 | 8.5 | 6.3 | 20.2 | 20.7 | 17.9 | 61 | 64 | 44 |
| Uttarakhand | 19.3 | 20.2 | 16.2 | 6.3 | 6.7 | 5.1 | 13.0 | 13.5 | 11.1 | 38 | 41 | 25 |
| West Bengal | 16.8 | 18.6 | 11.9 | 6.0 | 6.0 | 6.3 | 10.7 | 12.6 | 5.6 | 31 | 32 | 25 |
CIA World Factbook demographic statistics
The following demographic statistics are from the CIA World Factbook, unless otherwise indicated.
- Total population
1,166,079,217 (July 2009 est. CIA);[59] 1,210 million (2011 census)[60]

- Rural population
72.2%; male: 381,668,992, female: 360,948,755 (2001 census)
- Age structure
0–14 years: 30.8%; male: 188,208,196, female: 171,356,024
15–64 years: 64.3%; male: 386,432,921, female: 364,215,759
65+ years: 4.9%; male: 27,258,259, female: 30,031,289 (2007 est.)
- Median age
25.1 years
- Population growth rate
1.548% (2009 est.)
- Literacy rate
74% (age 7 and above, in 2011)[48]
81.4% (total population, age 15–25, in 2006)[62]
- Per cent of population below poverty line
22% (2006 est.)
- Unemployment rate
7.8%
- Net migration rate
−0.05 migrant(s)/1,000 population (2007 est.)
- Sex ratio
At birth:
1.12 male(s)/female
Under 10 years:
1.14 male(s)/female
15–24 years:
1.09 male(s)/female
24–64 years:
1.06 male(s)/female
65 years and over:
0.908 male(s)/female
Total population:
1.08 male(s)/female (2011 est.)
- Life expectancy at birth
Total population: 65.8 years (source: UN Human Development Report, 2013)
- Total fertility rate
2.72 children born/woman (2009 est.), although more up-to-date statistics indicate that India's TFR was 2.6 in 2008[63]
The TFR (total number of children born per women) according to religion in 2001 was: Hindus 2.4, Muslims 2.8, Sikhs 2.1, Christians 2.1, Buddhists 2.1, Jains 1.4, animists and others 2.99, tribals 3.16, scheduled castes 2.89
- Religions
Hindu 80.5%, Muslim 13.4%, Christian 2.3%, Sikh 1.8%, Buddhists 0.8%, Jains 0.4%, others 0.7%, unspecified 0.1% (2001 census)[64][65][66][67]
- Scheduled castes and tribes
Scheduled castes: 16.6% (2011 census);[68][69] scheduled tribes: 8.6% (2011 census)
- Languages
See Languages of India and List of Indian languages by total speakers. There are 216 languages with more than 10,000 native speakers in India. The largest of these is Hindi with some 337 million, and the second largest is Bengali. 22 languages are recognised as official languages. In India, there are 1,652 languages and dialects in total.[70][71]
Population projections
India is projected to overtake China as the world's most populous nation by 2030. India's population growth has raised concerns that it would lead to widespread unemployment and political instability.[72][73] Note that these projections make assumptions about future fertility and death rates which may not turn out to be correct in the event. Fertility rates also vary from region to region, with some higher than the national average and some lower.
Source:[74]
- 2020: 1,326,093,000
- 2030: 1,460,743,000
- 2040: 1,571,715,000
- 2050: 1,656,554,000
2020 estimate
In millions (example: 361 = 361,000,000)
Source:[75]
| Year | Under 15 | 15–64 | 65+ | Total |
|---|---|---|---|---|
| 2000 | 361 | 604 | 45 | 1010 |
| 2005 | 368 | 673 | 51 | 1093 |
| 2010 | 370 | 747 | 58 | 1175 |
| 2015 | 372 | 819 | 65 | 1256 |
| 2020 | 373 | 882 | 76 | 1332 |
Ethnic groups
The national Census of India does not recognise racial or ethnic groups within India,[76] but recognises many of the tribal groups as Scheduled Castes and Tribes (see list of Scheduled Tribes in India).
According to a 2009 study published by Reich et al., the modern Indian population is composed of two genetically divergent and heterogeneous populations which mixed in ancient times (about 1,200–3,500 BC), known as Ancestral North Indians (ANI) and Ancestral South Indians (ASI). ASI corresponds to the Dravidian-speaking population of southern India, whereas ANI corresponds to the Indo-Aryan-speaking population of northern India.[77][78]
For a list of ethnic groups in the Republic of India (as well as neighbouring countries) see ethnic groups of the Indian subcontinent.
Genetics
Y-chromosome DNA
Y-Chromosome DNA Y-DNA represents the male lineage, The Indian Y-chromosome pool may be summarised as follows where haplogroups R-M420, H, R2, L and NOP comprise generally more than 80% of the total chromosomes.[80]
Mitochondrial DNA
Mitochondrial DNA mtDNA represents the female lineage. The Indian mitochondrial DNA is primarily made up of Haplogroup M[82]
- Haplogroup M ~ 60%
- Haplogroup UK ~ 15%
- Haplogroup N ~ 25% (Excluding UK)
Autosomal DNA
Numerous genomic studies have been conducted in the last 15 years to seek insights into India's demographic and cultural diversity. These studies paint a complex and conflicting picture.
- In a 2003 study, Basu, Majumder et al. have concluded on the basis of results obtained from mtDNA, Y-chromosome and autosomal markers that "(1) there is an underlying unity of female lineages in India, indicating that the initial number of female settlers may have been small; (2) the tribal and the caste populations are highly differentiated; (3) the Austroasiatic tribals are the earliest settlers in India, providing support to one anthropological hypothesis while refuting some others; (4) a major wave of humans entered India through the northeast; (5) the Tibeto-Burman tribals share considerable genetic commonalities with the Austroasiatic tribals, supporting the hypothesis that they may have shared a common habitat in southern China, but the two groups of tribals can be differentiated on the basis of Y-chromosomal haplotypes; (6) the Dravidian speaking populations were possibly widespread throughout India but are regulated to South India now ; (7) formation of populations by fission that resulted in founder and drift effects have left their imprints on the genetic structures of contemporary populations; (8) the upper castes show closer genetic affinities with Central Asian populations, although those of southern India are more distant than those of northern India; (9) historical gene flow into India has contributed to a considerable obliteration of genetic histories of contemporary populations so that there is at present no clear congruence of genetic and geographical or sociocultural affinities."[83]
- In a later 2010 review article, Majumder affirms some of these conclusions, introduces and revises some other. The ongoing studies, concludes Majumder, suggest India has served as the major early corridor for geographical dispersal of modern humans from out-of-Africa. The archaeological and genetic traces of the earliest settlers in India has not provided any conclusive evidence. The tribal populations of India are older than the non-tribal populations. The autosomal differentiation and genetic diversity within India's caste populations at 0.04 is significantly lower than 0.14 for continental populations and 0.09 for 31 world population sets studied by Watkins et al., suggesting that while tribal populations were differentiated, the differentiation effects within India's caste population was less than previously thought. Majumder also concludes that recent studies suggest India has been a major contributor to the gene pool of southeast Asia.[84][85]
- Another study covering a large sample of Indian populations allowed Watkins et al. to examine eight Indian caste groups and four endogamous south Indian tribal populations. The Indian castes data show low between-group differences, while the tribal Indian groups show relatively high between-group differentiation. This suggests that people between Indian castes were not reproductively isolated, while Indian tribal populations experienced reproductive isolation and drift. Furthermore, the genetic fixation index data shows historical genetic differentiation and segregation between Indian castes population is much smaller than those found in east Asia, Africa and other continental populations; while being similar to the genetic differentiation and segregation observed in European populations.[85]
- In 2006, Sahoo et al. reported their analysis of genomic data on 936 Y-chromosomes representing 32 tribal and 45 caste groups from different regions of India. These scientists find that the haplogroup frequency distribution across the country, between different caste groups, was found to be predominantly driven by geographical, rather than cultural determinants. They conclude there is clear evidence for both large-scale immigration into ancient India of Sino-Tibetan speakers and language change of former Austroasiatic speakers, in the northeast Indian region.[86][87]
- The genome studies through 2010 have been on relatively small population sets. Many are from just one southeastern state of Andhra Pradesh (including Telangana, which was part of the state until June 2014). Any conclusions on demographic history of India must therefore be interpreted with caution. A larger national genome study with demographic growth and sex ratio balances may offer further insights on the extent of genetic differentiation and segregation in India over the millenniums.[84]
See also
Government
Lists
- List of most populous cities in India
- List of most populous metropolitan areas in India
- List of million-plus urban agglomerations in India
- List of states and union territories of India by population
Notes
References
- 1 2 "India Population (2016) – Worldometers".
- ↑ "Birth Rate, Death Rate, Infant Mortality Rate and Total Fertility Rate: India and States". National Commission on Population, Govt of India. 2010.
- ↑ "Census India SRS Bulletins". Registrar General of India, Govt of India. 2011.
- ↑ "Census India SRS Bulletins". Registrar General of India, Govt of India. 2013.
- ↑ "The World Factbook – India". CIA.
- ↑ "India to surpass China by 2022 to become world's most populous nation". The Indian Express. 30 July 2015. Retrieved 7 November 2016.
- 1 2 Rick Gladstone (29 July 2015). "India Will Be Most Populous Country Sooner Than Thought, U.N. Says". The New York Times. Retrieved 7 November 2016.
- ↑ "India's population 'to be biggest' in the planet". BBC News. 18 August 2004. Retrieved 2011-09-24.
- ↑ US Census Bureau, Demographic Internet Staff. "United States Census Bureau – International Data Base (IDB)". Census.gov. Retrieved 2011-09-24.
- ↑ "Population growth (annual %)". World Bank. Retrieved 20 January 2015.
- ↑ Basu, Kaushik (25 July 2007). "India's demographic dividend". BBC News. Retrieved 2011-09-24.
- ↑ US Department of State (17 April 2012). "Background Note: India". Archived from the original on 2012-06-18.
- ↑ SIL International. "Ethnologue report for Language Isolate". Retrieved 2007-10-11.
- ↑ India, a Country Study United States Library of Congress, Note on Ethnic groups
- ↑ "Population" (PDF). Government of India (2011). Census of India.
- ↑ Anatole Romaniuk, review of Parameswara Krishnan's Glimpses of Indian Historical Demography, in Canadian Studies in Population 40.3–4 (2014): 248–251.
- ↑ Parameswara Krishnan, Glimpses of Indian Historical Demography (Delhi: B.R. Publishing Corporation 2010) ISBN 978-8176466387.
- ↑ J.H. Khan, "Population growth and demographic change in India", Asian Profile (2004) 32#5 pp. 441–460.
- ↑ Ira Klein, "Population growth and mortality in British India: Part II: The demographic revolution," Indian Economic Social History Review (1990) 27#1 pp 33–63 doi: 10.1177/001946469002700102.
- 1 2 Rural-Urban distribution Census of India: Census Data 2001: India at a glance >> Rural-Urban Distribution. Office of the Registrar General and Census Commissioner, India. Retrieved on 2008-11-26.
- ↑ Number of Villages Census of India: Number of Villages Office of the Registrar General and Census Commissioner, India. Retrieved on 2008-11-26.
- ↑ Urban Agglomerations and Towns Census of India: Urban Agglomerations and Towns. Office of the Registrar General and Census Commissioner, India. Retrieved on 2008-11-26.
- ↑ "World Population Prospects, the 2010 Revision". United Nations. 28 June 2011.
- 1 2 "CIA World Factbook". Central Intelligence Agency, USA. Retrieved January 2012. Check date values in:
|access-date=(help) - 1 2 "World Bank Indicators Databank, by topic". The World Bank. Retrieved January 2012. Check date values in:
|access-date=(help) - ↑ "Gender Statistics Highlights from 2012 World Development Report". World DataBank, a compilation of databases by the World Bank. February 2012.
- ↑ "Census Population" (PDF). Census of India. Ministry of Finance India. Retrieved January 1, 2014.
- ↑ "List of states with Population, Sex Ratio and Literacy Census 2011". 2011 Census of India. Retrieved 23 January 2013.
- 1 2 "Provisional Population Totals". Government of India (2011). Census of India. Retrieved 2011-07-23.
- ↑ "Area of India/state/district". Government of India (2001). Census of India. Retrieved 27 October 2008.
- ↑ "Census of India – India at a Glance : Religious Compositions". www.censusindia.gov.in. Retrieved 25 August 2015.
- ↑ "Census of India : Religious Composition". www.censusindia.gov.in. Retrieved 2016-09-19.
- ↑ Vijaita Singh (24 February 2015). "Muslim share of population up 0.8%, Hindus' down 0.7% between 2001 and 2011". Indian Express. Indian Express. Retrieved 2015-02-24.
- ↑ Abantika Ghosh , Vijaita Singh (24 January 2015). "India's Religious Census 2011: Hindus Below 80% For the First Time". Indian Express. Indian Express. Retrieved 2015-01-27.
- ↑ "Muslim politics: At a crossroads". livemint.com. Livemint. Retrieved 28 October 2014.
- ↑ "The Untold Census Story". OpenMagazine-PR Ramesh. 15 March 2014.
- ↑ "Population by religious community – 2011". 2011 Census of India. Office of the Registrar General & Census Commissioner. Archived from the original on 25 August 2015. Retrieved 25 August 2015. }
- ↑ "Sex Composition of the Population", Office of Registrar General and Census Commissioner of India, Ministry of Home Affairs, Government of India (2013)
- ↑ "SAMPLE REGISTRATION SYSTEM, REGISTRAR GENERAL, Volume 33, No. 1" (PDF). Census of India, Government of India. April 2000.
- ↑ "2005–06 National Family Health Survey, Infant and Child Mortality" (PDF). NFHS, a Government of India Organisation. 2006.
- ↑ "SAMPLE REGISTRATION SYSTEM, REGISTRAR GENERAL, Volume 45, No. 1" (PDF). Census of India, Government of India. January 2011.
- ↑ Pandey, Geeta (23 May 2011). "India's unwanted girls". BBC News. Retrieved 23 May 2011.
- ↑ James W.H. (July 2008). "Hypothesis:Evidence that Mammalian Sex Ratios at birth are partially controlled by parental hormonal levels around the time of conception" (PDF). Journal of Endocrinology. 198 (1): 3–15. doi:10.1677/JOE-07-0446. PMID 18577567.
- ↑ "Trend Analysis of the Sex Ratio at Birth in the United States" (PDF). U.S. Department of Health and Human Services, National Center for Health Statistics.
- ↑ Amy Branum, Jennifer Parker and Kenneth Schoendorf (2009). "Trends in US sex ratio by pluraity, gestational age and race/ethinicity, see page 2941 – Figure 2" (PDF). Reproductive Epidemiology. 24 (11): 2936–2944. doi:10.1093/humrep/dep255. Retrieved August 2011. Check date values in:
|access-date=(help) - 1 2 3 "Census of India Website : Office of the Registrar General and Census Commissioner, India". Censusindia.gov.in. Retrieved 2011-09-26.
- ↑ (a) Ponnapalli et al. (2013), Aging and the Demographic Transition in India and Its States: A Comparative Perspective, International Journal of Asian Social Science, 3(1), pp. 171–193; (b) The Future Population of India Population Research Bureau and Population Fund of India.
- 1 2 Ranking of states and union territories by literacy rate: 2011 Census of India Report (2013)
- ↑ Abstract of speakers' strength of languages and mother tongues – 2000, Census of India, 2001
- ↑ includes Western Hindi, Eastern Hindi, Bihari languages, Rajasthani languages and Pahari languages.
- ↑ Weblink
- ↑ United Nations, Department of Economic and Social Affairs website, Population Division > World Population Prospects: The 2015 Revision
- ↑ Table in Chapter 3 Vital Statistics of India, Estimates of Fertility Indicators, Census of India, Government of India (2013), page 48
- ↑ "United Nations Statistics Division – Demographic and Social Statistics".
- ↑ Census of India, Vital Statistics, Sample Registration System
- ↑ "United Nations Statistics Division – Demographic and Social Statistics".
- ↑ "The DHS Program – Survey Search".
- ↑ Archived 31 January 2012 at the Wayback Machine.
- ↑ "CIA World Factbook – India". Cia.gov. Retrieved 2011-09-24.
- ↑ Census India, 2011, chapter 3
- ↑ (a) Census 2011 Final, Ministry of Home Affairs, Government of India (may need subscription); (b) The data is mirrored here: Density of Population, Chapter 7, Census of India (2013)
- ↑ "National Youth Literacy Rates". UNESCO Institute of Statistics. 2009.
- ↑ "Total Fertility Rate in India on decline". Indian Express. 10 December 2010. Retrieved 2011-09-24.
- ↑ Religious Composition Census of India: Census Data 2001: India at a glance >> Religious Composition. Office of the Registrar General and Census Commissioner, India. Retrieved on 2008-11-26.
- ↑ International Religious Freedom Report 2007 — India International Religious Freedom Report 2007. U.S. Department of State.
- ↑ "CIA's The World Factbook — India". Cia.gov. Retrieved 2011-09-24.
- ↑ "India".
- ↑ 2011 Census Primary Census Abstract
- ↑ "Half of India's dalit population lives in 4 states".
- ↑ "Mother Tongues of India According to the 1961 Census". Languageinindia.com. Retrieved 2011-09-26.
- ↑ Rupert Goodwins.Smashing India's language barriers. ZDNet UK
- ↑ "Soutik Biswas's India: India's census: The good and bad news". BBC. 31 March 2011. Retrieved 2011-09-24.
- ↑ "India set to overtake China as world's most populated country after adding 180m people in a decade". Daily Mail. London. 31 March 2011.
- ↑ US Census Bureau, Demographic Internet Staff. "International Programs – Information Gateway – U.S. Census Bureau". Census.gov. Retrieved 2011-09-24.
- ↑ Based on P.N. Mari Bhat, "Indian Demographic Scenario 2025", Institute of Economic Growth, New Delhi, Discussion Paper No. 27/2001.
- ↑ Kumar, Jayant. Census of India. 2001. 4 September 2006. Indian Census
- ↑ Nature. "Reconstructing Indian population history : Abstract". Nature. Retrieved 2013-06-16.
- ↑ "Abstract/Presentation". Ichg2011.org. 2011-10-12. Retrieved 2013-06-16.
- ↑ "A prehistory of Indian Y chromosomes: Evaluating demic diffusion scenarios". Pnas.org. Retrieved 2011-09-24.
- ↑ Hammer et al. 2005, S. Sahoo et al. 2006, R. Trivedi et al. 2007, Zhao et al. 2008
- ↑ "1471-2148-5-26.fm" (PDF). Retrieved 2013-06-16.
- ↑ Semino et al. 2000, Kivisild et al. 2003, Metspalu et al. 2004, Rajkumar et al. 2005, Chandrasekar et al. 2007, Gonzalez et al. 2007
- ↑ "Ethnic India: A Genomic View, With Special Reference to Peopling and Structure". Genome.cshlp.org. Retrieved 2013-06-16.
- 1 2 Majumder (23 February 2010). "The Human Genetic History of South Asia: A Review". Current Biology. 20 (4): R184–R187. doi:10.1016/j.cub.2009.11.053. PMID 20178765.
- 1 2 Watkins; et al. (July 2003). "Genetic variation among world populations: inferences from 100 Alu insertion polymorphisms". Genome Res. 13 (7): 1607–18. doi:10.1101/gr.894603. PMC 403734
 . PMID 12805277.
 - ↑ Sahoo; et al. (2006). "A prehistory of Indian Y-chromosomes: evaluating demic diffusion scenarios". Proc. Natl. Acad. Sci. USA. 103 (4): 843–848. doi:10.1073/pnas.0507714103. PMC 1347984. PMID 16415161.
- ↑ Artis Zelmenis (2014). "Immigration for Indians to Europe; history & law". Immigration World Guru. 1 (1): 10–24.
External links
- Census of India; government site with detailed data from 2001 census
- Census of India map generator; generates maps based on 2001 census figures
- Demographic data for India; provides sources of demographic data for India
- 2001 maps; provides maps of social, economic and demographic data of India in 2001
- Population of India 2011 map; distribution of population amongst states and union territories
- India's Demographic Outlook: Implications and Trends
- United Nations "World Population Prospects": Country Profile – India
- Aggregated demographic statistics from Indian and global data sources
- Demographic statistics for India – online on Bluenomics
- India comparing with China population projection graph Based on data from database of UN Population Division
This tree diagram depicts the relationships of the major ethnic, linguistic and religious groups in India. For example, an H under Gujarati implies a Hindu, Gujarati-speaking Indian of Indo-Aryan ancestry. This list excludes caste groups like the Dalits which is a socio-political identity across linguistic, religious and racial lines. In addition, it should be noted that the terms 'Indo-Aryan' and 'Dravidian' refer to linguistic and ethno-racial differences that exist between both groups. | |||||||||||||||||||||||||||||||||||||||||||||||||||||||||||||||||||||||||||||||||||||||||||||||||||||||||||||||||||||||||||||||||||||||||||||||||||||||||||||||||||||||||||||||||||||||||||||||||||||||||||||||||||||||||||||||||||||||||||||||||||||||||||||||||||||||||||||||||||||||||||||||||||||||||||||||||||||||||||||||||||||||||||||||||||||||||||||||||||||||||||||||||||||||||||||||||||||||||||||||||||||||||||||||||||||||||||||||||||||||||||||||||||||||||||||||||||||||||||||||||||||||||||||||||||||||||||||||||||||||||||||||||||||||||||||||||||||||||||||||||||||||||||||||||||||||||||||||||||||||||||||||||||||||||||||||||||||||||||||||||||||||||||||||||||||||||||||||||||||||||||||||||||||||||||||||||||||||||||||||||||||||||||||||||||||||||||||||||||||||||||||||||||||||||||||||||||||||||||||||||||||||||||||||||||||||||||||||||||||||||||||||||||||||||||||||||||||||||||||||||||||||||||||||||||||||||||||||||||||||||||||||||||||||||||||||||||||||||||||||||||||||||||||||||||||||||||||||||||||||
| |||||||||||||||||||||||||||||||||||||||||||||||||||||||||||||||||||||||||||||||||||||||||||||||||||||||||||||||||||||||||||||||||||||||||||||||||||||||||||||||||||||||||||||||||||||||||||||||||||||||||||||||||||||||||||||||||||||||||||||||||||||||||||||||||||||||||||||||||||||||||||||||||||||||||||||||||||||||||||||||||||||||||||||||||||||||||||||||||||||||||||||||||||||||||||||||||||||||||||||||||||||||||||||||||||||||||||||||||||||||||||||||||||||||||||||||||||||||||||||||||||||||||||||||||||||||||||||||||||||||||||||||||||||||||||||||||||||||||||||||||||||||||||||||||||||||||||||||||||||||||||||||||||||||||||||||||||||||||||||||||||||||||||||||||||||||||||||||||||||||||||||||||||||||||||||||||||||||||||||||||||||||||||||||||||||||||||||||||||||||||||||||||||||||||||||||||||||||||||||||||||||||||||||||||||||||||||||||||||||||||||||||||||||||||||||||||||||||||||||||||||||||||||||||||||||||||||||||||||||||||||||||||||||||||||||||||||||||||||||||||||||||||||||||||||||||||||||||||||||||
| Companies |
|
|---|---|
| Governance |
|
| Currency | |
| Financial services | |
| History | |
| People |
|
| States | |
| Sectors | |
| |