Demographics of Hispanic and Latino Americans
The demographics of Hispanic and Latino Americans depict a population that is the second-largest ethnic group in the United States, 52 million people or 16.7% of the national population, of them, 27 Million are American citizens.
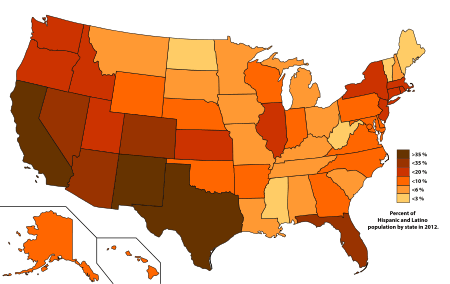
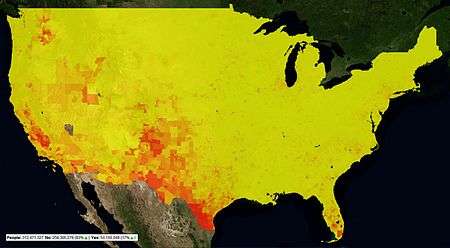
Hispanic population is much younger than the rest of the country, less educated, less wealthy, with a very large immigrant component, of no less than two dozen national origins and of every race, with a longer life expectancy than their fellow Americans, and geographically concentrated in the southwestern United States.[1][2][3][4][5]
A big proportion of Hispanics that came adults from Latin America to U.S. have academic degrees because public university systems in most countries of Latina America are free[6][7] or very low and some of them continue their education or career in the US.[8][9] More than 40 % of Hispanic students are in college or are attending to college.[10]
History
Hispanic and Latino Americans (along with Asian Americans, most notably) have contributed to an important demographic change in the United States since the 1960s whereby minority groups now compose one-third of the population. Nearly one in six Americans was Hispanic or Latino as of 2009, a total of 48.4 million out of the estimated 307 million Americans. High rates of immigration and fertility have shaped the growth of the Hispanic and Latino population.
Population
| State/Territory | Pop 2000 | % pop 2000 | Pop 2010 | % pop 2010 | % growth 2000-2010 | %pop 2012 |
|---|---|---|---|---|---|---|
| 75,830 | 1.7% | 185,602 | 3.9% | +144.8% | 4.1% | |
| 25,852 | 4.1% | 39,250 | 5.5% | +51.8% | 6.1% | |
| 1,295,617 | 25.3% | 1,895,149 | 29.6% | +46.3% | 30.2% | |
| 86,866 | 3.2% | 186,050 | 6.4% | +114.2% | 6.8% | |
| 10,966,556 | 32.4% | 14,013,719 | 37.6% | +27.8% | 38.2% | |
| 735,801 | 17.1% | 1,038,687 | 20.7% | +41.2% | 21.0% | |
| 320,323 | 9.4% | 479,087 | 13.4% | +49.6% | 14.2% | |
| 37,277 | 4.8% | 73,221 | 8.2% | +96.4% | 8.6% | |
| 44,953 | 7.9% | 54,749 | 9.1% | +21.8% | 9.9% | |
| 2,682,715 | 16.8% | 4,223,806 | 22.5% | +57.4% | 23.2% | |
| 435,227 | 5.3% | 853,689 | 8.8% | +96.1% | 9.2% | |
| 87,699 | 7.2% | 120,842 | 8.9% | +37.8% | 9.5% | |
| 101,690 | 7.9% | 175,901 | 11.2% | +73.0% | 11.6% | |
| 1,530,262 | 12.3% | 2,027,578 | 15.8% | +32.5% | 16.3% | |
| 214,536 | 3.5% | 389,707 | 6.0% | +81.7% | 6.3% | |
| 82,473 | 2.8% | 151,544 | 5.0% | +83.7% | 5.3% | |
| 188,252 | 7.0% | 300,042 | 10.5% | +59.4% | 11.0% | |
| 59,939 | 1.5% | 132,836 | 3.1% | +121.6% | 3.2% | |
| 107,738 | 2.4% | 192,560 | 4.2% | +78.7% | 4.5% | |
| 9,360 | 0.7% | 16,935 | 1.3% | +80.9% | 1.4% | |
| 227,916 | 4.3% | 470,632 | 8.2% | +106.5% | 8.7% | |
| 428,729 | 6.8% | 627,654 | 9.6% | +46.4% | 10.1% | |
| 323,877 | 3.3% | 436,358 | 4.4% | +34.7% | 4.6% | |
| 143,382 | 2.9% | 250,258 | 4.7% | +74.5% | 4.9% | |
| 39,569 | 1.4% | 81,481 | 2.7% | +105.9% | 2.9% | |
| 118,592 | 2.1% | 212,470 | 3.5% | +79.2% | 3.7% | |
| 18,081 | 2.0% | 28,565 | 2.9% | +58.0% | 3.1% | |
| 94,425 | 5.5% | 167,405 | 9.2% | +77.3% | 9.7% | |
| 393,970 | 19.7% | 716,501 | 26.5% | +81.9% | 27.3% | |
| 20,489 | 1.7% | 36,704 | 2.8% | +79.1% | 3.0% | |
| 1,117,191 | 13.3% | 1,555,144 | 17.7% | +39.2% | 18.5% | |
| 765,386 | 42.1% | 953,403 | 46.3% | +24.6% | 47.0% | |
| 2,867,583 | 15.1% | 3,416,922 | 17.6% | +19.2% | 18.2% | |
| 378,963 | 4.7% | 800,120 | 8.4% | +111.1% | 8.7% | |
| 7,786 | 1.2% | 13,467 | 2.0% | +73.0% | 2.5% | |
| 217,123 | 1.9% | 354,674 | 3.1% | +63.4% | 3.3% | |
| 179,304 | 5.2% | 332,007 | 8.9% | +85.2% | 9.3% | |
| 275,314 | 8.0% | 450,062 | 11.7% | +63.5% | 12.2% | |
| 394,088 | 3.2% | 719,660 | 5.7% | +82.6% | 6.1% | |
| 90,820 | 8.7% | 130,655 | 12.4% | +43.9% | 13.2% | |
| 95,076 | 2.4% | 235,682 | 5.1% | +147.9% | 5.3% | |
| 10,903 | 1.4% | 22,119 | 2.7% | +102.9% | 3.1% | |
| 123,838 | 2.2% | 290,059 | 4.6% | +134.2% | 4.8% | |
| 6,669,666 | 32.0% | 9,460,921 | 37.6% | +41.8% | 38.2% | |
| 201,559 | 9.0% | 358,340 | 13.0% | +77.8% | 13.3% | |
| 5,504 | 0.9% | 9,208 | 1.5% | +67.3% | 1.6% | |
| 329,540 | 4.7% | 631,825 | 7.9% | +91.7% | 8.4% | |
| 441,509 | 7.5% | 755,790 | 11.2% | +71.2% | 11.7% | |
| 12,279 | 0.7% | 22,268 | 1.2% | +81.4% | 1.3% | |
| 192,921 | 3.6% | 336,056 | 5.9% | +74.2% | 6.2% | |
| 31,669 | 6.4% | 50,231 | 8.9% | +58.6% | 9.5% | |
| 3,762,746 | 98.8% | 3,688,455 | 99.0% | 0.2% | 99.5% | |
| 15,196 | 14.0% | 18,514 | 17.4%[21] | |||
| 35,305,818 | 12.5% | 50,497,108 | 16.3% | +43.0% | 16.9% | |
Hispanic and Latino populations of each state by region of origin

Over 60% of the Hispanic and Latino population is from Mexico. Their presence is felt throughout the nation, but more so in the Southwest. The remaining portion hails from the Caribbean, Central America, and South America. Caribbean Hispanics come from the Caribbean islands of Puerto Rico, Cuba, and the Dominican Republic. Puerto Ricans are the second-largest Hispanic group, after Mexicans. There are large Puerto Ricans and Dominican populations in the Northeastern states, as well as large Cuban and Puerto Rican populations in Florida. Central American Hispanics come from El Salvador, Guatemala, Honduras, Nicaragua, Panama, and Costa Rica. The largest numbers of Hispanics with Central American origins can be found in California, Texas, and the DC Metropolitan area. South American Hispanics come from Colombia, Venezuela, Peru, Ecuador, Argentina, Chile, Uruguay, Bolivia, and Paraguay. Other Hispanic and Latino groups come from Spain, and the descendants of the colonial Spanish in Florida, Louisiana, and the US southwest.[22]
| State/Territory | Mexican | % Mexican | Caribbean | % Caribbean | Central American | % Central American | South American | % South American | other Hispanic | % other |
|---|---|---|---|---|---|---|---|---|---|---|
| 122,911 | 2.6% | 17,141 | 0.4% | 22,800 | 0.5% | 5,938 | 0.1% | 16,812 | 0.4% | |
| 21,642 | 3.0% | 7,338 | 1.0% | 2,509 | 0.4% | 2,345 | 0.3% | 5,415 | 0.8% | |
| 1,657,668 | 25.9% | 48,582 | 0.8% | 36,642 | 0.6% | 21,895 | 0.3% | 130,362 | 2.0% | |
| 138,194 | 4.7% | 6,666 | 0.3% | 23,216 | 0.8% | 3,028 | 0.1% | 14,946 | 0.5% | |
| 11,423,146 | 30.7% | 290,007 | 0.8% | 1,132,520 | 3.0% | 293,880 | 0.8% | 874,166 | 2.3% | |
| 757,181 | 15.1% | 30,992 | 0.6% | 29,386 | 0.6% | 19,117 | 0.4% | 202,011 | 4.0% | |
| 50,658 | 1.4% | 288,555 | 8.2% | 35,023 | 1.0% | 71,355 | 2.0% | 33,496 | 0.9% | |
| 30,283 | 3.4% | 26,011 | 3.0% | 8,112 | 0.9% | 3,849 | 0.4% | 4,966 | 0.6% | |
| 8,507 | 1.4% | 7,426 | 1.3% | 23,354 | 3.9% | 7,639 | 1.3% | 7,823 | 1.3% | |
| 629,718 | 3.3% | 2,233,439 | 12.0% | 432,665 | 2.3% | 674,542 | 3.6% | 253,442 | 1.3% | |
| 519,502 | 5.4% | 111,976 | 1.3% | 106,987 | 1.1% | 57,707 | 0.6% | 57,517 | 0.6% | |
| 35,415 | 2.6% | 46,260 | 3.4% | 2,962 | 0.2% | 3,549 | 0.3% | 32,656 | 2.4% | |
| 148,923 | 9.5% | 3,920 | 0.3% | 3,494 | 0.2% | 3,707 | 0.2% | 15,857 | 1.0% | |
| 1,602,403 | 12.5% | 211,221 | 1.7% | 70,000 | 0.5% | 67,862 | 0.5% | 76,092 | 0.6% | |
| 295,373 | 4.6% | 36,686 | 0.7% | 22,093 | 0.3% | 10,032 | 0.2% | 25,523 | 0.4% | |
| 117,090 | 3.8% | 6,540 | 0.3% | 13,289 | 0.4% | 3,754 | 0.1% | 10,871 | 0.4% | |
| 247,297 | 8.7% | 12,734 | 0.5% | 15,293 | 0.5% | 5,845 | 0.2% | 18,873 | 0.7% | |
| 82,110 | 1.9% | 21,842 | 0.6% | 11,479 | 0.3% | 5,405 | 0.1% | 12,000 | 0.3% | |
| 78,643 | 1.7% | 25,171 | 0.6% | 51,722 | 1.1% | 8,871 | 0.2% | 28,153 | 0.6% | |
| 5,134 | 0.4% | 5,770 | 0.5% | 1,708 | 0.1% | 1,515 | 0.1% | 2,808 | 0.2% | |
| 88,004 | 1.5% | 67,811 | 1.2% | 195,692 | 3.4% | 61,400 | 1.1% | 57,725 | 1.0% | |
| 38,379 | 0.6% | 380,723 | 6.0% | 96,958 | 1.5% | 54,398 | 0.8% | 57,196 | 0.9% | |
| 317,903 | 3.2% | 52,201 | 0.6% | 17,785 | 0.2% | 13,243 | 0.1% | 35,226 | 0.4% | |
| 176,007 | 3.3% | 15,762 | 0.3% | 19,908 | 0.4% | 18,075 | 0.3% | 20,506 | 0.4% | |
| 52,459 | 1.8% | 8,684 | 0.3% | 8,343 | 0.3% | 2,833 | 0.1% | 9,162 | 0.3% | |
| 147,254 | 2.5% | 18,718 | 0.3% | 17,763 | 0.3% | 8,731 | 0.1% | 20,004 | 0.3% | |
| 20,048 | 2.0% | 2,007 | 0.2% | 735 | 0.1% | 997 | 0.1% | 4,778 | 0.5% | |
| 128,060 | 7.0% | 5,752 | 0.3% | 17,242 | 0.9% | 2,824 | 0.2% | 13,527 | 0.7% | |
| 540,978 | 20.0% | 44,569 | 1.7% | 55,937 | 2.1% | 19,056 | 0.7% | 55,961 | 2.1% | |
| 7,822 | 0.6% | 17,538 | 1.4% | 2,731 | 0.2% | 4,266 | 0.3% | 4,347 | 0.3% | |
| 217,715 | 2.5% | 715,376 | 8.1% | 176,611 | 2.0% | 325,179 | 3.7% | 120,263 | 1.4% | |
| 590,890 | 28.7% | 12,754 | 0.6% | 6,621 | 0.3% | 4,841 | 0.2% | 338,297 | 16.4% | |
| 457,288 | 2.4% | 1,816,148 | 9.5% | 353,589 | 1.8% | 513,417 | 2.6% | 276,480 | 1.4% | |
| 486,960 | 5.1% | 105,104 | 1.2% | 105,066 | 1.1% | 46,307 | 0.5% | 56,683 | 0.6% | |
| 9,223 | 1.4% | 1,337 | 0.3% | 452 | 0.1% | 539 | 0.1% | 1,916 | 0.3% | |
| 172,029 | 1.5% | 108,941 | 1.0% | 22,756 | 0.2% | 17,571 | 0.2% | 33,377 | 0.3% | |
| 267,016 | 7.1% | 15,705 | 0.4% | 15,641 | 0.4% | 7,134 | 0.2% | 26,511 | 0.7% | |
| 369,817 | 9.7% | 14,342 | 0.4% | 18,190 | 0.5% | 9,648 | 0.3% | 38,065 | 1.0% | |
| 129,568 | 1.0% | 466,360 | 3.6% | 35,453 | 0.3% | 48,126 | 0.6% | 60,153 | 0.5% | |
| 9,090 | 0.9% | 71,627 | 6.8% | 23,817 | 2.3% | 14,013 | 1.3% | 12,108 | 1.2% | |
| 138,358 | 3.0% | 35,466 | 0.8% | 26,290 | 0.6% | 17,856 | 0.4% | 17,712 | 0.4% | |
| 13,839 | 1.7% | 1,827 | 0.2% | 2,891 | 0.4% | 617 | 0.1% | 2,945 | 0.4% | |
| 186,615 | 2.9% | 30,946 | 0.5% | 36,856 | 0.6% | 11,039 | 0.2% | 24,603 | 0.4% | |
| 7,951,193 | 31.6% | 190,470 | 0.8% | 420,683 | 1.7% | 133,808 | 0.5% | 764,767 | 3.0% | |
| 258,905 | 9.4% | 10,397 | 0.4% | 20,442 | 0.7% | 26,028 | 0.9% | 42,568 | 1.5% | |
| 2,534 | 0.4% | 3,053 | 0.5% | 671 | 0.1% | 1,204 | 0.2% | 1,746 | 0.3% | |
| 155,067 | 1.9% | 99,691 | 1.3% | 206,568 | 2.6% | 101,480 | 1.3% | 69,019 | 0.9% | |
| 601,768 | 8.9% | 34,401 | 0.5% | 33,661 | 0.5% | 20,742 | 0.3% | 65,218 | 1.0% | |
| 9,704 | 0.5% | 4,828 | 0.3% | 2,081 | 0.1% | 1,700 | 0.1% | 3,955 | 0.2% | |
| 244,248 | 4.3% | 51,805 | 0.9% | 10,616 | 0.2% | 9,675 | 0.2% | 19,712 | 0.3% | |
| 37,719 | 6.7% | 1,346 | 0.3% | 977 | 0.2% | 852 | 0.2% | 9,337 | 1.7% | |
| 31,798,258 | 10.3% | 7,823,966 | 2.6% | 3,998,280 | 1.3% | 2,769,434 | 0.9% | 4,087,656 | 1.3% | |
Race
Over half of the Hispanic and Latino American population self-identifies as White.[25] The largest number of White Hispanics come from within the Mexican community, the highest percentage of White Hispanics among major Hispanic groups comes from the Cuban American community, also high percentages of White Hispanics from Hispanic groups come from within the Argentine, Colombian and also Spanish communities. The largest number of Black Hispanics come from within the Puerto Rican community, while the highest percentage of Black Hispanics among major Hispanic groups come from the Dominican community. Significant numbers of Black Hispanics can also be found among the Central American communities.[26]
The largest number of Asian Hispanics come from within the Mexican community, while the highest percentage of Asian Hispanics come from the Peruvian community. The largest population of Native American Hispanic come from within the Mexican community and the highest percentage of Native American Hispanics among major Hispanic groups come from within the Guatemalan community.
Though comprising very small percentages of the Hispanic and Latino American population, and even smaller percentages of the total U.S. population, some of the preceding racial subgroups make up large minorities among the respective racial groups, overall. For instance, Hispanics and Latinos who are American Indian or Alaska Native compose 15% of all American Indians and Alaska Natives (per the ACS estimates). Meanwhile, the 120,000 Hispanics and Latinos who are of Native Hawaiian and Other Pacific Islander race compose 22% of this entire race nationally (per the Population Estimates). Again, nearly a third of the overall 'Two or more race' population is Hispanic or Latino (ACS).
| Race | Population | % of all Hispanics and Latinos |
|---|---|---|
| White | 26,735,713 | 53.0 |
| Some other race (Mestizo, Mulatto, etc.) | 18,503,103 | 36.7 |
| Two or more races | 3,042,592 | 6.0 |
| Black | 1,243,471 | 2.5 |
| American Indian and Alaska Native | 685,150 | 1.4 |
| Asian | 209,128 | 0.4 |
| Native Hawaiian and Pacific Islander | 58,437 | 0.1 |
| Total | 50,477,594 | 100.0 |
| Hispanic Group | Total | White | Black | American Indian and Alaska Native | Asian | Other (Some Other Race or Two or More Races or Native Hawaiian or Other Pacific Islander) |
|---|---|---|---|---|---|---|
| 31,798,258 100% |
16,794,111 52.8% |
296,778 0.9% |
460,098 1.4% |
101,654 0.3% |
14,145,617 44.6% | |
| 4,623,716 100% |
2,455,534 53.1% |
403,372 8.7% |
42,504 0.9% |
24,312 0.5% |
1,697,994 36.7% | |
| 1,785,547 100% |
1,525,521 85.4% |
82,398 4.6% |
3,002 0.2% |
4,391 0.2% |
170,235 9.6% | |
| 1,648,968 100% |
663,224 40.2% |
16,150 1.0% |
17,682 1.1% |
4,737 0.3% |
947,175 57.4% | |
| 1,414,703 100% |
419,016 29.6% |
182,005 12.9% |
19,183 1.4% |
4,056 0.3% |
790,443 55.8% | |
| 1,044,209 100% |
401,763 38.5% |
11,471 1.1% |
31,197 3.0% |
2,386 0.2% |
597,392 57.2% | |
| All other | 4,087,656 100% |
2,018,397 49.4% |
112,521 2.8% |
75,976 1.9% |
50,299 1.2% |
1,830,463 44.9% |
| Total | 50,477,594 100% |
26,735,713 53.0% |
1,243,471 2.5% |
685,150 1.4% |
209,128 0.4% |
21,604,132 42.8% |
Sexuality
According to a Gallup survey conducted from June to September 2012, it found that 4 percent of Hispanic and Latino Americans self identify as LGBT; this is greater than the estimated 3.4 percent of American adults that self identify as LGBT in the total population,[28] but the difference is well within the margin of error for the number of LGBT Latinos in the 121 000 sample population of the survey.
Socioeconomic status
Education
According to the U.S Census Bureau, Hispanics are among the least educated ethnic group. In 2000, about 530,000 Hispanics and Latinos 16–19 years of age were high school dropouts, yielding a dropout rate of 21.1 percent for all Hispanics and Latinos.[29]
11 percent of Hispanics/Latinos have earned a bachelor's degree or higher, compared with 17 percent of non-Hispanic blacks, 30 percent of non-Hispanic whites, and 49 percent of Asian Americans.[30] Often, Hispanic and Latino youth begin schooling without the necessary economic and social resources that other children have. One frequent cause is their being the children of immigrant parents with low socioeconomic status and language barriers that result in a lack of knowledge about the U.S. education system. These unfavorable conditions frequently spawn others, such as weak parent-teacher relationships.
The overall average years of schooling for Hispanics and Latinos (10.5) does not include high school graduation (12 years). There is a notable education gap between foreign-born Hispanics, who have more difficulties with language barriers, and U.S.-born Hispanics. The latter only lag non-Hispanic Whites by 1.3 years of schooling, and nearly tie African Americans, as seen in the table below.
Table 1[31]
Average Years of Schooling, by Gender, Ethnicity, and Nativity Men, by Nativity Women, by Nativity
Ethnicity All Foreign-Born US Born All Foreign-Born US Born Whites 13.6 13.6 Black 12.4 12.8 All Hispanics 10.5 9.5 12.2 10.8 9.8 12.4 Mexicans 9.8 8.5 12.1 10.1 8.6 12.2 Puerto Ricans 11.7 11.2 12.4 12.0 11.4 12.7 Cubans 12.7 12.4 13.6 12.9 12.5 14.2
(NOTE: The samples include individuals ages 25 to 59.)
Hispanics can also attend to Hispanic-serving institution, institutions that are part of a federal program designed to assist colleges or universities in the United States that attempt to assist first generation, majority low income Hispanic students. There are over 250 schools that have been designated as an HSI.
Employment
Employment and earnings are a measure of labor market success, and depend on educational attainment. Given the lower level of education of the Hispanic or Latino population and the growing need for a college degree for entry-level jobs, Hispanics and Latinos are behind when entering into the labor force. The annual employment rate is defined as the percentage of individuals who worked any period of time during the calendar year.[32] Although Hispanics do not lag behind non-Hispanic blacks when it comes to employment rates, they do lag non-Hispanic whites. There is a major gap between male and female rates in Hispanics due to high fertility rates and female absence from the labor force to give birth. Furthermore, nativity plays a major role in employment rates because U.S. born Hispanics are more accustomed to the U.S. labor market.
Table2[33]
Annual Employment Rates (Percentages), by Gender, Ethnicity and Nativity
Men, by Nativity Women, by Nativity
Ethnicity All Foreign-Born US Born All Foreign-Born US Born Whites 91.8 80.2 Blacks 77.4 77.7 Hispanics 86.8 87.5 85.6 67.0 61.2 76.3 Mexicans 87.8 88.5 86.5 64.7 56.1 76.4 Puerto Ricans 80.0 76.6 83.8 67.7 60.8 75.5 Cubans 87.3 86.8 89.1 74.7 72.5 82.5 |} (NOTE: The samples include individuals ages 25 to 59.)
Earnings
In 2006, adults 18 and older with a master's, professional, or doctoral degree earned an average of $79,946, while those with less than a high school diploma earned about $19,915.[34]
Hispanic and Latino median earnings are significantly lower than the median earnings of the total U.S. population, a result of the lower education levels of the former group. Yet, there are other causes of the earnings gap besides education. A report released by the Census Bureau in 2003 estimated that the average lifetime earnings of Hispanics with an advanced degree are $500,000 less than those of non-Hispanic whites with an equivalent education.
Homeownership
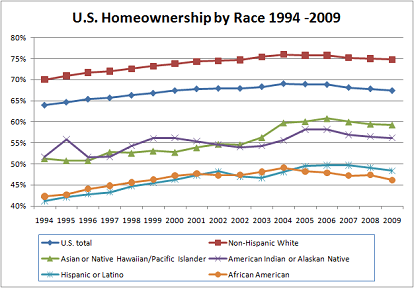
Hispanic homeownership in 2016 is 45.6, around half of every Hispano-American lives in their own house.[36]
Poverty
Estimates show that about 22 percent of the Hispanic and Latino population is below the poverty level, with the rate being higher for children, while 8.3 percent of non-Hispanic whites and about 25 percent of African American remain under the poverty level as well.[37]
See also
- List of California communities with Hispanic majority populations in the 2010 census
- Demographics of the United States
- List of Mexican-American communities
- List of Puerto Rican-American communities
Notes
- ↑ Mann, Denise (2010-10-14). "Hispanics Have Highest Life Expectancy in U.S.". WebMD. Retrieved 2010-11-24.
- ↑ "S0201. Selected Population Profile in the United States; Hispanic or Latino (of any race)". 2009 American Community Survey 1-Year Estimates. U.S. Census Bureau. Retrieved 2010-11-24.
- ↑ "B03001. Hispanic or Latino origin by specific origin". 2009 American Community Survey 1-Year Estimates. U.S. Census Bureau.
- ↑ "B03002. Hispanic or Latino origin by race". 2009 American Community Survey 1-Year Estimates. U.S. Census Bureau. Retrieved 2010-11-24.
- ↑ "B03003. Hispanic or Latino origin [nation, regions, and seven southwestern states]". 2009 American Community Survey 1-Year Estimates. U.S. Census Bureau. Retrieved 2010-11-24.
- ↑ https://www.insidehighered.com/blogs/world-view/studying-argentina-free
- ↑ http://www.dailytexanonline.com/opinion/2013/07/11/us-can-learn-from-strengths-weaknesses-of-latin-american-universities
- ↑ http://usatoday30.usatoday.com/news/education/2010-07-30-poll-hispanic-college_N.htm
- ↑ https://www.nps.gov/heritageinitiatives/latino/latinothemestudy/education.htm
- ↑ http://www.pewhispanic.org/2012/08/20/iii-hispanic-college-enrollments/
- ↑ US Census Bureau: "Redistricting Data, First Look at Local 2010 Census Results"
- ↑ US Census Bureau: "Population by Race and Hispanic or Latino Origin, for the United States, Regions, Divisions, and States, and for Puerto Rico: 2000"
- ↑ US Census Bureau Public Information Office. "Most Children Younger Than Age 1 are Minorities, Census Bureau Reports - Population - Newsroom - U.S. Census Bureau". Retrieved 5 March 2015.
- 1 2 "T1. Population Estimates [10]; Data Set: 2007 Population Estimates". United States Census Bureau. Archived from the original on September 16, 2008. Retrieved 2008-04-30.
- ↑ "US Census Press Releases". United States Census Bureau. 2008-07-16. Retrieved 2008-04-30.
- ↑ USA Today: "Census: Hispanics surpass blacks in most U.S. metros" April 14, 2011
- ↑ "Table 4. Projections of the Population by Sex, Race, and Hispanic Origin for the United States: 2010 to 2050" (Excel). U.S. Census Bureau. Retrieved 2010-10-24.
- ↑ "Ten Places with Highest Percent Hispanic: 2000". U.S. Census Bureau. Retrieved 2009-04-05.
- ↑ "US Census Press Releases; More Than 300 Counties Now "Majority-Minority"". United States Census Bureau. Archived from the original on October 25, 2008. Retrieved 2008-05-18.
- ↑ "Los Angeles County, California – ACS Demographic and Housing Estimates: 2006". United States Census Bureau. Retrieved 2008-05-18.
- ↑ "Census 2010 News | U.S. Census Bureau Releases 2010 Census Ethnic Counts for the U.S. Virgin Islands". 2010.census.gov. Retrieved March 23, 2013.
- ↑ 2010 Census
- ↑ US Census Bureau: "Redistricting Data, First Look at Local 2010 Census Results"
- ↑ US Census Bureau: "Population by Race and Hispanic or Latino Origin, for the United States, Regions, Divisions, and States, and for Puerto Rico: 2000"
- ↑ "B03002. Hispanic or Latino origin by race". 2007 American Community Survey 1-Year Estimates. United States Census Bureau. while the ratio rises to 92% in the Population Estimates Program, which are the official estimates."T4-2007. Hispanic or Latino By Race [15]". 2007 Population Estimates. United States Census Bureau.
- ↑ "The Hispanic Population, 2010" (PDF). United States Census Bureau. May 2011.
- ↑ Humes, Karen R.; Jones, Nicholas A.; Ramirez, Roberto R. "Overview of Race and Hispanic Origin: 2010" (PDF). U.S. Census Bureau. Retrieved 2011-03-28.
- ↑ David Crary (18 October 2012). "Gallup study: 3.4 percent of US adults are LGBT". WTOP. Associated Press. Retrieved 23 October 2012.
- ↑ US Census Bureau, 2003
- ↑ Tienda, 180
- ↑ SOURCE: 2000 Census, 5% Public Use Microdata Samples (PUMS). Tienda, Marta (Editor). Hispanics and the Future of America. Washington, DC, USA: National Academies Press, 2006. p 230.
- ↑ Tienda, 235
- ↑ 2000 census, 5% PUMS. Tienda, Marta (Editor). Hispanics and the Future of America. Washington, DC, USA: National Academies Press, 2006. p 235.
- ↑ US Census Bureau, 2006
- ↑ "US Census Bureau, homeownership by race". Retrieved 2006-10-06.
- ↑ http://www.housingwire.com/articles/36524-hispanic-homeownership-on-the-rise
- ↑ US Census, 2005
References
- Brindis C.D., Driscoll A.K., Biggs M.A. & Valderrama L.T. 2002. Fact Sheet on Latino Youth: Income & Poverty.
- Firestone, Juanita M. and Harris, Richard J.; "Educational and Occupational Attainment".
- Marcelo, M Suárez-Orozco and Páez Mariela; (2002) Latinos: Remaking America. University of California Press. ISBN 0-520-23486-3
- Tienda, Marta and Mitchell, Faith; (Eds). (2006) Hispanics and the Future of America. Washington, DC: National Academies Press. ISBN 0-309-10051-8
- US Census Bureau. (2007). Earnings Gap by Census Bureau Data on Educational Attainment.
- US Census Bureau. (2006). US Hispanic Population:2006 Power Point.
Further reading
- Card, David & Ethan G. Lewis (2007). "The Diffusion of Mexican Immigrants during the 1990s: Explanations and Impacts". In Borjas, George J. (Editor). Mexican Immigration to the United States. Chicago, IL: University of Chicago Press. ISBN 978-0-226-06632-5.
- Masud-Piloto, Felix Roberto (1996). From Welcomed Exiles to Illegal Immigrants: Cuban Migration to the U.S., 1959-1995. Lanham, MD: Rowman & Littlefield. ISBN 0-8476-8148-3.