Demographics of Guinea-Bissau
This article is about the demographic features of the population of Guinea-Bissau, including population density, ethnicity, education level, health of the populace, economic status, religious affiliations and other aspects of the population.
Ethnic groups
The population of Guinea-Bissau is ethnically diverse with distinct languages, customs, and social structures. Most Guineans, 99%, are Blacks — mostly Fula and Mandinka-speakers concentrated in the north and northeast, the Balanta and Papel, living in the southern coastal regions, and the Manjaco and Mancanha, occupying the central and northern coastal areas.
Most of the rest are mestiços of mixed Portuguese and black descent, including Cape Verdean minority. Due to the exodus of most Portuguese settlers after independence, less than 1% of Guinea-Bissauans are pure Portuguese. The country also has a Chinese minority, including Macanese people of mixed Portuguese and Chinese blood from Macau.
Most people are farmers. 50% are Muslims - this makes Guinea-Bissau the only Portuguese-speaking nation with a Muslim majority and most Muslims are Sunnis. 40% are pagans, principally the Balanta. Less than 10% are Christians, mostly Roman Catholics.
Population
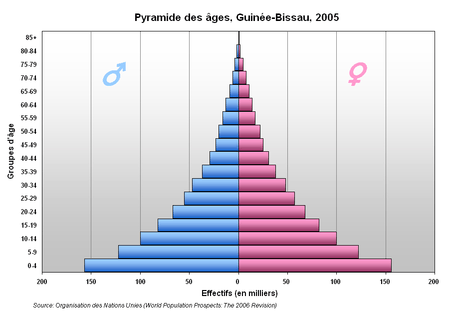
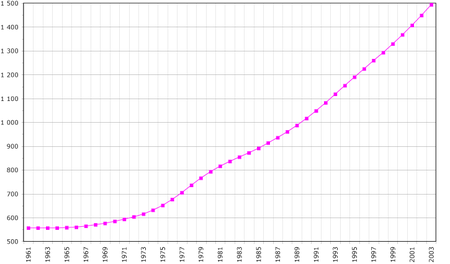
According to the 2010 revision of the UN World Population Prospects, Guinea-Bissau's population was 1,515,000 in 2010, compared to 518,000 in 1950.[1] The proportion of the population below the age of 15 in 2010 was 41.3%, 55.4% were aged between 15 and 65 years of age, while 3.3% were aged 65 years or older.[1]
| Total population (x 1000) | Population aged 0–14 (%) | Population aged 15–64 (%) | Population aged 65+ (%) | |
|---|---|---|---|---|
| 1950 | 518 | 38.8 | 57.6 | 3.6 |
| 1955 | 566 | 41.9 | 54.9 | 3.2 |
| 1960 | 593 | 41.3 | 55.7 | 3.0 |
| 1965 | 598 | 41.3 | 55.6 | 3.1 |
| 1970 | 603 | 37.0 | 59.7 | 3.3 |
| 1975 | 694 | 41.0 | 55.7 | 3.3 |
| 1980 | 835 | 42.1 | 54.4 | 3.5 |
| 1985 | 922 | 45.4 | 51.1 | 3.5 |
| 1990 | 1 017 | 43.8 | 52.8 | 3.5 |
| 1995 | 1 125 | 44.1 | 52.6 | 3.4 |
| 2000 | 1 241 | 43.1 | 53.6 | 3.3 |
| 2005 | 1 368 | 42.4 | 54.4 | 3.2 |
| 2010 | 1 515 | 41.3 | 55.4 | 3.3 |
Vital statistics
Registration of vital events is in Guinea-Bissau not complete. The Population Departement of the United Nations prepared the following estimates. [1]
| Period | Live births per year | Deaths per year | Natural change per year | CBR* | CDR* | NC* | TFR* | IMR* |
|---|---|---|---|---|---|---|---|---|
| 1950-1955 | 30 000 | 18 000 | 12 000 | 54.9 | 33.5 | 21.4 | 7.41 | 211 |
| 1955-1960 | 25 000 | 17 000 | 7 000 | 42.3 | 29.5 | 12.8 | 5.88 | 201 |
| 1960-1965 | 25 000 | 16 000 | 9 000 | 42.3 | 27.4 | 14.9 | 5.88 | 191 |
| 1965-1970 | 21 000 | 15 000 | 6 000 | 35.6 | 24.8 | 10.8 | 4.78 | 182 |
| 1970-1975 | 36 000 | 18 000 | 18 000 | 55.7 | 27.3 | 28.4 | 7.34 | 174 |
| 1975-1980 | 35 000 | 19 000 | 15 000 | 45.5 | 25.3 | 20.3 | 6.11 | 165 |
| 1980-1985 | 42 000 | 21 000 | 21 000 | 47.9 | 23.5 | 24.4 | 6.70 | 153 |
| 1985-1990 | 44 000 | 21 000 | 23 000 | 45.8 | 22.1 | 23.7 | 6.68 | 145 |
| 1990-1995 | 48 000 | 23 000 | 26 000 | 45.2 | 21.2 | 24.0 | 6.54 | 141 |
| 1995-2000 | 51 000 | 24 000 | 27 000 | 42.8 | 19.9 | 22.9 | 6.05 | 134 |
| 2000-2005 | 54 000 | 24 000 | 29 000 | 41.1 | 18.5 | 22.5 | 5.66 | 126 |
| 2005-2010 | 57 000 | 25 000 | 32 000 | 39.3 | 17.5 | 21.9 | 5.27 | 119 |
| * CBR = crude birth rate (per 1000); CDR = crude death rate (per 1000); NC = natural change (per 1000); IMR = infant mortality rate per 1000 births; TFR = total fertility rate (number of children per woman) | ||||||||
CIA World Factbook demographic statistics
The following demographic statistics are from the CIA World Factbook, unless otherwise indicated.
Population
- 1,596,677 (July 2011 est.)
Population growth rate
- 1.988% (2011 est.)
Sex ratio
- at birth: 1.03 male(s)/female
- 0-14 years: 1 male(s)/female
- 15-24 years: 0.98 male(s)/female
- 25-54 years: 0.99 male(s)/female
- 55-64 years: 0.6 male(s)/female
- 65 years and over: 0.6 male(s)/female
- total population: 0.95 male(s)/female (2015 est.)
Life expectancy at birth
- total population: 50.23 years
- male: 48.21 years
- female: 52.31 years (2015 est.)
Nationality
- noun:Guinean (s)
- adjective:Guinean
Ethnic groups[2]
- Fulani 28.5%
- Balanta 22.5%
- Mandinga 14.7%
- Papel 9.1%
- Manjaco 8.3%
- Beafada 3.5%
- Mancanha 3.1%
- Bijago 2.1%
- Felupe 1.7%
- Mansoanca 1.4%
- Balanta Mane 1%
- Other 1.8%
- None 2.2%
Religions[2]
Languages[2]
- Crioulo 90.4%
- Portuguese 27.1% (official)
- French 5.1%
- English 2.9%
- Other 2.4%
Literacy
- definition: age 15 and over can read and write
- total population: 59.9%
- male: 71.8%
- female: 48.3% (2015 est.)
References
| Wikimedia Commons has media related to Demographics of Guinea-Bissau. |
Guinea-Bissau articles | |||||||
|---|---|---|---|---|---|---|---|
| History |  | ||||||
| Geography | |||||||
| Politics | |||||||
| Economy | |||||||
| Society |
| ||||||
| |||||||