Demographics of Guadeloupe
Guadeloupe has a population of 403,977 (2012).[1]
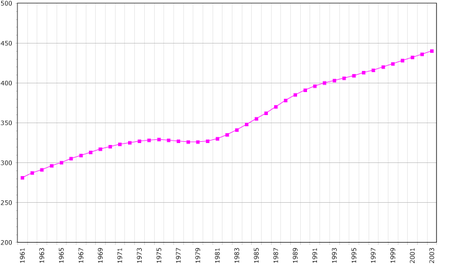
Population
According to INSEE Guadeloupe has an estimated population of 403,977 on January 1, 2012.[1] Life expectancy at birth is 77.0 years for males, and 83.5 for females (figures for 2011).[1]
Languages
French is the official language, taught in the school system. Antillean Creole French is spoken by a large part of the population, understood by nearly all, and taught in some schools. A 2007 document issued by the International Organization of la Francophonie estimated the population to be 80.2% "francophone" and 14.9% "partially francophone".[2]
Vital statistics
The following vital statistics include Saint Martin and Saint Barthélemy.[1][3]
| Census population[1] and average annual growth rate | ||
|---|---|---|
| Year | Pop. | ±% p.a. |
| 1664 | 11,437 | — |
| 1789 | 106,593 | +1.80% |
| 1879 | 174,231 | +0.55% |
| 1961 | 276,545 | +0.56% |
| 1967 | 305,312 | +1.66% |
| 1974 | 315,848 | +0.49% |
| 1982 | 317,269 | +0.06% |
| 1990 | 353,431 | +1.36% |
| 1999 | 386,256 | +0.99% |
| 2009 | 401,554 | +0.39% |
| The results do not include Saint Martin and Saint Barthélemy | ||
| Population(01.01) | Live births | Deaths | Natural change | Crude birth rate (per 1000) | Crude death rate (per 1000) | Natural change (per 1000) | Total fertility rate | |
|---|---|---|---|---|---|---|---|---|
| 1950 | 210 | 7 702 | 2 912 | 4 790 | 37.3 | 13.7 | 23.7 | |
| 1951 | 213 | 8 319 | 2 893 | 5 426 | 38.8 | 14.2 | 24.6 | |
| 1952 | 217 | 8 463 | 3 221 | 5 242 | 38.3 | 14.3 | 24.0 | |
| 1953 | 223 | 8 720 | 2 879 | 5 841 | 39.6 | 11.6 | 27.9 | |
| 1954 | 229 | 8 941 | 2 648 | 6 293 | 39.4 | 11.0 | 28.5 | |
| 1955 | 236 | 9 506 | 2 769 | 6 737 | 39.8 | 11.2 | 28.6 | |
| 1956 | 244 | 9 648 | 2 449 | 7 199 | 39.8 | 10.0 | 29.8 | |
| 1957 | 252 | 9 401 | 2 852 | 6 549 | 39.1 | 10.6 | 28.5 | |
| 1958 | 260 | 9 864 | 2 469 | 7 395 | 38.4 | 9.9 | 28.4 | |
| 1959 | 268 | 9 815 | 2 359 | 7 456 | 37.5 | 8.7 | 28.8 | |
| 1960 | 275 | 10 479 | 2 657 | 7 822 | 38.4 | 9.7 | 28.7 | |
| 1961 | 281 | 10 047 | 2 367 | 7 680 | 36.5 | 8.2 | 28.3 | |
| 1962 | 287 | 10 890 | 2 348 | 8 542 | 37.3 | 8.5 | 28.8 | |
| 1963 | 291 | 10 712 | 2 400 | 8 312 | 35.4 | 8.3 | 27.1 | |
| 1964 | 296 | 10 424 | 2 345 | 8 079 | 34.4 | 8.1 | 26.4 | |
| 1965 | 300 | 10 605 | 2 558 | 8 047 | 34.8 | 8.1 | 26.8 | |
| 1966 | 304 | 10 879 | 2 497 | 8 382 | 33.7 | 7.9 | 25.7 | |
| 1967 | 309 | 10 116 | 2 581 | 7 535 | 31.7 | 7.9 | 23.8 | |
| 1968 | 313 | 10 476 | 2 564 | 7 912 | 31.9 | 7.6 | 24.3 | |
| 1969 | 316 | 9 724 | 2 442 | 7 282 | 29.0 | 7.7 | 21.3 | |
| 1970 | 319 | 9 397 | 2 499 | 6 898 | 28.9 | 7.8 | 21.1 | |
| 1971 | 322 | 10 060 | 2 337 | 7 723 | 29.7 | 7.0 | 22.6 | |
| 1972 | 324 | 9 912 | 2 458 | 7 454 | 28.4 | 7.3 | 21.2 | |
| 1973 | 326 | 9 578 | 2 548 | 7 030 | 26.3 | 7.4 | 18.9 | |
| 1974 | 327 | 8 846 | 2 459 | 6 387 | 24.6 | 7.4 | 17.2 | |
| 1975 | 328 | 8 257 | 2 351 | 5 906 | 22.9 | 7.1 | 15.8 | |
| 1976 | 327 | 6 926 | 2 395 | 4 531 | 19.5 | 7.2 | 12.3 | |
| 1977 | 326 | 6 321 | 2 297 | 4 024 | 17.9 | 6.8 | 11.1 | |
| 1978 | 325 | 5 640 | 2 163 | 3 477 | 16.4 | 6.7 | 9.7 | |
| 1979 | 324 | 5 818 | 2 154 | 3 664 | 17.2 | 6.5 | 10.7 | |
| 1980 | 326 | 6 425 | 2 143 | 4 282 | 18.1 | 6.6 | 11.5 | |
| 1981 | 329 | 6 486 | 2 141 | 4 345 | 18.2 | 6.4 | 11.8 | |
| 1982 | 334 | 6 616 | 2 099 | 4 517 | 18.2 | 6.4 | 11.8 | |
| 1983 | 340 | 6 722 | 2 206 | 4 516 | 18.5 | 6.6 | 11.9 | |
| 1984 | 347 | 6 671 | 2 235 | 4 436 | 18.3 | 6.4 | 11.9 | |
| 1985 | 354 | 6 750 | 2 309 | 4 441 | 18.2 | 6.5 | 11.7 | |
| 1986 | 360 | 6 374 | 2 238 | 4 136 | 17.7 | 6.2 | 11.5 | |
| 1987 | 367 | 6 855 | 2 244 | 4 611 | 18.6 | 6.2 | 12.4 | |
| 1988 | 374 | 7 126 | 2 228 | 4 898 | 18.7 | 6.0 | 12.7 | |
| 1989 | 380 | 7 645 | 2 315 | 5 330 | 19.3 | 6.1 | 13.2 | |
| 1990 | 385 | 7 569 | 2 334 | 5 235 | 19.7 | 6.1 | 13.6 | |
| 1991 | 389 | 7 547 | 2 242 | 5 305 | 19.4 | 5.8 | 13.6 | |
| 1992 | 393 | 7 310 | 2 360 | 4 950 | 18.6 | 6.0 | 12.6 | |
| 1993 | 396 | 7 056 | 2 406 | 4 650 | 17.8 | 6.1 | 11.7 | |
| 1994 | 399 | 7 249 | 2 328 | 4 921 | 18.1 | 5.8 | 12.3 | |
| 1995 | 403 | 7 086 | 2 470 | 4 616 | 17.6 | 6.1 | 11.5 | |
| 1996 | 407 | 7 256 | 2 459 | 4 797 | 17.8 | 6.0 | 11.8 | |
| 1997 | 412 | 7 554 | 2 441 | 5 113 | 18.3 | 5.9 | 12.4 | |
| 1998 | 416 | 7 208 | 2 517 | 4 691 | 17.3 | 6.0 | 11.3 | |
| 1999 | 385 609* | 7 452 | 2 664 | 4 788 | 17.7 | 6.3 | 11.4 | 2.10 |
| 2000 | 425 | 7 601 | 2 634 | 4 967 | 17.9 | 6.2 | 11.7 | 2.18 |
| 2001 | 430 | 7 658 | 2 608 | 5 050 | 17.8 | 6.1 | 11.8 | 2.23 |
| 2002 | 433 | 7 032 | 2 765 | 4 267 | 16.2 | 6.4 | 9.8 | 2.07 |
| 2003 | 437 | 7 047 | 2 662 | 4 385 | 16.1 | 6.1 | 10.0 | 2.11 |
| 2004 | 441 | 7 273 | 2 676 | 4 597 | 16.5 | 6.1 | 10.4 | 2.26 |
| 2005 | 444 | 7 551 | 2 904 | 4 647 | 17.0 | 6.5 | 10.5 | 2.37 |
| 2006 | 447 | 7 193 | 2 902 | 4 291 | 16.1 | 6.5 | 9.6 | 2.33 |
| 2007 | 450 | 6 862 | 2 769 | 4 093 | 15.2 | 6.2 | 9.1 | 2.27 |
| 2008 | 453 | 6 758 | 2 916 | 3 842 | 14.9 | 6.4 | 8.5 | 2.20 |
| 2009 | 456 | 6 387 | 2 987 | 3 400 | 14.0 | 6.6 | 7.5 | 2.13 |
| 2010 | 459 | 6 242 | 3 095 | 3 147 | 13.6 | 6.7 | 6.9 | 2.11 |
| 2011 | 461 | 6 284 | 2 965 | 3 319 | 13.6 | 6.4 | 7.2 | 2.17 |
| 2012 | 403 314* | 6 133 | 3 003 | 3 130 | 13.2 | 6.5 | 6.8 | |
| 2013 | 403 645* | 5 069 | 2 951 | 2 118 | 12.6 | 7.3 | 5.3 | 2.17 |
| 2014 | 403 750* |
- Excluding data for Saint Barthelemy and Saint Martin
Structure of the population [4]
Structure of the population (01.01.2010) (Provisional estimates) (Excluding data for Saint Barthelemy and Saint Martin) :
| Age Group | Male | Female | Total | % |
|---|---|---|---|---|
| Total | 186 946 | 214 838 | 401 784 | 100 |
| 0-4 | 13 809 | 12 996 | 26 805 | 6,67 |
| 5-9 | 15 175 | 14 109 | 29 284 | 7,29 |
| 10-14 | 16 306 | 15 377 | 31 683 | 7,89 |
| 15-19 | 15 755 | 15 037 | 30 792 | 7,66 |
| 20-24 | 10 649 | 10 440 | 21 089 | 5,25 |
| 25-29 | 7 826 | 10 264 | 18 090 | 4,50 |
| 30-34 | 8 654 | 12 726 | 21 380 | 5,32 |
| 35-39 | 12 372 | 17 029 | 29 401 | 7,32 |
| 40-44 | 13 848 | 18 229 | 32 077 | 7,98 |
| 45-49 | 15 179 | 17 619 | 32 798 | 8,16 |
| 50-54 | 13 007 | 14 572 | 27 579 | 6,86 |
| 55-59 | 10 979 | 13 036 | 24 015 | 5,98 |
| 60-64 | 9 991 | 11 635 | 21 626 | 5,38 |
| 65-69 | 7 342 | 9 028 | 16 370 | 4,07 |
| 70-74 | 5 914 | 7 384 | 13 298 | 3,31 |
| 75-79 | 4 505 | 6 073 | 10 578 | 2,63 |
| 80-84 | 2 931 | 4 424 | 7 355 | 1,83 |
| 85-89 | 1 844 | 2 913 | 4 757 | 1,18 |
| 90-94 | 605 | 1 335 | 1 940 | 0,48 |
| 95+ | 255 | 612 | 867 | 0,22 |
| Age group | Male | Female | Total | Percent |
|---|---|---|---|---|
| 0-14 | 45 290 | 42 482 | 87 772 | 21,85 |
| 15-64 | 118 260 | 140 587 | 258 847 | 64,42 |
| 65+ | 23 396 | 31 769 | 55 165 | 13,73 |
See also
References
- 1 2 3 4 5 Institut national de la statistique et des études économique
- ↑ French: La Francophonie dans le monde, Organisation internationale de la francophonie, p.17
- ↑ United nations. Demographic Yearbooks
- ↑ http://unstats.un.org/unsd/demographic/products/dyb/dyb2.htm