Demographics of Colombia
| Demographics of Colombia | |
|---|---|
|
Tota Lake | |
| Population | 48,301,354 (at 2015)(28th)[1] |
| Density | 42.25 inhab/sq km (72nd) |
| Growth rate |
|
| Birth rate | 18.9 births/1,000 population (111th) |
| Death rate | 5.8/1,000 population (178th) |
| Life expectancy | 79 (34th) |
| • male | 76 (37th) |
| • female | 83 (22nd) |
| Fertility rate | 2.30 children/woman (103rd) |
| Net migration rate |
|
| Age structure | |
| 0–14 years | 26.7% |
| 15–64 years | 65.6% |
| 65 and over | 7.6% |
| Sex ratio | |
| Total | 1.03 male(s)/female |
| Under 15 | 1.02 male(s)/female |
| 15–64 years | 0.95 male(s)/female |
| 65 and over | 0.75 male(s)/female |
| Language | |
| Spoken | Spanish |
This article is about the demographic features of the population of Colombia, including population density, ethnicity, education level, health of the populace, economic status, religious affiliations and other aspects of the population.
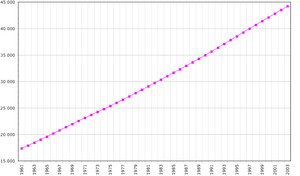
The Demography of Colombia is characterized for being the third-most populous country in Latin America, after Mexico and Brazil. Colombia experienced rapid population growth like most countries, but four decades of an armed conflict pushed millions of Colombians out of the country. However, a rebound economy in the 2000s in urban centres (perhaps the most urbanized Latin American nation) improved the situation of living standards for Colombians in a traditional class stratified economy. In the years following 2002 the safety has been improving throughout the country. Young citizens now invest in education so they can stay and contribute to the country's future.
Census
| Population census | ||
|---|---|---|
| Year | Pop. | ±% p.a. |
| 1864 | 1,694,487 | — |
| 1870 | 2,681,637 | +7.95% |
| 1905* | 4,533,777 | +1.51% |
| 1912 | 5,472,604 | +2.73% |
| 1918 | 5,855,077 | +1.13% |
| 1928 | 7,851,110 | +2.98% |
| 1938** | 8,701,816 | +1.03% |
| 1951 | 11,228,509 | +1.98% |
| 1964 | 17,848,508 | +3.63% |
| 1973 | 20,666,920 | +1.64% |
| 1985 | 27,867,326 | +2.52% |
| 1993 | 33,109,840 | +2.18% |
| 2005 | 42,888,592 | +2.18% |
| 2015 | 48,203,405 | +1.18% |
| Note: Diverse sources Census respective year DANE *First census after 35 years **First modern census Source: DANEDANE Simple | ||
2005 Census
According to the 2005 census, there are 46,219,699 Colombians in the world (42,888,592 living in the national territory and 3,331,107 living abroad). On 2005 there was 3,378,345 Colombians living permanently on exterior. More recently, according with MRE estimates this indicator may ascends to 4,700,000 on 2012.[3]
| # | Department | Capital | Area | Population |
|---|---|---|---|---|
| 1 | Amazonas | Leticia | 109,665 km² | 56,036 |
| 2 | Antioquia | Medellín | 63,612 km² | 5,671,689 |
| 3 | Arauca | Arauca | 23,818 km² | 208,605 |
| 4 | Atlántico | Barranquilla | 3,388 km² | 2,112,128 |
| 5 | Bogotá, Distrito Capital | Bogotá | 1,587 km² | 6,778,691 (not metropolitan) |
| 6 | Bolívar | Cartagena | 25,978 km² | 1,860,445 |
| 7 | Boyacá | Tunja | 23,189 km² | 1,211,186 |
| 8 | Caldas | Manizales | 7,888 km² | 908,841 |
| 9 | Caquetá | Florencia | 88,965 km² | 404,896 |
| 10 | Casanare | Yopal | 44,640 km² | 282,452 |
| 11 | Cauca | Popayán | 29,308 km² | 1,244,886 |
| 12 | Cesar | Valledupar | 22,905 km² | 879,914 |
| 13 | Chocó | Quibdó | 46,530 km² | 441,395 |
| 14 | Córdoba | Montería | 25,020 km² | 1,472,699 |
| 15 | Cundinamarca | Bogotá | 24,210 km² | 2,228,478 (without Bogotá) |
| 16 | Guainía | Inirida | 72,238 km² | 30,232 |
| 17 | Guaviare | San José del Guaviare | 53,460 km² | 81,411 |
| 18 | Huila | Neiva | 19,890 km² | 1,006,797 |
| 19 | La Guajira | Riohacha | 20,848 km² | 623,250 |
| 20 | Magdalena | Santa Marta | 23,188 km² | 1,136,901 |
| 21 | Meta | Villavicencio | 85,635 km² | 789,276 |
| 22 | Nariño | Pasto | 33,268 km² | 1,531,777 |
| 23 | Norte de Santander | Cúcuta | 21,658 km² | 1,228,028 |
| 24 | Putumayo | Mocoa | 24,885 km² | 299,286 |
| 25 | Quindío | Armenia | 1,845 km² | 518,691 |
| 26 | Risaralda | Pereira | 4,140 km² | 863,663 |
| 27 | San Andrés and Providencia | San Andrés | 52 km² | 59,573 |
| 28 | Santander | Bucaramanga | 30,537 km² | 1,916,336 |
| 29 | Sucre | Sincelejo | 10,670 km² | 765,285 |
| 30 | Tolima | Ibagué | 23,562 km² | 1,335,177 |
| 31 | Valle del Cauca | Cali | 22,140 km² | 4,060,196 |
| 32 | Vaupés | Mitú | 54,135 km² | 27,124 |
| 33 | Vichada | Puerto Carreño | 100,242 km² | 55,158 |
| Total | 1,141,748 km² | 42,888,592 | ||
20th and 21st centuries
Colombian census from 1912:[4]
- On 1912 census estimated 5,472,604 inhabitants.
- On 1918 census estimated 5,855,077 inhabitants.
- On 1928 census estimated 7,851,110 inhabitants.
- On 1938 census estimated 8,697,041 inhabitants.
- On 1951 census estimated 12,739,910 inhabitants.
- On 1964 census estimated 18,337,973 inhabitants.
- On 1973 census estimated 23,881,851 inhabitants.
- On 1985 census estimated 31,593,587 inhabitants.
- On 1993 census estimated 37,422,791 inhabitants.
- On 2005 census estimated 42,888,592 inhabitants.
- On 2016 census will estimate inhabitants.[5]
UN estimates
According to the 2015 revision of the World Population Prospects the total population was 48,229,000 in 2015, compared to only 12,342,000 in 1950. The proportion of children below the age of 15 in 2015 was 24.3%, 68.7% was between 15 and 65 years of age, while 7% was 65 years or older .[6]
| Total population (x 1000) |
Proportion aged 0–14 (%) |
Proportion aged 15–64 (%) |
Proportion aged 65+ (%) | |
|---|---|---|---|---|
| 1950 | 12 341 | 42.6 | 54.0 | 3.4 |
| 1955 | 14 225 | 44.8 | 52.0 | 3.2 |
| 1960 | 16 480 | 46.4 | 50.4 | 3.2 |
| 1965 | 19 144 | 46.9 | 49.9 | 3.2 |
| 1970 | 22 061 | 45.9 | 50.7 | 3.4 |
| 1975 | 24 757 | 43.4 | 53.0 | 3.6 |
| 1980 | 27 738 | 40.6 | 55.7 | 3.7 |
| 1985 | 31 012 | 37.9 | 58.2 | 3.9 |
| 1990 | 34 272 | 36.3 | 59.6 | 4.1 |
| 1995 | 37 442 | 34.3 | 61.3 | 4.4 |
| 2000 | 40 404 | 31.5 | 63.8 | 4.7 |
| 2005 | 43 286 | 28.9 | 65.9 | 5.2 |
| 2010 | 45 918 | 26.4 | 67.8 | 5.9 |
| 2015 | 48 229 | 24.3 | 68.7 | 7.0 |
Structure of the population[7]
Structure of the population (01.07.2013) (Estimates) (Data are revised projections taking into consideration also the results of 2005 census) :
| Age Group | Male | Female | Total | % |
|---|---|---|---|---|
| Total | 23,264,039 | 23,857,050 | 47,121,089 | 100 |
| 0–4 | 2,199,694 | 2,100,031 | 4,299,725 | 9.12 |
| 5–9 | 2,179,681 | 2,084,913 | 4,264,594 | 9.05 |
| 10–14 | 2,209,575 | 2,118,395 | 4,327,970 | 9.18 |
| 15–19 | 2,244,449 | 2,143,506 | 4,387,955 | 9.31 |
| 20–24 | 2,160,859 | 2,061,652 | 4,222,511 | 8.96 |
| 25–29 | 1,914,365 | 1,904,075 | 3,818,440 | 8.10 |
| 30–34 | 1,671,089 | 1,754,172 | 3,425,261 | 7.27 |
| 35–39 | 1,490,015 | 1,583,059 | 3,073,074 | 6.52 |
| 40–44 | 1,381,926 | 1,498,588 | 2,880,514 | 6.11 |
| 45–49 | 1,366,374 | 1,495,820 | 2,862,194 | 6.07 |
| 50–54 | 1,210,148 | 1,332,829 | 2,542,977 | 5.40 |
| 55–59 | 970,679 | 1,080,402 | 2,051,081 | 4.35 |
| 60–64 | 753,793 | 840,857 | 1,594,650 | 3.38 |
| 65–69 | 558,729 | 635,567 | 1,194,296 | 2.53 |
| 70–74 | 394,140 | 471,078 | 865,218 | 1.84 |
| 75–79 | 287,769 | 372,754 | 660,523 | 1.40 |
| 80+ | 270,754 | 379,352 | 650,106 | 1.38 |
| Age group | Male | Female | Total | Percent |
|---|---|---|---|---|
| 0–14 | 6,588,950 | 6,303,339 | 12,892,289 | 27.36 |
| 15–64 | 15,163,697 | 15,694,960 | 30,858,657 | 65.49 |
| 65+ | 1,511,392 | 1,858,751 | 3,370,143 | 7.15 |
Urbanization
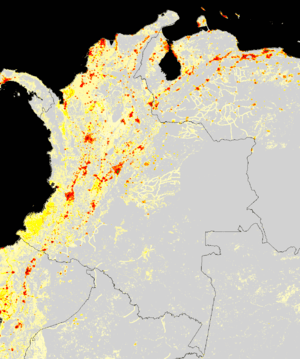
Movement from rural to urban areas was very heavy in the middle of the twentieth century, but has since tapered off. The urban population increased from 31% of the total population in 1938, to 57% in 1951 and about 70% by 1990. Currently the figure is about 77%. Thirty cities have a population of 100,000 or more. The nine eastern lowlands departments, constituting about 54% of Colombia's area, have less than 3% of the population and a density of less than one person per square kilometer (two people per sq. mi.).
Vital statistics
UN estimates
The Population Departement of the United Nations prepared the following estimates.[6]
| Period | Live births per year |
Deaths per year |
Natural change per year |
CBR* | CDR* | NC* | TFR* | IMR* | Life expectancy total |
Life expectancy males |
Life expectancy females |
|---|---|---|---|---|---|---|---|---|---|---|---|
| 1950–1955 | 628,000 | 219,000 | 409,000 | 47.3 | 16.5 | 30.6 | 6.76 | 123 | 50.6 | 49.0 | 52.3 |
| 1955–1960 | 697,000 | 203,000 | 494,000 | 45.4 | 13.2 | 32.2 | 6.76 | 105 | 55.2 | 53.5 | 56.9 |
| 1960–1965 | 787,000 | 203,000 | 584,000 | 44.2 | 11.4 | 32.8 | 6.76 | 92 | 57.9 | 56.2 | 59.7 |
| 1965–1970 | 845,000 | 206,000 | 639,000 | 41.1 | 10.0 | 31.1 | 6.18 | 82 | 60.0 | 58.3 | 61.8 |
| 1970–1975 | 800,000 | 202,000 | 598,000 | 34.2 | 8.7 | 25.5 | 4.90 | 73 | 61.7 | 59.6 | 63.9 |
| 1975–1980 | 853,000 | 199,000 | 654,000 | 32.5 | 7.6 | 24.9 | 4.25 | 57 | 64.0 | 61.7 | 66.3 |
| 1980–1985 | 900,000 | 191,000 | 709,000 | 30.7 | 6.5 | 24.2 | 3.70 | 43 | 66.8 | 63.6 | 70.2 |
| 1985–1990 | 904,000 | 201,000 | 703,000 | 27.7 | 6.2 | 21.5 | 3.18 | 35 | 68.0 | 64.5 | 71.7 |
| 1990–1995 | 898,000 | 219,000 | 679,000 | 25.1 | 6.1 | 19.0 | 2.84 | 28 | 68.7 | 64.5 | 73.0 |
| 1995–2000 | 853,000 | 223,000 | 630,000 | 21.9 | 5.7 | 16.2 | 2.50 | 24 | 70.3 | 66.5 | 74.2 |
| 2000–2005 | 842,000 | 234,000 | 608,000 | 20.1 | 5.6 | 14.5 | 2.30 | 21 | 71.7 | 68.0 | 75.5 |
| 2005–2010 | 804,000 | 249,000 | 555,000 | 18.0 | 5.6 | 12.4 | 2.10 | 19 | 72.9 | 69.2 | 76.7 |
| 2010–2015 | 764,000 | 273,000 | 491,000 | 16.2 | 5.8 | 10.4 | 1.93 | 16 | 73.9 | 70.3 | 77.6 |
| 2015–2020 | 729,000 | 300,000 | 429,000 | 14.8 | 6.1 | 8.7 | 1.83 | 14 | 74.9 | 71.4 | 78.6 |
| * CBR = crude birth rate (per 1000); CDR = crude death rate (per 1000); NC = natural change (per 1000); IMR = infant mortality rate per 1000 births; TFR = total fertility rate (number of children per woman) | |||||||||||
Births and deaths[8]
| Year | Population (x1000) | Live births | Deaths | Natural increase | Crude birth rate | Crude death rate | Rate of natural increase | TFR |
|---|---|---|---|---|---|---|---|---|
| 1998 | 39,184 | 720,984 | 175,363 | 545,621 | ||||
| 1999 | 39,730 | 746,194 | 183,553 | 562,641 | ||||
| 2000 | 40,295 | 752,834 | 187,432 | 565,402 | ||||
| 2001 | 40,813 | 724,319 | 191,513 | 532,806 | ||||
| 2002 | 41,328 | 700,455 | 192,262 | 508,193 | ||||
| 2003 | 41,848 | 710,702 | 192,121 | 518,581 | ||||
| 2004 | 42,368 | 723,099 | 188,933 | 534,166 | ||||
| 2005 | 42,888 | 719,968 | 189,022 | 530,946 | 2,45 | |||
| 2006 | 43,405 | 714,450 | 192,814 | 521,636 | ||||
| 2007 | 43,926 | 709,253 | 193,936 | 515,317 | ||||
| 2008 | 44,451 | 715,453 | 196,394 | 519,059 | ||||
| 2009 | 44,978 | 699,775 | 196,933 | 502,842 | ||||
| 2010 | 45,509 | 654,627 | 200,524 | 454,103 | 2,10 | |||
| 2011 | 46,044 | 665,499 | 195,823 | 469,676 | ||||
| 2012 | 46,581 | 676,815 | 199,756 | 477,059 | ||||
| 2013 | 47,121 | 658,835 | 203,071 | 455,764 | ||||
| 2014 | 47,661 | 669,137 | 210,051 | 459,086 | ||||
| 2015 | 48,203 | 658,178 | 213,526 | 444,652 | ||||
| 2016(p) | 311,012 | 99,735 | 211,277 | |||||
(p)=preliminar January–June
Fertility and Births
Total Fertility Rate (TFR) (Wanted Fertility Rate) and Crude Birth Rate (CBR):[9]
| Year | CBR (Total) | TFR (Total) | CBR (Urban) | TFR (Urban) | CBR (Rural) | TFR (Rural) |
|---|---|---|---|---|---|---|
| 1981–83 | 3.65 | |||||
| 1986 | 3,34 (2,81) | 2,76 (2,42) | 4,88 (3,87) | |||
| 1990 | 26.1 | 2,9 (2,2) | 25.7 | 2,5 (2,1) | 27.0 | 3,8 (2,7) |
| 1995 | 26 | 3,0 (2,2) | 25 | 2,5 (1,9) | 30 | 4,3 (2,8) |
| 2000 | 22.7 | 2,6 (1,8) | 21.6 | 2,3 (1,7) | 25.6 | 3,8 (2,3) |
| 2005 | 20.4 | 2,4 (1,7) | 19.0 | 2,1 (1,5) | 24.3 | 3,4 (2,1) |
| 2010 | 18 | 2,1 (1,6) | 17 | 2,0 (1,5) | 20 | 2,8 (1,9) |
Total fertility rate by departments
| Departament | TFR 2010[10] |
|---|---|
| Amazonas department | 3.7 |
| Antioquia | 1.8 |
| Arauca department | 2.4 |
| Atlántico | 2.5 |
| Bolívar department | 2.4 |
| Bogotá | 1.9 |
| Boyacá | 2.3 |
| Caldas | 1.6 |
| Caquetá | 2.7 |
| Casanare | 2.2 |
| Cauca department | 2.3 |
| Cesar department | 2.8 |
| Chocó | 3.3 |
| Córdoba department | 2.3 |
| Cundinamarca | 2.2 |
| Guainía | 3.1 |
| Guaviare | 2.3 |
| Huila | 2.5 |
| La Guajira | 4.1 |
| Magdalena department | 3.1 |
| Meta | 2.3 |
| Nariño | 2.2 |
| Norte de Santander | 2.4 |
| Putumayo | 2.5 |
| Quindío | 1.7 |
| Risaralda | 1.7 |
| San Andrés y Providencia | 2.1 |
| Santander department | 2.1 |
| Sucre department | 2.5 |
| Tolima | 2.4 |
| Valle del Cauca | 1.7 |
| Vaupés | 3.8 |
| Vichada | 3.3 |
Ethnic diversity
Colombia is ethnically diverse, its people descending from the original native inhabitants, Spanish colonists, Africans originally brought to the country as slaves, and 20th-century immigrants from Europe and the Middle East, all contributing to a diverse cultural heritage.[12] The demographic distribution reflects a pattern that is influenced by colonial history. Whites tend to live mainly in urban centers, like Bogotá, Medellín or Cali, and the burgeoning highland cities. The populations of the major cities also include mestizos. Mestizo campesinos (people living in rural areas) also live in the Andean highlands where some Spanish conquerors mixed with the women of Amerindian chiefdoms. Mestizos include artisans and small tradesmen that have played a major part in the urban expansion of recent decades.[13]
The 2005 census reported that the "non-ethnic population", consisting of whites and mestizos (those of mixed white European and Amerindian ancestry), constituted 86% of the national population. 10.6% is of African ancestry. Indigenous Amerindians comprise 3.4% of the population. 0.01% of the population are Roma. An extraofficial estimate considers that the 49% of the Colombian population is Mestizo or of mixed European and Amerindian ancestry, and that approximately 37% is White, mainly of Spanish lineage, but there is also a large population of Middle East descent; among the upper class there is a considerable input of Italian and German ancestry.[14]
Many of the Indigenous peoples experienced a reduction in population during the Spanish rule[15] and many others were absorbed into the mestizo population, but the remainder currently represents over eighty distinct cultures. Reserves (resguardos) established for indigenous peoples occupy 30,571,640 hectares (305,716.4 km2) (27% of the country's total) and are inhabited by more than 800,000 people.[16] Some of the largest indigenous groups are the Wayuu,[17] the Paez, the Pastos, the Emberá and the Zenú.[18] The departments of La Guajira, Cauca, Nariño, Córdoba and Sucre have the largest indigenous populations.[19]
The Organización Nacional Indígena de Colombia (ONIC), founded at the first National Indigenous Congress in 1982, is an organization representing the indigenous peoples of Colombia. In 1991, Colombia signed and ratified the current international law concerning indigenous peoples, Indigenous and Tribal Peoples Convention, 1989.[20]
Black Africans were brought as slaves, mostly to the coastal lowlands, beginning early in the 16th century and continuing into the 19th century. Large Afro-Colombian communities are found today on the Caribbean and Pacific coasts. The population of the department of Chocó, running along the northern portion of Colombia's Pacific coast, is over 80% black.[21] British and Jamaicans migrated mainly to the islands of San Andres and Providencia. A number of other Europeans and North Americans migrated to the country in the late 19th and early 20th centuries, including people from the former USSR during and after the Second World War.[22][23]
Many immigrant communities have settled on the Caribbean coast, in particular recent immigrants from the Middle East. Barranquilla (the largest city of the Colombian Caribbean) and other Caribbean cities have the largest populations of Lebanese, Palestinian, Phoenician and other Middle Easterners.[24][25] There are also important communities of Chinese, Japanese, Romanis and Jews.[12] There is a major migration trend of Venezuelans, due to the political and economic situation in Venezuela.[26][27]
Languages
Spanish (of which Colombia has the third-largest population of speakers in the world after Mexico and the United States) is the official language, and there are small communities in urban areas speaking other European languages such as German, French, English, Italian and Portuguese. There are 65 indigenous languages and two Creole languages: one in San Basilio de Palenque and one in San Andrés; and also San Andrés is the only place of Colombia where are three official languages: Spanish, English and a creole language. There are 5,000 speakers of Romani in Colombia.
Religion

The National Administrative Department of Statistics (DANE) does not collect religious statistics, and accurate reports are difficult to obtain. However, based on various studies and a survey, about 90% of the population adheres to Christianity, the majority of which (70.9%) are Roman Catholic, while a significant minority (16.7%) adhere to Protestantism (primarily Evangelicalism). Some 4.7% of the population is atheist or agnostic, while 3.5% claim to believe in God but do not follow a specific religion. 1.8% of Colombians adhere to Jehovah's Witnesses and Adventism and less than 1% adhere to other religions, such as Islam, Judaism, Buddhism, Mormonism, Hinduism, Indigenous religions, Hare Krishna movement, Rastafari movement, Orthodox Catholic Church, and spiritual studies. The remaining people either did not respond or replied that they did not know. In addition to the above statistics, 35.9% of Colombians reported that they did not practice their faith actively.[29][30][28]
While Colombia remains a mostly Roman Catholic country by baptism numbers, the 1991 Colombian constitution guarantees freedom of religion and all religious faiths and churches are equally free before the law.[31]
Migration
Historically, a sizable percentage of Colombian emigration has also been motivated by the need to escape from political persecution and bipartisan violence during the periods of "La Violencia" (1948–1958), and later due to the effects of the nation's current conflict (since 1964). This has resulted in numerous applications for political asylum abroad.
Colombians have emigrated in comparably high rates to the United States. Other Colombians migrated to Canada and Europe (most to Spain, but also to France and Italy, and the United Kingdom). Among other locations.
Today millions of Colombians have returned to their country due to improvements in security, Colombia is now a country on the road to recovery. Colombia is creating an economy that is today considered attractive and prosperous by many national and international investors. There are policies of the Colombian Government to help Colombians with housing loans. There is a support system for returning migrants. Certificates of competency are issued and there is a free employment service to help people find job.[32][33][34][35]
CIA World Factbook demographic statistics
The following demographic statistics are from the CIA World Factbook, unless otherwise indicated.[36]
Population
48,637,910 (May, 2016 est.)
Median age
total: 27.7 years
male: 26.7 years
female: 28.6 years (2010 est.)
Sex ratio
At birth: 1.03 male(s)/female
Under 15 years: 1.02 male(s)/female
15–64 years: 0.95 male(s)/female
65 years and over: 0.75 male(s)/female
total population: 0.96 male(s)/female (2009 est.)
HIV/AIDS – adult prevalence rate
0.7% (2007 est.)
HIV/AIDS – people living with HIV/AIDS
170,000 (2007 est.)
HIV/AIDS – deaths
9,800 (2007 est.)
Nationality
noun: Colombia adjective: Colombian(s)
Literacy
definition: age 15 and over can read and write
total population: 93.4%
male: 93.1%
female: 93.7% (2005 census)
References
- ↑ "Animated clock". Colombian State Department. Retrieved 3 September 2015.
- ↑ "CIA – The World Factbook – Rank Order – Net migration rate". CIA. Retrieved 2009-02-23.
- ↑ https://www.cancilleria.gov.co/sites/default/files/informe-ejecutivo-2013-vinculacion-colombianos-exterior.pdf
- ↑ "La historia del censo en Colombia". Caracol. 28 September 2005. Consulted 16 April 2012.
- ↑ Tiempo, Casa Editorial El. "En agosto habrá ensayo del censo de población - Indicadores - El Tiempo". Retrieved 7 July 2016.
- 1 2 "World Population Prospects - Population Division - United Nations". Retrieved 7 July 2016.
- ↑ "United Nations Statistics Division - Demographic and Social Statistics". Retrieved 7 July 2016.
- ↑ Administrator. "Departamento Administrativo Nacional de Estadística (DANE)". Retrieved 7 July 2016.
- ↑ "MEASURE DHS: Demographic and Health Surveys". Retrieved 7 July 2016.
- ↑ http://www.profamilia.org.co/encuestas/Profamilia/Profamilia/images/stories/documentos/Principales_indicadores.pdf
- ↑ "South America :: COLOMBIA". CIA The World Factbook.
- 1 2 "The ethnic and cultural diversity of Colombia" (PDF) (in Spanish). pedagogica.edu.co. Retrieved 26 March 2014.
- ↑ Bushnell & Hudson, pp. 87–88.
- ↑ Bushnell, David & Rex A. Hudson (2010) "The Society and Its Environment"; Colombia: a country study: pp. 87, 92. Washingtion D.C.: Federal Research Division, Library of Congress.
- ↑ "Society and slavery" (in Spanish). colombia.com. Retrieved 9 September 2013.
- ↑ "Resguardos indígenas – Concentra el 43% de los bosques naturales" (in Spanish). siac.gov.co. Retrieved 27 March 2014.
- ↑ "Hostein, N. (2010). El pueblo wayuu de la Guajira colombo-venezolana: un panorama de su cultura. Cuadernos de Antropología, 20(1).". Retrieved 27 March 2014.
- ↑ "Los pueblos indígenas de Colombia en el umbral del nuevo milenio. Población, cultura y territorio: bases para el fortalecimiento social y económico de los pueblos indígenas". dnp.gov.co. Retrieved 27 March 2014.
- ↑ "visibilización estadística de los grupos étnicos" (PDF). Censo General 2005. Departamento Administrativo Nacional de Estadistica (DANE). Retrieved 15 June 2013.
- ↑ "Ratifications for Colombia". ilo.org. Retrieved 26 March 2014.
- ↑ "Ethnic groups in Colombia" (PDF) (in Spanish). dane.gov.co. Retrieved 26 March 2014.
- ↑ Luis Álvaro Gallo Martínez (2011). "Inmigrantes a Colombia: Personajes extranjeros llegados a Colombia" (PDF). rodriguezuribe.co.
- ↑ Wabgou, M., Vargas, D. & Carabalí, J. A. (2012). "Las migraciones internacionales en Colombia. Investigación & Desarrollo, 20(1) 142–167.". uninorte.edu.co.
- ↑ Vargas Arana, Pilar, and Luz Marina Suaza Vargas. "Los árabes en Colombia: Del rechazo a la integración." (2007).
- ↑ "The Arab immigration to Colombia" (in Spanish). nodo50.org. Retrieved 30 January 2014.
- ↑ Echeverry Hernández. "Análisis de la migración venezolana a Colombia durante el gobierno de Hugo Chávez (1999–2011). Identificación de capital social y compensación económica" (in Spanish). Revista Análisis Internacional – Revistas.utadeo.edu.co. Retrieved 28 March 2014.
- ↑ Llegaron los venezolanos. Semana.com. Retrieved 4 June 2011.
- 1 2 "Religion in Latin America, Widespread Change in a Historically Catholic Region". pewforum.org. Pew Research Center. 13 November 2014.
- 1 2 Beltrán Cely; William Mauricio (2013). "Del monopolio católico a la explosión pentecostal'" (PDF) (in Spanish). Universidad Nacional de Colombia, Facultad de Ciencias Humanas, Centro de Estudios Sociales (CES), Maestría en Sociología. ISBN 978-958-761-465-7.
- 1 2 Beltrán Cely; William Mauricio. "Descripción cuantitativa de la pluralización religiosa en Colombia" (PDF). Universitas humanística 73 (2012): 201–238. – bdigital.unal.edu.co.
- ↑ Colombian Constitution of 1991 (Title II – Concerning rights, guarantees, and duties – Chapter I – Concerning fundamental rights – Article 19)
- ↑ "Can Young People Rebuild Colombia's Social Capital?". theglobalist.com. Retrieved 9 July 2013.
- ↑ "Opportunities for Colombians who are returning to the country" (in Spanish). conexioncolombia.com. Retrieved 9 July 2013.
- ↑ "Colombia provides opportunities for the development of its citizens in the country" (in Spanish). conexioncolombia.com. Retrieved 9 July 2013.
- ↑ "Entrepreneurship and employment programme for those who return to the country" (in Spanish). elempleo.com. Retrieved 9 July 2013.
- ↑ "The World Factbook". Retrieved 7 July 2016.
 This article incorporates public domain material from the CIA World Factbook document "2006 edition".
External links
- (Spanish) Colombian Department of Statistics
- (Spanish) 1951 Census