Demographics of Alberta
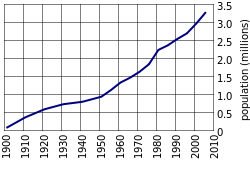
Alberta has experienced a relatively high rate of growth in recent years, due in large part to its economy. Between 2003 and 2004, the province saw high birthrates (on par with some larger provinces such as British Columbia), relatively high immigration, and a high rate of interprovincial migration when compared to other provinces.[1] Approximately 81% of the population live in urban areas and only about 19% live in rural areas. The Calgary–Edmonton Corridor is the most urbanized area in Alberta and is one of Canada's four most urban regions.[2] Many of Alberta's cities and towns have also experienced high rates of growth in recent history. From a population of 73,022 in 1901, Alberta has grown to 3,645,257 in 2011 and in the process has gone from less than 1.5% of Canada's population to 10.9%.[3]
Population history
| Year | Population [4] | Five Year % change |
Ten Year % change |
Percentage of Canadian Pop. |
Rank Among Provinces |
|---|---|---|---|---|---|
| 1901 | 73,022 | n/a | n/a | 1.4 | 9 |
| 1911 | 374,295 | n/a | 412.6 | 5.2 | 7 |
| 1921 | 588,454 | n/a | 57.2 | 6.7 | 5 |
| 1931 | 731,605 | n/a | 24.3 | 7.0 | 4 |
| 1941 | 796,169 | n/a | 8.8 | 6.9 | 5 |
| 1951 | 939,501 | n/a | 18.0 | 6.7 | 4 |
| 1956 | 1,123,116 | 19.5 | n/a | n/a | 4 |
| 1961 | 1,331,944 | 18.6 | 41.8 | 7.3 | 4 |
| 1966 | 1,463,203 | 9.9 | 30.3 | n/a | 4 |
| 1971 | 1,627,875 | 11.3 | 22.2 | 7.5 | 4 |
| 1976 | 1,838,035 | 12.9 | 25.6 | n/a | 4 |
| 1981 | 2,237,724 | 21.7 | 37.5 | 9.2 | 4 |
| 1986 | 2,365,830 | 5.7 | 28.7 | 9.3 | 4 |
| 1991 | 2,545,553 | 7.6 | 13.8 | 9.3 | 4 |
| 1996 | 2,696,826 | 5.9 | 14.0 | 9.3 | 4 |
| 2001 | 2,974,807 | 10.3 | 16.9 | 9.9 | 4 |
| 2006 | 3,290,350 | 10.6 | 22.0 | 10.4 | 4 |
| 2011 | 3,645,257 | 10.8 | 22.5 | 10.9 | 4 |
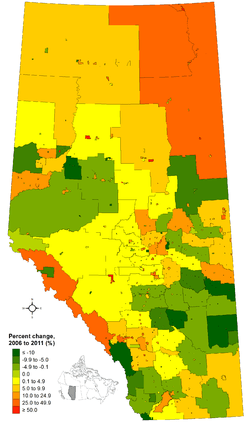
Population geography

Census divisions
Census metropolitan areas
As of the 2011 census, Alberta had two census metropolitan areas (CMAs) recognized by Statistics Canada. The following is a list of the recent population history of the Calgary and Edmonton CMAs.
| CMA name [5] | 2011 [5] | 2006 [6] | 2001 [7] | 1996 [8] | Census division |
|---|---|---|---|---|---|
| Calgary | 1,214,839 | 1,079,310 | 951,395 [CMA 1] | 821,628 | Division No. 6 |
| Edmonton | 1,159,869 | 1,034,945 | 937,845 | 862,597 | Division No. 11 |
CMA notes:
- ↑ In the 2006 census, the 2001 population of the Calgary was adjusted to 951,494 due to a boundary expansion.
Census agglomerations
Census subdivisions
As of the 2006 census, Alberta had 453 census subdivisions (municipalities and municipal equivalents) recognized by Statistics Canada. The following is a list of those census subdivisions with a population of 10,000 or greater.
| Name [9] | Municipal status [10] |
2011 [11] | 2006 [9] | 2001 [12] | 1996 [13] | Notes |
|---|---|---|---|---|---|---|
| Calgary | City | 1,096,833 | 988,193 | 878,866 | 768,082 | |
| Edmonton | City | 812,201 | 730,372 | 666,104 | 616,306 | |
| Strathcona County | Specialized municipality | 92,490 | 82,511 | 71,986 | 64,176 | Located within the Edmonton CMA |
| Red Deer | City | 90,564 | 82,772 | 67,707 | 60,075 | |
| Lethbridge | City | 83,517 | 74,637 | 67,374 | 63,053 | |
| Wood Buffalo | Specialized municipality | 65,565 | 51,496 | 41,466 | 35,213 | |
| St. Albert | City | 61,466 | 57,719 | 53,081 | 46,888 | Located within the Edmonton CMA |
| Medicine Hat | City | 60,005 | 56,997 | 51,249 | 46,783 | |
| Grande Prairie | City | 55,032 | 47,076 | 36,983 | 31,140 | |
| Airdrie | City | 42,564 | 28,927 | 20,382 | 15,946 | Located within the Calgary CMA |
| Rocky View County | Municipal district | 36,461 | 34,171 | 30,688 | 23,326 | Located within the Calgary CMA |
| Parkland County | Municipal district | 30,568 | 29,265 | 27,252 | 24,769 | Located within the Edmonton CMA |
| Spruce Grove | City | 26,171 | 19,496 | 15,983 | 14,271 | Located within the Edmonton CMA |
| Okotoks | Town | 24,511 | 17,145 | 11,664 | 8,510 | |
| Leduc | City | 24,279 | 16,967 | 15,032 | 14,305 | Located within the Edmonton CMA |
| Foothills No. 31 | Municipal district | 21,258 | 19,736 | 16,764 | 13,714 | |
| County of Grande Prairie No. 1 | Municipal district | 20,347 | 17,970 | 15,638 | 13,750 | |
| Sturgeon County | Municipal district | 19,578 | 18,621 | 18,067 | 15,945 | Located within the Edmonton CMA |
| Fort Saskatchewan | City | 19,051 | 14,957 | 13,121 | 12,408 | Located within the Edmonton CMA |
| Red Deer County | Municipal district | 18,351 | 19,108 | 18,639 | 17,126 | |
| Lloydminster | City | 18,032 | 15,910 | 13,148 | 11,317 | Population totals do not include the part of the city located within Saskatchewan |
| Cochrane | Town | 17,580 | 13,780 | 11,798 | 7,424 | Located within Calgary CMA |
| Camrose | City | 17,286 | 15,620 | 14,854 | 13,728 | |
| Stony Plain | Town | 15,051 | 12,363 | 9,589 | 8,274 | Located within the Edmonton CMA |
| Chestermere | Town | 14,824 | 9,564 | 3,414 | 1,911 | |
| Beaumont | Town | 13,284 | 8,961 | 7,006 | 5,810 | Located within the Edmonton CMA |
| Cold Lake | City | 13,839 | 11,991 | 11,520 | 4,089 | |
| Brooks | City | 13,676 | 12,498 | 11,604 | 10,093 | |
| Leduc County | Municipal district | 13,541 | 12,730 | 12,528 | 12,361 | Located within the Edmonton CMA |
| High River | Town | 12,920 | 10,716 | 9,345 | 7,359 | |
| Wetaskiwin | City | 12,525 | 11,673 | 11,154 | 10,959 | |
| Mountain View County | Municipal district | 12,359 | 12,391 | 12,134 | 11,277 | |
| Sylvan Lake | Town | 12,327 | 10,208 | 7,493 | 5,178 | |
| Strathmore | Town | 12,305 | 10,225 | 7,621 | 5,282 | |
| Canmore | Town | 12,288 | 12,039 | 10,792 | 8,354 | |
| Clearwater County | Municipal district | 12,278 | 11,826 | 11,505 | 10,915 | |
| Lacombe | City | 11,707 | 10,742 | 9,384 | 8,018 | |
| Yellowhead County | Municipal district | 11,469 | 10,045 | 9,881 | 9,352 | |
| Bonnyville No. 87 | Municipal district | 11,191 | 10,194 | 9,473 | 17,352 | |
| Mackenzie County | Specialized municipality | 10,927 | 10,002 | 8,829 | 7,980 | |
| County of Wetaskiwin No. 10 | Municipal district | 10,866 | 10,535 | 10,695 | 10,467 | |
| Lacombe County | Municipal district | 10,312 | 10,451 | 10,159 | 10,081 | |
| Lethbridge County | Municipal district | 10,061 | 10,302 | 9,930 | 9,290 |
Population centres
Designated places
Ethnic origins
The ethnicities most commonly reported in the 2011 Census are shown in the table below. The percentages add up to more than 100% because of dual responses (e.g. "Irish-Canadian" generates an entry in both the category "Irish" and the category "Canadian").[14]
| Ethnic Group | Total | Percentage |
|---|---|---|
| English | 886,760 | 24.9% |
| Canadian | 776,695 | 21.8% |
| German | 683,835 | 19.2% |
| Scottish | 670,950 | 18.8% |
| Irish | 565,120 | 15.8% |
| French | 396,230 | 11.1% |
| Ukrainian | 345,405 | 9.7% |
| Dutch (Netherlands) | 182,265 | 5.1% |
| First Nations | 177,140 | 5.0% |
| Polish | 174,380 | 4.8% |
| Chinese | 155,965 | 4.4% |
| Norwegian | 152,645 | 4.3% |
| Indian (South Asian) | 125,105 | 3.5% |
| Filipino | 113,210 | 3.2% |
| Russian | 99,775 | 2.8% |
| Swedish | 96,890 | 2.7% |
| Métis | 94,615 | 2.7% |
| Italian | 88,710 | 2.5% |
| British n.i.e. | 79,300 | 2.2% |
| Welsh | 75,870 | 2.1% |
Other Ethnic Groups
In addition to the groups listed above, the next most commonly reported (counting both single and multiple responses) were:
- 71,430 American (USA) (2.0%);
- 59,060 Danish (1.7%);
- 52,020 Hungarian (Magyar) (1.5%);
- 39,320 Spanish (1.1%);
- 36,670 Austrian (1.0%);
- 32,510 Vietnamese (0.9%);
- 29,425 Romanian (0.8%);
- 25,960 Lebanese (0.7%);
- 23,020 Swiss (0.6%);
- 20,390 Belgian (0.6%);
- 18,910 Czech (0.5%);
- 18,775 Portuguese (0.5%);
- 17,825 Pakistani (0.5%);
- 17,075 Icelandic (0.5%);
- 16,940 Other African origins, n.i.e. (0.5%);
- 16,280 Finnish (0.5%);
- 15,865 Korean (0.4%);
- 15,815 Jewish (0.4%);
- 15,645 Japanese (0.4%);
- 14,465 Mexican (0.4%)
Visible minorities and Aboriginals
| Visible minority and Aboriginal population (Canada 2011 Census) | |||
|---|---|---|---|
| Population group | Population | % of total population | |
| White | 2,690,955 | 75.4% | |
| Visible minority group Source:[15] | South Asian | 156,665 | 4.4% |
| Chinese | 133,390 | 3.7% | |
| Black | 74,435 | 2.1% | |
| Filipino | 106,035 | 3% | |
| Latin American | 41,305 | 1.2% | |
| Arab | 34,920 | 1% | |
| Southeast Asian | 41,025 | 1.1% | |
| West Asian | 16,030 | 0.4% | |
| Korean | 15,000 | 0.4% | |
| Japanese | 12,415 | 0.3% | |
| Visible minority, n.i.e. | 6,270 | 0.2% | |
| Multiple visible minority | 18,840 | 0.5% | |
| Total visible minority population | 656,325 | 18.4% | |
| Aboriginal group Source:[16] | First Nations | 116,670 | 3.3% |
| Métis | 96,870 | 2.7% | |
| Inuit | 1,985 | 0.1% | |
| Aboriginal, n.i.e. | 3,300 | 0.1% | |
| Multiple Aboriginal identity | 1,870 | 0.1% | |
| Total Aboriginal population | 220,695 | 6.2% | |
| Total population | 3,567,975 | 100% | |
Languages
Of the 3,547,680 singular responses to the 2011 census question concerning mother tongue, the languages most commonly reported were:[17]
| 2011 | % | 2006 | % | 2001 | % | ||
|---|---|---|---|---|---|---|---|
| 1. | English | 2,780,200 | 78.37% | 2,576,670 | 79.99% | 2,379,515 | 81.84% |
| 2. | Chinese | 105,470 | 2.97% | 97,275 | 3.02% | 78,205 | 2.69% |
| Cantonese | 34,985 | 0.99% | 32,485 | 1.01% | 26,255 | 0.90% | |
| Mandarin | 19,325 | 0.54% | 12,135 | 0.38% | 5,580 | 0.19% | |
| Hakka | 325 | 0.01% | 425 | 0.01% | 570 | 0.02% | |
| Fukien | 445 | 0.01% | 385 | 0.01% | N | N | |
| Taiwanese | 340 | 0.01% | 330 | 0.01% | N | N | |
| 3. | German | 80,905 | 2.28% | 84,505 | 2.62% | 78,040 | 2.68% |
| 4. | French | 68,545 | 1.93% | 61,225 | 1.90% | 58,645 | 2.02% |
| 5. | Tagalog (Filipino/Pilipino) | 60,085 | 1.69% | 29,740 | 0.92% | 11,705 | 0.40% |
| 6. | Panjabi (Punjabi) | 49,940 | 1.41% | 36,320 | 1.13% | 22,535 | 0.78% |
| 7. | Spanish | 44,020 | 1.24% | 29,125 | 0.90% | 19,820 | 0.68% |
| 8. | Arabic | 28,000 | 0.79% | 20,495 | 0.64% | 15,390 | 0.53% |
| 9. | Ukrainian | 24,575 | 0.69% | 29,455 | 0.91% | 33,970 | 1.17% |
| 10. | Selected Aboriginal languages | 22,005 | 0.62% | 20,890 | 0.65% | 18,470 | 0.64% |
| Cree | 16,745 | 0.47% | 17,215 | 0.53% | 15,105 | 0.52% | |
| Blackfoot | 3,035 | 0.09% | 3,015 | 0.09% | 2,630 | 0.09% | |
| Dene | 1,680 | 0.05% | 1,585 | 0.05% | 1,495 | 0.05% | |
| Ojibway | 455 | 0.01% | 615 | 0.02% | 645 | 0.02% | |
| 11. | Vietnamese | 21,195 | 0.60% | 19,350 | 0.60% | 16,680 | 0.57% |
| 12. | Urdu | 19,900 | 0.56% | 11,275 | 0.35% | 4,910 | 0.17% |
| 13. | Polish | 19,890 | 0.56% | 21,990 | 0.68% | 20,635 | 0.71% |
| 14. | Dutch | 17,950 | 0.51% | 19,980 | 0.62% | 19,575 | 0.67% |
| 15. | Italian | 11,960 | 0.34% | 13,095 | 0.41% | 13,935 | 0.48% |
| 16. | Korean | 13,885 | 0.39% | 10,845 | 0.33% | 6,330 | 0.22% |
| 17. | Hindi | 12,290 | 0.35% | 8,985 | 0.28% | 6,315 | 0.22% |
| 18. | Persian | 10,655 | 0.30% | 7,700 | 0.24% | 3,700 | 0.13% |
| 19. | Serbo-Croatian (all) | 10,195 | 0.29% | 10,235 | 0.32% | 9,500 | 0.33% |
| Croatian | 3,960 | 0.11% | 4,150 | 0.13% | 4,195 | 0.14% | |
| Serbian | 3,560 | 0.10% | 3,090 | 0.10% | 2,125 | 0.07% | |
| Bosnian | 1,745 | 0.05% | 1,745 | 0.05% | N | N | |
| Serbo-Croatian | 930 | 0.03% | 1,250 | 0.04% | 3,180 | 0.11% | |
| 20. | Gujarati | 8,675 | 0.24% | 6,280 | 0.19% | 4,910 | 0.17% |
| 21. | Portuguese | 7,380 | 0.21% | 7,205 | 0.22% | 6,110 | 0.21% |
| 22. | Hungarian | 6,700 | 0.19% | 6,770 | 0.21% | 6,985 | 0.24% |
| 23. | Romanian | 6,550 | 0.18% | 4,370 | 0.14% | 2,890 | 0.10% |
| 24. | Somali | 5,515 | 0.16% | 3,130 | 0.10% | 810 | 0.03% |
| 25. | Amharic | 5,110 | 0.14% | 2,785 | 0.09% | 1,100 | 0.04% |
| 26. | Bengali | 5.030 | 0.14% | 2,710 | 0.08% | 1,190 | 0.04% |
| 27. | Scandinavian languages | 4,935 | 0.14% | 6,045 | 0.19% | 6,795 | 0.23% |
| Danish | 2,805 | 0.08% | 3,510 | 0.11% | 3,615 | 0.12% | |
| Norwegian | 1,180 | 0.03% | 1,245 | 0.04% | 1,670 | 0.06% | |
| Swedish | 950 | 0.03% | 1,145 | 0.04% | 1,345 | 0.05% | |
| 28. | Japanese | 4,560 | 0.13% | 4,555 | 0.14% | 3,625 | 0.12% |
| 29. | African languages n.i.e. | 3,380 | 0.10% | 2,525 | 0.08% | 930 | 0.03% |
| 30. | Bisayan languages | 3,255 | 0.09% | 1,370 | 0.04% | N | N |
| 31. | Ilocano | 3,010 | 0.08% | 1,885 | 0.06% | N | N |
| 32. | Greek | 2,965 | 0.08% | 3,305 | 0.10% | 2,765 | 0.10% |
| 33. | Czech | 2,880 | 0.08% | 3,100 | 0.08% | 3,520 | 0.12% |
| 34. | Malayalam | 2,760 | 0.08% | 1,550 | 0.05% | 1,055 | 0.04% |
| 35. | Tamil | 2,645 | 0.07% | 1,385 | 0.04% | 1,110 | 0.04% |
| 36. | Sindhi | 2,560 | 0.07% | 2,000 | 0.06% | 1,990 | 0.07% |
| 37. | Turkish | 2,460 | 0.07% | 1,605 | 0.05% | 810 | 0.03% |
| 38. | Afrikaans | 2,420 | 0.07% | N | N | N | N |
| 39. | Tigrigna | 2,340 | 0.07% | 1,170 | 0.04% | 800 | 0.03% |
| 40. | Slovak | 2,145 | 0.06% | 2,430 | 0.08% | 1,605 | 0.06% |
| 41 | Niger-Congo languages, n.i.e. | 2,075 | 0.06% | N | N | N | N |
| 42 | Sinhalese | 1,940 | 0.05% | 835 | 0.03% | N | N |
| 43. | Pashto | 1,850 | 0.05% | 1,175 | 0.04% | 275 | 0.01% |
| 44. | Khmer (Cambodian) | 1,745 | 0.05% | 1,740 | 0.05% | 1,450 | 0.05% |
| 45. | Albanian | 1,685 | 0.05% | N | N | N | N |
| 46. | Nepali | 1,605 | 0.05% | N | N | N | N |
| 47. | Swahili | 1,455 | 0.04% | 850 | 0.03% | 380 | 0.01% |
| 48. | Oromo language | 1,405 | 0.04% | N | N | N | N |
| 49. | Thai | 1,310 | 0.04% | N | N | 85 | 0.003% |
| 50. | Bulgarian | 1,280 | 0.04% | 1,020 | 0.03% | 400 | 0.01% |
Note: "n.i.e.": not included elsewhere
Other Languages
In addition to the table above, other mother tongues include:
- 1,265 Bantu languages, n.i.e.;
- 1,230 Kurdish;
- 1,180 Creoles;
- 1,100 Akan (Twi);
- 1,070 Indo-Iranian languages, n.i.e.;
- 1,035 Lao;
- 895 Finnish;
- 850 Marathi;
- 780 Hebrew;
- 745 Slovenian;
- 680 Semitic languages, n.i.e.;
- 440 Rwanda (Kinyarwanda);
- 390 Armenian;
- 380 Lithuanian;
Mother tongues of more than 355 persons (0.01%) are listed.
In addition to the single-language responses detailed above, about 62,505 people reported having more than one mother tongue. There were 49,970 responses of both English and a non-official language; 2,945 of both French and a non-official language; 8,410 of both English and French; and 1,185 of English, French and a non-official language.
Migration
Immigration
The 2011 Canadian census counted a total of 644,115 immigrants living in Alberta, 257,230 of whom arrived after 2001.
The most common countries of birth for immigrants living in Alberta were:[18]
| Rank | Place of Origin | Total |
|---|---|---|
| 1. | Philippines | 69,575 |
| 2. | India | 59,020 |
| 3. | United Kingdom | 58,245 |
| 4. | China | 49,595 |
| 5. | United States | 31,050 |
| 6. | Vietnam | 26,020 |
| 7. | Germany | 20,085 |
| 8. | Pakistan | 19,110 |
| 9. | Hong Kong | 17,300 |
| 10. | Poland | 16,335 |
| 11. | Netherlands | 15,290 |
| 12. | Mexico | 10,755 |
| 13. | South Korea | 9,575 |
| 14. | Lebanon | 8,390 |
| 15. | Italy | 8,050 |
| 16. | Colombia | 6,860 |
| 17. | Ukraine | 6,430 |
| 18. | Ethiopia | 6,375 |
| 19. | Romania | 6,235 |
| 20. | South Africa | 6,010 |
Other Places of Origin
In addition to the countries listed in the table above, there were also about:
- 5,900 from Russia;
- 5,595 from Iran;
- 5,575 from Nigeria;
- 5,535 from El Salvador;
- 4,345 from Afghanistan;
- 4,340 from Jamaica;
- 4,305 from Chile;
- 4,140 from Fiji;
- 4,005 from Kenya;
- 3,825 from Iraq;
- 3,720 from Bosnia and Herzegovina;
- 3,680 from Bangladesh;
- 3,620 from Hungary;
- 3,465 from Portugal;
- 3,295 from Sri Lanka;
- 3,120 from Egypt;
- 2,960 from Taiwan;
- 2,950 from Trinidad and Tobago;
- 2,935 from Japan;
- 2,795 from Ireland;
- 2,390 from France;
- 2,330 from Guyana;
- 1,865 from Serbia;
{Countries of birth for more than 1,784 persons (0.05%) are shown.}
Internal migration
A total of 469,095 people moved to Alberta from other parts of Canada between 1996 and 2006 while 261,500 people moved in the opposite direction. These movements resulted in a net influx of 51,235 people from British Columbia, 42,180 people from Saskatchewan, 31,425 people from Ontario, 23,875 people from Manitoba, 18,820 people from Newfoundland and Labrador, 11,925 people from Nova Scotia, 11,720 people from Quebec, and 8,410 people from New Brunswick. During this period there was a net influx of 2,710 francophones from Quebec, 1,545 francophones from Ontario, 1,355 francophones from New Brunswick, 775 francophones from Saskatchewan, 575 francophones from Manitoba, 500 francophones from British Columbia, 340 francophones from Nova Scotia, and 5,585 anglophones from Quebec. (All net inter-provincial movements of more than 5,000 persons and net official language minority movements of more than 100 persons are given.)[19][20]
Religion
Over 60 percent of Albertans identify as Christian, while almost 32 percent of residents identify with no religion. The largest denominations are the Roman Catholic, United, Anglican, Lutheran, and Baptist Churches.
Almost 2 percent of Albertans are Mormons descended from pioneers who emigrated from Utah around the turn of the 20th century; there are three temples in the province. Alberta also has large numbers of Pentecostal, Presbyterians, and evangelical Christians.
There are significant numbers of Mennonites and Hutterites, which are communal Anabaptist sects. There are also many Jehovah's Witnesses and Reformed Christians, as well a significant population of Seventh-day Adventists in and around Lacombe where the Canadian University College is located.
Alberta is also home to several Eastern Rite Churches as part of the legacy of Eastern European immigrants, including the Ukrainian Catholic Eparchy of Edmonton, and the Ukrainian Orthodox Diocese of Edmonton and Western Canada. There are 500 Doukhobors living in their few communities across Southern Alberta.
Many people of the Hindu, Sikh, and Muslim faiths also make Alberta their home; one of the largest Sikh temples in Canada is located just outside Edmonton. Most of Alberta's Jewish population of 10,900 lives in Calgary and Edmonton.
| Religion (2011) 1 | Denomination | Congregation | Proportion |
|---|---|---|---|
| Christian | 2,152,200 | 60.3% | |
| Catholic | 866,305 | 24.3% | |
| United Church | 268,275 | 7.5% | |
| Anglican Church | 140,665 | 3.9% | |
| Lutheran | 119,345 | 3.3% | |
| Baptist | 66,635 | 1.9% | |
| Pentecostal | 60,960 | 1.7% | |
| Christian Orthodox | 51,340 | 1.4% | |
| Presbyterian | 36,765 | 1.0% | |
| Other Christian | 541,520 | 15.2% | |
| Muslim | 113,445 | 3.2% | |
| Sikh | 52,335 | 1.5% | |
| Buddhist | 44,410 | 1.2% | |
| Hindu | 36,845 | 1.0% | |
| Jewish | 10,900 | 0.3% | |
| Other Religions | 16,605 | 0.5% | |
| Aboriginal spirituality | 15,100 | 0.4% | |
| No religious affiliation | 1,126,130 | 23.62% |
- ^1 Statistics Canada. 2013. Alberta (Code 48) (table). National Household Survey (NHS) Profile. 2011 National Household Survey. Statistics Canada Catalogue no. 99-004-XWE. Ottawa. Released September 11, 2013.[21]
See also

- Demographics of Calgary
- Demographics of Canada
- Demographics of Edmonton
- List of Canadian provinces and territories by population
References
- ↑ StatCan - Alberta population
- ↑ "2001 Census Analysis Series - A profile of the Canadian population : where we live" (PDF). Statistics Canada. p. 6. Retrieved 2011-08-17.
- ↑ - Statistics Canada
- ↑ "Population, urban and rural, by province and territory (Alberta)". 2009-09-22. Retrieved 2011-04-11.
- 1 2 "Population and dwelling counts, for Canada, provinces and territories, census metropolitan areas and census agglomerations, 2011 and 2006 censuses - 100% data (Alberta)". Statistics Canada. 2011-02-06. Retrieved 2011-02-13.
- ↑ "Population and dwelling counts, for Canada, provinces and territories, census metropolitan areas and census agglomerations, 2006 and 2001 censuses - 100% data (Alberta)". Statistics Canada. 2010-01-06. Retrieved 2012-03-02.
- ↑ "Population and Dwelling Counts, for Canada, Provinces and Territories, Census Metropolitan Areas and Census Agglomerations, 2001 and 1996 Censuses - 100% Data (Alberta)". Statistics Canada. Retrieved 2011-04-10.
- ↑ A National Overview: Population and Dwelling Counts (1996 Census ed.). Ottawa: Statistics Canada. April 1997. ISBN 0-660-59283-5.
- 1 2 "Population and dwelling counts, for Canada, provinces and territories, and census subdivisions (municipalities), 2006 and 2001 censuses - 100% data (Alberta)". Statistics Canada. 2010-01-06. Retrieved 2011-04-10.
- ↑ "2011 Municipal Codes" (PDF). Alberta Municipal Affairs. 2011-01-05. Retrieved 2011-04-10.
- ↑ "Population and dwelling counts, for Canada, provinces and territories, and census subdivisions (municipalities), 2011 and 2006 censuses (Alberta)". Statistics Canada. Retrieved April 3, 2012.
- ↑ "Population and Dwelling Counts, for Canada, Provinces and Territories, and Census Subdivisions (Municipalities), 2001 and 1996 Censuses - 100% Data (Alberta)". Statistics Canada. Retrieved 2011-04-10.
- ↑ "1996 Community Profiles". Statistics Canada. Retrieved 2011-04-26.
- ↑ Alberta (Code 48) (table). National Household Survey (NHS) Profile.
- ↑ , Community Profiles from the 2011 Census, Statistics Canada - Province/Territory
- ↑ , Aboriginal Population Profile from the 2011 Census, Statistics Canada - Province/Territory
- ↑ Census Profile
- ↑ National Household Survey (NHS) Profile, 2011
- ↑ Province or Territory of Residence 5 Years Ago (14), Mother Tongue (8), Age Groups (16) and Sex (3) (2006 Census)
- ↑ Province or Territory of Residence 5 Years Ago (14), Mother Tongue (8), Age Groups (16) and Sex (3) (2001 census)
- ↑ "NHS Profile, 2011". Statistics Canada. Government of Canada. Retrieved 2 June 2016.
| History | ||
|---|---|---|
| Politics | ||
| Geography | ||
| Communities | ||
| Economy |
| |
| Culture | ||
| ||
| Provinces | |
|---|---|
| Territories | |
| |
| Ethnic ancestry |
| ||||||||||||||||||||||||||||||||||||||||||||||||||||||||||||||||||||||||
|---|---|---|---|---|---|---|---|---|---|---|---|---|---|---|---|---|---|---|---|---|---|---|---|---|---|---|---|---|---|---|---|---|---|---|---|---|---|---|---|---|---|---|---|---|---|---|---|---|---|---|---|---|---|---|---|---|---|---|---|---|---|---|---|---|---|---|---|---|---|---|---|---|---|
| Demographics | |||||||||||||||||||||||||||||||||||||||||||||||||||||||||||||||||||||||||
| Culture & society | |||||||||||||||||||||||||||||||||||||||||||||||||||||||||||||||||||||||||
| List of Canadians |
| ||||||||||||||||||||||||||||||||||||||||||||||||||||||||||||||||||||||||
| |||||||||||||||||||||||||||||||||||||||||||||||||||||||||||||||||||||||||