DOT (graph description language)
DOT is a plain text graph description language. DOT graphs are typically files with the file extension gv or dot. The extension gv is preferred to avoid confusion with the extension dot used by early (pre-2007) versions of Microsoft Word.[1]
Various programs can process DOT files. Some, such as OmniGraffle, dot, neato, twopi, circo, fdp, and sfdp, can read a DOT file and render it in graphical form. Others, such as gvpr, gc, acyclic, ccomps, sccmap, and tred, read DOT files and perform calculations on the represented graph. Finally, others, such as lefty, dotty, and grappa, provide an interactive interface. The GVedit tool combines a text editor with noninteractive image viewer. Most programs are part of the Graphviz package or use it internally.
Syntax
Graph types
Undirected graphs

At its simplest, DOT can be used to describe an undirected graph. An undirected graph shows simple relations between objects, such as friendship between people. The graph keyword is used to begin a new graph, and nodes are described within curly braces. A double-hyphen (--) is used to show relations between the nodes.
 // The graph name and the semicolons are optional
 graph graphname {
     a -- b -- c;
     b -- d;
 }
Directed graphs
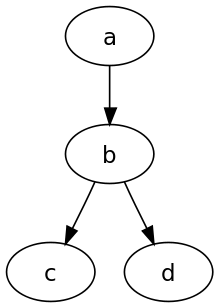
Similar to undirected graphs, DOT can describe directed graphs, such as flowcharts and dependency trees. The syntax is the same as for undirected graphs, except the digraph keyword is used to begin the graph, and an arrow (->) is used to show relationships between nodes.
 digraph graphname {
     a -> b -> c;
     b -> d;
 }
Attributes
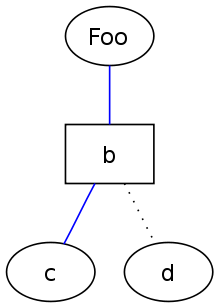
Various attributes can be applied to graphs, nodes and edges in DOT files.[2] These attributes can control aspects such as color, shape, and line styles. For nodes and edges, one or more attribute-value pairs are placed in square brackets ([]) after a statement and before the semicolon (which is optional). Graph attributes are specified as direct attribute-value pairs under the graph element. Multiple attributes are separated by a comma or using multiple sets of square brackets. Node attributes are placed after a statement containing only the name of the node, and no relations.
 graph graphname {
     // This attribute applies to the graph itself
     size="1,1";
     // The label attribute can be used to change the label of a node
     a [label="Foo"];
     // Here, the node shape is changed.
     b [shape=box];
     // These edges both have different line properties
     a -- b -- c [color=blue];
     b -- d [style=dotted];
     // [style=invis] hides a node.
 }
HTML-like labels are only available on versions of Graphviz that are newer than mid-November 2003. In particular, they are not part of release 1.10.[3]
Comments
Dot supports C and C++ style single line and multiple line comments. In addition, it ignores lines with a number sign symbol (#) as their first character.
 // This is a single line comment.
 /* This is a
    multiple line
    comment. */
 # Lines like this are also ignored.
A simple example

dottyFollowing is an example script that describes the bonding structure of an ethane molecule. This is an undirected graph and contains node attributes as explained above.
 graph ethane {
     C_0 -- H_0 [type=s];
     C_0 -- H_1 [type=s];
     C_0 -- H_2 [type=s];
     C_0 -- C_1 [type=s];
     C_1 -- H_3 [type=s];
     C_1 -- H_4 [type=s];
     C_1 -- H_5 [type=s];
 }
Layout programs
.svg.png)
The DOT language defines a graph, but does not provide facilities for rendering the graph. There are several programs that can be used to render, view, and manipulate graphs in the DOT language:
- Graphviz - A collection of libraries and utilities to manipulate and render graphs
- Canviz - a JavaScript library for rendering dot files.
- Viz.js - A simple Graphviz JavaScript client
- Grappa - A partial port of Graphviz to Java.[4][5]
- Beluging - A Python & Google Cloud based viewer of DOT and Beluga extensions.
- Tulip can import dot files for analysis
- OmniGraffle can import a subset of DOT, producing an editable document. (The result cannot be exported back to DOT, however.)
- ZGRViewer, a GraphViz/DOT Viewer link
- VizierFX, A Flex graph rendering library link
- Gephi - an interactive visualization and exploration platform for all kinds of networks and complex systems, dynamic and hierarchical graphs
Limitations

It is possible to specify layout details with DOT, although not all tools that implement the DOT language pay attention to the position attributes. Thus, depending on the tools used, users must rely on automated layout algorithms (potentially resulting in unexpected output) or tediously hand-positioned nodes.
For example:
digraph g {
	node [shape=plaintext];
	A1 -> B1;
	A2 -> B2;
	A3 -> B3;

	A1 -> A2 [label=f];
	A2 -> A3 [label=g];
	B2 -> B3 [label="g'"];
	B1 -> B3 [label="(g o f)'" tailport=s headport=s];

	{ rank=same; A1 A2 A3 }
	{ rank=same; B1 B2 B3 }
}

There are two problems in the image above. The square on the right is not a perfect square and the label "(g o f)'" is in the wrong place.
This can be fixed with Inkscape or other SVG editors. In some cases, this can also be fixed by using the pos attribute to specify a position.
See also
- lisp2dot tool to convert Lisp programming language-like program trees to DOT language. Designed for use with genetic programming.
- Images with Dot source code at commons
Notes
- ↑ "File extension .dot or .gv?". Retrieved 2011-03-08.
- ↑ "Node, Edge and Graph Attributes".
- ↑ HTML-Like Labels
- ↑ AT&T Labs Research - Grappa. .research.att.com. Retrieved on 2013-07-12.
- ↑ http://www2.research.att.com/~john/Grappa/grappa.tgz
External links
- DOT tutorial and specification
- Webapp generating DOT descriptions of Huffman trees
- Online graph visualization in SVG
- Boost Graph Library
- Grappa Drawing Package