Cumberland Valley School District
| Cumberland Valley School District | |
|---|---|
|
"Soaring to greatness, committed to excellence." | |
| Address | |
|
6746 Carlisle Pike Mechanicsburg, Pennsylvania, Cumberland County 17050-1711 United States | |
| Information | |
| Type | Public |
| School board | 9 locally elected members |
| Superintendent |
Dr Frederick S Withum, III, salary $145,000[1] (Contract October 1, 2013 to September 30, 2016)[2] |
| School number | (717) 697-8261 |
| Administrator |
Mr Michael M Willis, Business Manager |
| Director | Beverly Wilson ($102,621 in 2012) |
| Principal | Judy Baumgardner, HS ($99,395 2013) |
| Principal | Chad Runkle, HES |
| Principal | Amy Lena, GRES |
| Principal | Mrs Megan Ward, MES |
| Staff | 481 non teaching staff (2012),[4] 476 non teaching staff members (2011) |
| Faculty | 516 teachers (2012), 518 teachers (2010) [5] |
| Grades | K-12 |
| Age | 5 years to 21 years old special education students |
| Pupils |
8,050 pupils (2013)[6] |
| • Kindergarten | 538 (2012),[9] 537 (2010) |
| • Grade 1 | 571 (2012), 492 |
| • Grade 2 | 606 (2012), 557 |
| • Grade 3 | 616 (2012), 593 |
| • Grade 4 | 569 (2012), 556 |
| • Grade 5 | 605 (2012), 613 |
| • Grade 6 | 642 (2012), 571 |
| • Grade 7 | 628 (2012), 598 |
| • Grade 8 | 670 (2012), 686 |
| • Grade 9 | 625 (2012), 601 |
| • Grade 10 | 648 (2012), 636 |
| • Grade 11 | 701 (2012), 629 |
| • Grade 12 | 631 (2012), 665 (2010) |
| Language | English |
| Color(s) | Red and White |
| Sports | PIAA and club sports. |
| Mascot | Eagles |
| Budget |
$111 million (2014-15)[10] |
| Per pupil spending | $12,902 (2008) |
| Per pupil spending | $12,633.80 (2011) |
| Website | http://www.cvschools.org/ |
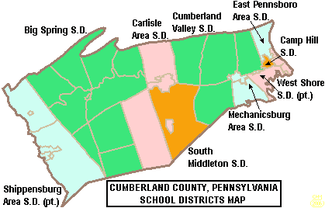
The Cumberland Valley School District is a large, rural and suburban public school district located in Central Pennsylvania. It covers Hampden Township, Monroe Township, Middlesex Township and Silver Spring Township in Cumberland County, Pennsylvania. According to 2000 federal census data, it served a resident population of 46,926. By 2010, the district's population increased to 54,670 people.[14] In 2009, the district residents’ per capita income was $28,440, while the median family income was $66,515.[15] In the Commonwealth, the median family income was $49,501 [16] and the United States median family income was $49,445, in 2010.[17] By 2013, the median household income in the United States rose to $52,100.[18]
According to District officials, in school year 2007-08 the Cumber;land Valley School District provided basic educational services to 7,640 pupils. It employed: 610 teachers, 423 full-time and part-time support personnel, and 54 administrators. Cumberland Valley School District received more than $20.4 million in state funding in school year 2007-08. The district utilizes an independent administration building.
In 2011, the district agreed to participate in a pilot program to develop a new way to evaluate teachers that, in part, takes into account student achievement. Several Cumberland County school districts are participating, including: Big Spring School District, Carlisle Area School District and Camp Hill School District.[19] The pilot program had 104 K-12 entities, including: nine career and technical centers, nine charter schools and nine intermediate units. Beginning in January 2012, Cumberland County schools will use the new evaluation method and provide feedback to the Pennsylvania Department of Education. This new evaluation will not be used to determine an educator’s official 2011-12 assessment.
The district is served by the Capital Area Intermediate Unit 15, which offers a variety of services, including a completely developed K-12 curriculum that is mapped and aligned with the Pennsylvania Academic Standards (available online), shared services, a group purchasing program and a wide variety of special education and special needs services.
In 2007, the Pennsylvania Legislature commissioned a Costing Out Study to identify the cost of public education. Cumberland Valley School District was recognized as achieving high percentages of students scoring either advanced or proficient on the annual PSSA math and reading tests; and having relatively low per-pupil expenditures.[20] Cumberland Valley School District was one of only 87 schools districts that were identified as high performing in student achievement of the Pennsylvania Academic Standards. Efficiency was gauged by administrative spending, number of teachers per pupil and maintenance/operation spending per pupil.[20]
Governance
The District is governed by 9 individually elected board members (serve four-year terms), the Pennsylvania State Board of Education, the Pennsylvania Department of Education and the Pennsylvania General Assembly.[21] The federal government controls programs it funds like Title I funding for low-income children in the Elementary and Secondary Education Act and the No Child Left Behind Act, which mandates the district focus resources on student success in acquiring reading and math skills.
The Commonwealth Foundation for Public Policy Alternatives Sunshine Review gave the school board and district administration a "D-" for transparency based on a review of "What information can people find on their school district's website". It examined the school district's website for information regarding; taxes, the current budget, meetings, school board members names and terms, contracts, audits, public records information and more.[22]
Schools
Cumberland Valley School District operates seven Elementary Schools (K-5th), two Middle Schools (6th-8th) and Cumberland Valley High School (9th-12th).
|
|
Academic achievement
In 2014, Cumberland Valley School District ranked 36th out of 496 Pennsylvania public school districts, by the Pittsburgh Business Times.[23] The ranking is based on the last 3 years of student academic achievement as demonstrated by PSSAs results in: reading, writing, math and science and the three Keystone Exams (literature, Algebra 1, Biology I) in high school.[24] Three school districts were excluded because they do not operate high schools (Saint Clair Area School District, Midland Borough School District, Duquesne City School District). The PSSAs are given to all children in grades 3rd through 8th. Adapted PSSA examinations are given to children in the special education programs. Writing exams were given to children in 5th and 8th grades.
- 2013 - 32nd[25]
- 2012 - 27th
- 2011 - 23rd[26]
- 2010 - 20th [27]
- 2009 - 19th
- 2008 - 24th
- 2007 - 24th [28]
- District AYP status history
In 2012, Cumberland Valley School District declined to Warning AYP status.[29] In 2011, Cumberland Valley School District achieved Adequate Yearly Progress (AYP). In 2011, 94 percent of the 500 Pennsylvania public school districts achieved the No Child Left Behind Act progress level of 72% of students reading on grade level and 67% of students demonstrating on grade level math. In 2011, 46.9 percent of Pennsylvania school districts achieved Adequate Yearly Progress (AYP) based on student performance. An additional 37.8 percent of school districts made AYP based on a calculated method called safe harbor, 8.2 percent on the growth model and 0.8 percent on a two-year average performance.[30] School District achieved AYP status each year from 2006 to 2009, while in 2005 and 2003 the District was in Warning status due to lagging student achievement.[31]
Graduation rate
The graduation rate for Cumberland Valley School District was 93.42% in 2013.[32] The graduation rate for Cumberland Valley School District was 93% in 2012.[33] In 2011, the graduation rate at Cumberland Valley School District was 91%.[34] In 2010, the Pennsylvania Department of Education issued a new, 4-year cohort graduation rate. Cumberland Valley High School's rate was 91% for 2010.[35]
High school
Cumberland Valley High School is located at 6746 Carlisle Pike. In 2013, enrollment was reported as 2,582 pupils in 9th through 12th grades, with 11.62% of pupils eligible for a free lunch due to family poverty. Additionally, 12% of pupils received special education services, while 7.47% of pupils were identified as gifted. The school employed 165 teachers.[41] Per the PA Department of Education, 1% of the teachers were rated "Non‐Highly Qualified" under the federal No Child Left Behind Act.
According to the National Center for Education Statistics, in 2010, Cumberland Valley High School reported an enrollment of 2,547 pupils in grades 9th through 12th, with 233 pupils eligible for a federal free or reduced-price lunch. The school employed 174 teachers, yielding a student–teacher ratio of 14:1.[42] According to a report by the Pennsylvania Department of Education, 1 teacher was rated "Non‐Highly Qualified" under No Child Left Behind.[43]
- 2013 School Performance Profile
Cumberland Valley High School achieved 88.7 out of 100. Reflects on grade level reading, mathematics and science achievement. In reading/literature - 90% were on grade level. In Algebra 1, 84% showed on grade level skills at the end of the course. In Biology, just 67% showed on grade level science understanding at the end of the course.[44] According to the Pennsylvania Department of Education, 2,181 public schools (less than 73 percent of Pennsylvania public schools), achieved an academic score of 70 or higher. Pennsylvania 11th grade students no longer take the PSSAs. Instead, beginning in 2012, they take the Keystone Exams at the end of the associated course.[45]
US News and World Report rating In 2014, Cumberland Valley High School was recognized by US News and World Report as a Silver level high school in a nationwide school ranking. Among Pennsylvania high schools (traditional, charter and private) 56 achieved gold or silver medals. Another 103 high schools achieved bronze rating out of 698 Pennsylvania high schools reviewed.[46]
- AYP history
In 2012, Cumberland Valley High School declined to Warning AYP status due to missing several academic metrics.[47] In 2011, the Cumberland Valley High School achieved Adequate Yearly Progress (AYP) status. In 2010, Cumberland Valley High School also achieved AYP status.[48]
- PSSA Results
Pennsylvania System of School Assessments, commonly called PSSAs are No Child Left Behind Act related examinations which were administered from 2003 through 2012, in all Pennsylvania public high schools. The exams were administered in the Spring of each school year. The goal was for 100% of students to be on grade level or better in reading and mathematics, by the Spring of 2014. The tests focused on the state's Academic Standards for reading, writing, mathematics and science. The Science exam included content in science, technology, ecology and the environmental studies. The mathematics exam included: algebra I, algebra II, geometry and trigonometry. The standards were first published in 1998 and are mandated by the Pennsylvania State Board of Education.[49]
In 2013, the Commonwealth of Pennsylvania changed its high school assessments to the Keystone Exams in Algebra 1, Reading/literature and Biology1. The exams are given at the end of the course, rather than all in the spring of the student's 11th grade year.[50]
|
|
In 2010, Cumberland Valley High School 11th graders were ranked 36th among high schools and charter schools, in Pennsylvania, for mathematics academic achievement.[60]
- 11th Grade Science:
- 2012 - 64% on grade level (5% below basic). State - 42% of 11th graders were on grade level.[61]
- 2011 - 70%, (2% below basic). State - 40%
- 2010 - 68%, State - 39%.
- 2009 - 65%, State - 40%.[62]
- 2008 - 59%, State - 39% [63]
Science in Motion Cumberland Valley High School took advantage of a state program called Science in Motion which brought college professors and sophisticated science equipment to the school to raise science awareness and to provide inquiry-based experiences for the students. The Science in Motion program was funded by a state appropriation and cost the school nothing to participate.[64] Gettysburg College provided the science enrichment experiences to schools in the region.
College remediation
According to a Pennsylvania Department of Education study released in January 2009, 30% of Cumberland Valley High School graduates required remediation in mathematics and or reading before they were prepared to take college level courses in the Pennsylvania State System of Higher Education or community colleges.[65] Less than 66% of Pennsylvania high school graduates, who enroll in a four-year college in Pennsylvania, will earn a bachelor's degree within six years. Among Pennsylvania high school graduates pursuing an associate degree, only one in three graduate in three years.[66] Per the Pennsylvania Department of Education, one in three recent high school graduates who attend Pennsylvania's public universities and community colleges takes at least one remedial course in math, reading or English.
College Preparedness/AP/IB - The high school offers College in the Classroom opportunities for its students through an affiliation with HACC, Central Pennsylvania's Community College. In addition, the high school offers a total of 27 Advanced Placement courses. In 2010, 395 CV High School students took a total of 702 AP exams. Those numbers are up from 212 students and 401 tests in 2009, and 82 students and 169 tests in 2002. The IB Diploma Programme (International Baccalaureate Programme) is coming to Cumberland Valley. The first IB Diploma class will graduate in 2013 and will begin IB courses in the fall of 2011.[67]
Graduation requirements
The Cumberland Valley School Board has determined that 23 credits are required to graduate, including: English 4 credits, Social Studies 4 credits, Mathematics 4 credits, Science 4 credits, Health and Physical education 2 credits, and Arts humanities 2 credits.[68]
By law, all Pennsylvania secondary school students must complete a project as a part of their eligibility to graduate from high school. The type of project, its rigor and its expectations are set by the individual school district.[69] Effective with the graduating class of 2017, the Pennsylvania State Board of Education eliminated the state mandate that students complete a culminating project in order to graduate.[70]
By Pennsylvania School Board regulations, beginning with the class of 2017, public school students must demonstrate successful completion of secondary level course work in Algebra I, Biology, and English Literature by passing the Keystone Exams.[71] The exam is given at the end of the course. Keystone Exams replace the PSSAs for 11th grade. Students have several opportunities to pass the exam, with those who do not able to perform a project in order to graduate.[72][73] For the class of 2019, a Composition exam will be added. For the class of 2020, passing a civics and government exam will be added to the graduation requirements.[74] In 2011, Pennsylvania high school students field tested the Algebra 1, Biology and English Lit exams. The statewide results were: Algebra 1 38% on grade level, Biology 35% on grade level and English Lit - 49% on grade level.[75] Individual student, school or district reports were not made public, although they were reported to district officials by the Pennsylvania Department of Education. Students identified as having special needs and qualifying for an Individual Educational Program (IEP) may graduate by meeting the requirements of their IEP.
SAT scores
In 2013, Cumberland Valley School District students took the SAT exams. The District's Verbal Average Score was 543. The Math average score was 570. The Writing average score was 528. The College Board reported that statewide scores were: 494 in reading, 504 in math and 482 in writing. The nationwide SAT results were the same as in 2012.[76]
In 2012, 467 Cumberland Valley School District students took the SAT exams. The District's Verbal Average Score was 529. The Math average score was 563. The Writing average score was 514. The statewide Verbal SAT exams results were: Verbal 491, Math 501, Writing 480. In the USA, 1.65 million students took the exams achieving scores: Verbal 496, Math 514, Writing 488. According to the College Board the maximum score on each section was 800, and 360 students nationwide scored a perfect 2,400.
In 2011, 467 Cumberland Valley School District students took the SAT exams. The District's Verbal Average Score was 525. The Math average score was 556. The Writing average score was 493.[77] Pennsylvania ranked 40th among states with SAT scores: Verbal - 493, Math - 501, Writing - 479.[78] In the United States, 1.65 million students took the exam in 2011. They averaged 497 (out of 800) verbal, 514 math and 489 in writing.[79]
AP Courses
In 2013, Cumberland Valley High School offered 26 Advanced Placement (AP) courses at a higher cost than regular courses. The student pays the fee for the exam which was $89 per test per pupil in 2012. Students have the option of taking College Board approved courses and then taking the College Board's examination in the Spring. Students, who achieve a 3 or better on the exam, may be awarded college credits at US universities and colleges. Each higher education institution sets its own standards about what level of credits are awarded to a student based on their AP exam score. Most higher education give credits for scores of 4 or 5. Some schools also give credits for scores of 3. High schools give credits towards graduation to students who take the school's AP class. At Cumberland Valley High School 83.7% of students who took an AP course earned a 3 or better on the exam.[80]
Eagle View Middle School
Eagle View Middle School is located at 6746 Carlisle Pike. In 2013, enrollment was 933 pupils, in grades 6th through 8th, with 18.9% of pupils eligible for a free lunch due to family poverty. Additionally, 14% of pupils received special education services, while 7.7% of pupils were identified as gifted.[81] According to a 2013 report by the Pennsylvania Department of Education, 100% of its teachers were rated "Highly Qualified" under No Child Left Behind.[82]
According to the National Center for Education Statistics, in 2010, Eagle View Middle School reported an enrollment of 939 pupils in grades 6th through 8th, with 145 pupils receiving a federal free or reduced-price lunch due to family poverty. The school employed 67 teachers, yielding a student–teacher ratio of 14:1.[83] According to a report by the Pennsylvania Department of Education, 1 teacher was rated "Non‐Highly Qualified" under No Child Left Behind, while 16 teachers had emergency certification.[84] In 2011 and 2012, the school achieved AYP status.
- 2013 School Performance Profile
Eagle View Middle School achieved 85.6 out of 100. Reflects on grade level reading, writing, mathematics and science achievement. In reading, 82% of the students were on grade level. In Mathematics/Algebra 1, 87.6% of the students showed on grade level skills. In Science, only 77% of the 8th graders demonstrated on grade level understanding. In writing, 81% of the 8th grade students demonstrated on grade level writing skills.[85]
- AYP History
In 2011 and 2012, Eagle View Middle School achieved AYP status.[86]
- PSSA Results
Sixth and seventh grades have been tested in reading and mathematics since 2006. Eighth graders are tested in: reading, writing, mathematics and Science. Beginning in the Spring of 2013, eighth graders, who are enrolled in Algebra I take the Keystone Exam for Algebra I at the end of the course. The testing of 8th grade in reading and mathematics began in 1999, as a state initiative.[87] Testing in science began in 2007. The goal is for 100% of students to be on grade level or better in reading and mathematics, by the Spring of 2014. The tests focus on the state's Academic Standards for reading, writing, mathematics and science.[88] The standards were published in 1998 and are mandated by the Pennsylvania State Board of Education.[49] In 2014, the Commonwealth adopted the Pennsylvania Core Standards - Mathematics.[89]
|
8th Grade Math: |
8th Grade Science:
- 2012 - 72% on grade level (11% below basic). State - 59% of 8th graders were on grade level.
- 2011 - 79% (9% below basic). State – 58.3%
- 2010 - 80% (9% below basic). State – 57% [93]
- 2009 - 79% (7% below basic). State - 55% [94]
- 2008 - 79% (8% below basic). State - 52% [95]
- 2007 - tested, but results not made public.
|
7th Grade Reading:
|
7th Grade Math:
|
|
6th Grade Reading:
|
6th Grade Math:
|
Good Hope Middle School
Good Hope Middle School is located at 451 Skyport Road, Mechanicsburg. In 2013, enrollment was 1007 pupils, in grades 6th through 8th, with 11% of pupils eligible for a free lunch due to family poverty. Additionally, 12.6% of pupils received special education services, while 10% of pupils were identified as gifted.[96] According to a 2013 report by the Pennsylvania Department of Education, 100% of its teachers were rated "Highly Qualified" under No Child Left Behind.[97]
According to the National Center for Education Statistics, in 2011, the school reported an enrollment of 964 pupils, in grades 6th through 8th, with 92 pupils receiving a federal free or reduced price lunch due to family poverty. The school employed 62 teachers yielding a student-teacher ratio of 15:1.[98] According to a report by the Pennsylvania Department of Education, 18 teachers were rated "Non‐Highly Qualified" under No Child Left Behind.[99] The School was not a federally designated Title I school.
- 2013 School Performance Profile
Good Hope Middle School achieved 91.8 out of 100. Reflects on grade level reading, writing, mathematics and science achievement. In reading, 86.7% of the students were on grade level. In Mathematics/Algebra 1, 90.1% of the students showed on grade level skills. In Science, 81.8% of the 8th graders demonstrated on grade level understanding. In writing, 88% of the 8th grade students demonstrated on grade level writing skills.[100]
- AYP History
From 2003 through 2012, Good Hope Middle School achieved AYP status each school year.[101]
Green Ridge Elementary School
Green Ridge Elementary School is located 1 Green Ridge Road, Mechanicsburg. In 2013, the School's enrollment was 471 pupils in grades kindergarten through 5th, with 14% of pupils receiving a federal free or reduced price meals due to family poverty. Additionally, 8.7% of the pupils receive special education services, while less than 1% are identified as gifted.[102] According to a report by the Pennsylvania Department of Education, 100% of the teachers were rated highly qualified under No Child Left Behind. The school provides half day kindergarten and full day kindergarten.[103] The school is not a federally designated Title I school.
- 2013 School Performance Profile
Green Ridge Elementary School achieved a score of 85.6 out of 100. The score reflects on grade level: reading, science, writing and mathematics achievement. In 2012-13, 82% of the students were reading on grade level in grades 3rd through 5th. In 3rd grade, 85.8% of the pupils were reading on grade level. In math, 85.5% were on grade level (3rd-5th grades). In 4th grade science, 90.7% of the pupils demonstrated on grade level understanding. In writing, 79% of 5th grade pupils demonstrated on grade level writing skills.[104]
- AYP history
From 2003 through 2012, Green Ridge Elementary School achieved AYP status every school year.[105]
Hampden Elementary School
Hampden Elementary School is located at 441 Skyport Road, Mechanicsburg. In 2013, the School's enrollment was 671 pupils in grades kindergarten through 5th, with 6.5% of pupils receiving a federal free or reduced price meals due to family poverty. Additionally, 5.9% of the pupils receive special education services, while 1% are identified as gifted.[106] According to a report by the Pennsylvania Department of Education, 100% of the teachers were rated highly qualified under No Child Left Behind. The school provides half day kindergarten and full day kindergarten.[107] The school is not a federally designated Title I school.
- 2013 School Performance Profile
Hampden Elementary School achieved a score of 83.4 out of 100. The score reflects on grade level: reading, science, writing and mathematics achievement. In 2012-13, 84% of the students were reading on grade level in grades 3rd through 5th. In 3rd grade, 89% of the pupils were reading on grade level. In math, 90% were on grade level (3rd-5th grades). In 4th grade science, 91% of the pupils demonstrated on grade level understanding. In writing, 86% of 5th grade pupils demonstrated on grade level writing skills.[108]
- AYP status history
From 2003 through 2012, Hampden Elementary School achieved AYP status every school year.[109]
Middlesex Elementary School
Middlesex Elementary School is located at. In 2013, the School's enrollment was 380 pupils in grades kindergarten through 5th, with 32% of pupils receiving a federal free or reduced price meals due to family poverty. Additionally, 18% of the pupils receive special education services, while none are identified as gifted.[110] According to a report by the Pennsylvania Department of Education, 100% of the teachers were rated highly qualified under No Child Left Behind. The School provides half day kindergarten and full day kindergarten.[111] The School is a federally designated Title I school.
- 2013 School Performance Profile
Middlesex Elementary School achieved a score of 88.7 out of 100. The score reflects on grade level: reading, science, writing and mathematics achievement. In 2012-13, 83% of the students were reading on grade level in grades 3rd through 5th. In 3rd grade, 85% of the pupils were reading on grade level. In math, 88.7% were on grade level (3rd-5th grades). In 4th grade science, 93% of the pupils demonstrated on grade level understanding. In writing, only 85% of 5th grade pupils demonstrated on grade level skills.[112]
- AYP status history
From 2003 through 2012, Middlesex Elementary School achieved AYP status every school year.[113]
Monroe Elementary School
Monroe Elementary School is located at 1240 Boiling Springs Road, Boiling Springs. In 2013, the School's enrollment was 346 pupils in grades kindergarten through 5th, with 21.6% of pupils receiving a federal free or reduced price meals due to family poverty. Additionally, 14% of the pupils receive special education services, while 2% are identified as gifted.[114] According to a report by the Pennsylvania Department of Education, 100% of the teachers were rated highly qualified under No Child Left Behind. The school provides half day kindergarten.[115] Monroe Elementary School is a federally designated Title I school.
According to the National Center for Education Statistics, in 2011, enrollment was 292 pupils in grades kindergarten through 5th, with 53 pupils receiving a free or reduced price lunch. Monroe Elementary School employed 25 teachers yielding a student-teacher ratio of 11:1.[116] According to a report by the Pennsylvania Department of Education, 100% of its teachers were rated "Highly Qualified" under the federal No Child Left Behind Act.[117] Monroe Elementary School provided full day and half day kindergarten to its pupils.[118]
- 2013 School Performance Profile
Monroe Elementary School achieved a score of 78.4 out of 100. The score reflects on grade level: reading, science, writing and mathematics achievement. In 2012-13, only 76% of the students were reading on grade level in grades 3rd through 5th. In 3rd grade, 77.9% of the pupils were reading on grade level. In math, 86.9% were on grade level (3rd-5th grades). In 4th grade science, 85% of the pupils demonstrated on grade level understanding. In writing, 80% of 5th grade pupils demonstrated on grade level skills.[119] According to the Pennsylvania Department of Education, 2,181 public schools (less than 73 percent of Pennsylvania public schools), achieved an academic score of 70 or higher.
- AYP status history
In 2011 and 2012, Monroe Elementary School achieved AYP status.[120]
Shaull Elementary School
Shaull Elementary School is located at 1 Shaull Drive, Enola. In 2013, Shaull Elementary School's enrollment was 593 pupils in grades kindergarten through 5th, with 7% of pupils receiving a federal free or reduced price meals due to family poverty. Additionally, 8.7% of the pupils receive special education services, while 2.7% are identified as gifted.[121] According to a report by the Pennsylvania Department of Education, 100% of the teachers were rated highly qualified under No Child Left Behind. The School provides both full day and half day kindergarten.[122] The School is not a federally designated Title I school.
According to the National Center for Education Statistics, in 2011, enrollment was pupils in grades kindergarten through 5th, with 24 pupils receiving a free or reduced price lunch. Shaull Elementary School employed 39 teachers yielding a student-teacher ratio of 14:1.[123] According to a report by the Pennsylvania Department of Education, 100% of its teachers were rated "Highly Qualified" under the federal No Child Left Behind Act.[124] Shaull Elementary School provided full day or half day kindergarten to its pupils.[118]
- 2013 School Performance Profile
Shaull Elementary School achieved a score of 86.4 out of 100. The score reflects on grade level: reading, science, writing and mathematics achievement. In 2012-13, 91% of the students were reading on grade level in grades 3rd through 5th. In 3rd grade, 97% of the pupils were reading on grade level. In math, 94% were on grade level (3rd-5th grades). In 4th grade science, 91% of the pupils demonstrated on grade level understanding. In writing, 93% of 5th grade pupils demonstrated on grade level writing skills.[125]
- AYP status history
From 2003 through 2012, Shaull Elementary School achieved AYP status every school year.[126]
Silver Spring Elementary School
Silver Spring Elementary School is located at 6746 Carlisle Pike, Mechanicsburg. In 2013, the School's enrollment was 443 pupils in grades kindergarten through 5th, with 17% of pupils receiving a federal free or reduced price meals due to family poverty. Additionally, 8.5% of the pupils receive special education services, while 1.5% are identified as gifted.[127] According to a report by the Pennsylvania Department of Education, 100% of the teachers were rated highly qualified under No Child Left Behind. The School provides half day kindergarten and full day kindergarten.[128] Silver Spring Elementary School is a federally designated Title I school.
According to the National Center for Education Statistics, in 2011, enrollment was 515 pupils in grades kindergarten through 5th, with 82 pupils receiving a free or reduced price lunch. The School employed 33 teachers yielding a student-teacher ratio of 15:1.[129] Per a report by the Pennsylvania Department of Education, 100% of its teachers were rated "Highly Qualified" under the federal No Child Left Behind Act.[130] The School provided full day kindergarten to its pupils.[118]
- 2013 School Performance Profile
Silver Spring Elementary School achieved a score of 79.2 out of 100. The score reflects on grade level: reading, science, writing and mathematics achievement. In 2012-13, only 73% of the students were reading on grade level in grades 3rd through 5th. In 3rd grade, 69.8% of the pupils were reading on grade level. In math, 88.6% were on grade level (3rd-5th grades). In 4th grade science, 94.6% of the pupils demonstrated on grade level understanding. In writing, only 62% of 5th grade pupils demonstrated on grade level skills.[131]
- AYP status history
From 2003 through 2012, Silver Spring Elementary School achieved AYP status each school year.[132]
Sporting HIll Elementary school
Sporting HIll Elementary School is located at 210 S. Sporting Hill Road in Mechanicsburg, PA. In 2013, the School's enrollment was 601 pupils in grades kindergarten through 6th grade, with 19.6% of pupils receiving federal free or reduced price meals due to family poverty. Additionally, 9% of the pupils receive special education services, while 2% are identified as gifted.[133] According to a report by the Pennsylvania Department of Education, 100% of the teachers were rated highly qualified under No Child Left Behind. The School provides half day and full day kindergarten.[134] The Sporting HIll Elementary School is a federally designated Title I school.
According to the National Center for Education Statistics, in 2011, enrollment was 564 pupils in grades kindergarten through 5th, with 88 pupils receiving a free or reduced price lunch. The School employed 36 teachers yielding a student-teacher ratio of 15:1.[135] Per a report by the Pennsylvania Department of Education, 100% of its teachers were rated "Highly Qualified" under the federal No Child Left Behind Act.[136] The School provided half day and full day kindergarten to its pupils.[118]
- 2013 School Performance Profile
Sporting Hill Elementary School achieved a score of 81.5 out of 100. The score reflects on grade level: reading, science, writing and mathematics achievement. In 2012-13, only 71% of the students were reading on grade level in grades 3rd through 5th. In 3rd grade, 76% of the pupils were reading on grade level. In math, 82% were on grade level (3rd-5th grades). In 4th grade science, 83% of the pupils demonstrated on grade level understanding. In writing, only 72% of 5th grade pupils demonstrated on grade level writing skills.[137]
- AYP status history
From 2003 through 2012, Sporting HIll Elementary School achieved AYP status each school year.[138]
Special education
In December 2012, Cumberland Valley School District reported that 11.8% of students or 957 children received special education services, with 41% of identified students having a specific learning disability. In December 2010, Cumberland Valley School District reported that 12.5% of students or 969 children received special education services, with 42% of identified students having a specific learning disability. In December 2008, the district reported that 13.3% of students or 1021 children received special education services.[139] The Cumberland Valley School District provides a variety of opportunities for the screening and evaluation of students thought to have disabilities. In kindergarten all students receive screenings on readiness as well as standardized indicators of early literacy.[140]
In 2010, the state of Pennsylvania provided $1,026,815,000 for Special Education services. The funds were distributed to districts based on a state policy which estimates that 16% of the district's pupils are receiving special education services. This funding is in addition to the state's basic education per pupil funding, as well as, all other state and federal funding.[141]
Cumberland Valley School District received a $3,330,876 supplement for special education services in 2010.[142] For the 2011-12 and 2012-13 school years, all Pennsylvania public school districts received the same level of funding for special education that they received in 2010-11. This level funding is provided regardless of changes in the number of pupils who need special education services and regardless of the level of services the respective students required.[143][144]
Gifted education
The District Administration reported that 417 or 5.40% of its students were gifted in 2009.[145] By law, the district must provide mentally gifted programs at all grade levels. The primary emphasis is on enrichment and acceleration of the regular education curriculum. Students identified as gifted attending the High School have access to a variety of AP courses. The referral process for a gifted evaluation can be initiated by teachers or parents by contacting the student’s building principal and requesting an evaluation. All requests must be made in writing. To be eligible for mentally gifted programs in Pennsylvania, a student must have a cognitive ability of at least 130 as measured on a standardized ability test by a certified school psychologist. Other factors that indicate giftedness will also be considered for eligibility.[146]
Budget
Pennsylvania public school districts budget and expend funds according to procedures mandated by the General Assembly and the Pennsylvania Department of Education (PDE). An annual operating budget is prepared by school district administrative officials. A uniform form is furnished by the PDE and submitted to the board of school directors for approval prior to the beginning of each fiscal year on July 1.
Under Pennsylvania’s Taxpayer Relief Act, Act 1 of the Special Session of 2006, all school districts of the first class A, second class, third class and fourth class must adopt a preliminary budget proposal. The proposal must include estimated revenues and expenditures and the proposed tax rates. This proposed budget must be considered by the Board no later than 90 days prior to the date of the election immediately preceding the fiscal year. The preliminary budget proposal must also be printed and made available for public inspection at least 20 days prior to its adoption. The board of school directors may hold a public hearing on the budget, but are not required to do so. The board must give at least 10 days’ public notice of its intent to adopt the final budget according to Act 1 of 2006.[147]
In 2013, the average teacher salary in Cumberland Valley School District was $55,710 a year, while the cost of the benefits teachers received was $23,917 per employee, for a total annual average teacher compensation of $79,626.[148] The District employed 723 teachers and administrators, with a top salary of $156,825.[149][150]
In 2011, Cumberland Valley School Board and Cumberland Valley teachers' union arrived at an agreement on a four-year, teachers' employment contract that includes an average salary increases of 3.15 percent each year.[151] In 2011, the average teacher salary in Cumberland Valley School District was $54,803 a year, while the cost of the benefits teachers receive was $15,660 per employee, for a total annual average teacher compensation of $70,463.77.[152] The District employed 608 teachers and administrators with a top salary of $156,825.[153] According to a study conducted at the American Enterprise Institute, in 2011, public school teachers’ total compensation is roughly 50 percent higher than they would likely receive in the private sector. The study found that the most generous benefits that teachers receive are not accounted for in many studies of compensation, including: pension, retiree health benefits and job security.[154]
In 2009, Cumberland Valley School District employed over 600 teachers with an average salary of $53,067 for 180 days of student instruction day.[155] Teachers work an 8-hour day. Additionally, the teachers receive a defined benefit pension, health insurance, professional development reimbursement, 3 paid personal days, 10 paid sick days which accumulate, life insurance, retirement bonus and other benefits.[156] According to Rep. Glen Grell, a trustee of the state teacher retirement fund, a 40-year educator can retire with a pension equal to 100 percent of their final salary.[157]
In 2007, the district employed 505 teachers. The average teacher salary in the district was $49,738 for 180 days worked.[158] As of 2007, Pennsylvania ranked in the top 10 states in average teacher salaries. When adjusted for cost of living Pennsylvania ranked fourth in the nation for teacher compensation.[159]
- Administrative costs
Cumberland Valley School District administrative costs per pupil was $534.98 in 2008. The lowest administrative cost per pupil in Pennsylvania was $398 per pupil.[160] School Superintendent Harner was awarded a beginning salary of $150,000 when he was hired in 2008. This was the second highest superintendent salary out of the 28 school districts in the region.[161] The Pennsylvania School Board Association tracks salaries for Pennsylvania public school employees. It reports that in 2008 the average superintendent salary in Pennsylvania was $122,165.[162] In 2013, long time Superintendent William Harner (salary $156,825 in 2012) stepped down to become the Pennsylvania Secretary of Education.[163] He received a $25,000 bonus and severance package.[164] It was later revealed that Harner's employment contract was not renewed by the School Board for cause.[165]
In 2014, Superintendent Withum added 2 assistant superintendents costing nearly $500,000 a year when the costs of salary and benefits are combined. In order to pay for the new assistant superintendent posts, Withum eliminated several other positions, including an administrative and support position, the supervisor of school nurses, a high school administrator and secretarial support position. The homeschool visitor program also was eliminated. The health services coordinator position had paid $92,304 a year including benefits.[166]
Reserves In 2008, Cumberland Valley School District reported an unreserved designated fund balance of $4,689,529.00 and an unreserved-undesignated fund balance of $6,578,986.00.[167] In 2012, Cumberland Valley School Administration reported an increase to $12,365,547 in the unreserved-undesignated fund balance. The District reported $5,645,529 in its unreserved-designated fund in 2012. Cumberland Valley School District had nearly 19 percent of its annual budget held in reserve in 2012-13.[168] By June 2013, the District's reserves had grown to $19, 631,067.[169] Pennsylvania public school district reserve funds are divided into two categories – designated and undesignated. The undesignated funds are not committed to any planned project. Designated funds and any other funds, such as capital reserves, are allocated to specific projects. School districts are required by state law to keep 5 percent of their annual spending in the undesignated reserve funds to preserve bond ratings. By law the state limits the total unreserved-undesignated fund balance at 8% of the annual budget for school districts that have budgets over $19 million a year. According to the Pennsylvania Department of Education, from 2003 to 2010, as a whole, Pennsylvania school districts amassed nearly $3 billion in reserved funds.[170]
Audit In November 2009, the Pennsylvania Auditor General conducted a performance audit of the district. The findings were reported to the administration and school board.[171] In January 2012, the Districts was audited again. Several significant findings were reported to the Board including that the Administration spent $55,445 to place an assistant superintendent on administrative leave for 6 months prior to terminating her employment effective June 30, 2010. The Assistant Superintendent had already submitted a letter of resignation effective June 30, 2010. The District also paid her a retirement bonus of over $9,500.[172]
Per pupil spending In 2008, Cumberland Valley School District reported spending $12,902 per pupil which ranked 184th among 500 Pennsylvania school districts. The district's low student spending coupled with high academic achievement was lauded by the state's Costing Out Study in 2007.[173] By 2010, the District's per pupil spending had increased to $12,633.80. This ranked 338th among the Commonwealth's 500 public school districts.[174] Among the states, Pennsylvania’s total per pupil revenue (including all sources) ranked 11th at $15,023 per student, in 2008-09.[175] In 2007, the Pennsylvania per pupil total expenditures was $12,759.[176] The U.S. Census Bureau reports that Pennsylvania spent $8,191 per pupil in school year 2000-01.[177]
Tuition Students who live in the Cumberland Valley School District's attendance area may choose to attend one of Pennsylvania's 157 public charter schools. A student living in a neighboring public school district or a foreign exchange student may seek admission to Cumberland Valley School District. For these cases, the Pennsylvania Department of Education sets an annual tuition rate for each school district. It is the amount the public school district pays to a charter school for each resident student that attends the charter and it is the amount a nonresident student's parents must pay to attend the Cumberland Valley School District's schools. The 2012 tuition rates are Elementary School - $8,511.46, High School - $9,851.85.[178]
Cumberland Valley School District is funded by a combination of: a local earned income tax - 1.10%, a local real property tax, local service tax - $5, a real estate transfer tax 0.5%, and a per capita tax, coupled with substantial funding from the Commonwealth of Pennsylvania and the federal government.[179] Grants provide an opportunity to supplement school funding without raising local taxes.[180][181] Interest earnings on accounts also provide nontax income to the district. In the Commonwealth of Pennsylvania, pension income and Social Security income are exempted from state personal income tax and local earned income tax, regardless of the level of the individual’s personal wealth.[182]
Current budget information may be found on the district's web site at www.cvschools.org/business.
State basic education funding
According to a report from Representative Todd Stephens office, Cumberland Valley School District receives 21.3% of its annual revenue from the state.[183]
For the 2014-15 school year, Cumberland Valley School District will receive $10,092,981 in State Basic Education funding. The District will also receive $401,836 in new Ready To Learn Block grant. The State’s enacted Education Budget includes $5,526,129,000 for the 2014-2015 Basic Education Funding.[184] The Pennsylvania Education budget also includes Accountability Block Grant funding at $100 million and $241 million in new Ready to Learn funding for public schools that focus on student achievement and academic success. The State is paying $500.8 million to Social Security on the school employees behalf and another $1.16 billion to the state teachers pension system (PSERS). In total, Pennsylvania’s Education budget for K-12 public schools is $10 billion. This was a $305 million increase over 2013-2014 state spending and the greatest amount ever allotted by the Commonwealth for its public schools.[185]
For the 2013-14 school year, the Cumberland Valley School District received a 2.5% increase or $10,090,446 in Pennsylvania Basic Education Funding. This is $241,791 more than its 2012-13 state BEF to the District. Additionally, Cumberland Valley School District received $172,574 in Accountability Block Grant funding to focus on academic achievement and level funding for special education services. Among the public school districts in Cumberland County, Camp Hill School District received the highest percentage increase in BEF at 4.7%. The District has the option of applying for several other state and federal grants to increase revenues. The Commonwealth’s budget increased Basic Education Funding statewide by $123 million to over $5.5 billion. Most of Pennsylvania’s 500 public school districts received an increase of Basic Education Funding in a range of 0.9% to 4%. Eight public school districts received exceptionally high funding increases of 10% to 16%. The highest increase in state funding was awarded to Austin Area School District which received a 22.5% increase in Basic Education Funding.[186] The state funded the PSERS (Pennsylvania school employee pension fund) with $1,017,000,000 and Social Security payments for school employees of $495 million.[187]
For the 2012-13 school year, Cumberland Valley School District received $10,021,229.[188] The Governor's Executive Budget for 2012-2013 includes $9.34 billion for kindergarten through 12th grade public education, including $5.4 billion in basic education funding, which is an increase of $49 million over the 2011-12 budget. The state also provided $100 million for the Accountability Block grant (ABG). Cumberland Valley School District received a $172,574 ABG grant. The state provided $544.4 million for School Employees’ Social Security and $856 million for School Employees’ Retirement fund called PSERS.[189] This amount is a $21,823,000 increase (0.34%) over the 2011-2012 appropriations for Basic Education Funding, School Employees' Social Security, Pupil Transportation, Nonpublic and Charter School Pupil Transportation. Since taking office, Corbett’s first two budgets have restored more than $918 million in support of public schools, compensating for the $1 billion in federal stimulus dollars lost at the end of the 2010-11 school year.
In the 2011-2012 school year, Cumberland Valley School District received $9,848,655 in state Basic Education Funding.[190] Additionally, the district will receive $172,574 in Accountability Block Grant funding.[191] The Pennsylvania Department of Education reports that 875 pupils received a federal free and reduced-price lunch, due to the family meeting the federal poverty level.
In the 2010-2011 school year, Cumberland Valley School District received an increase of 4.89% ($498,791) in Basic Education Funding for a total of $10,702,130. Four Cumberland County school districts received increases of less than 6% in Basic Education Funding in 2010-2011. In Pennsylvania, 15 school districts received Basic Education Funding increases in excess of 10% in 2010. Camp Hill School District received a 13.99% increase while Kennett Consolidated School District in Chester County received the highest with a 23.65% increase in funding.[192] One hundred fifty school districts were allotted the base 2% state funding increase in 2010-2011. The state's hold harmless policy regarding state basic education funding continued where each district received at least the same amount as it received the prior school year, even where enrollment had significantly declined. The amount of increase each school district received was determined by then Governor Edward Rendell and the Secretary of Education Gerald Zahorchak through the allocation set in the state budget proposal made in February each year.[193] This was the second year of Governor Rendell’s policy to fund some districts at a far greater rate than others.
In the 2009-2010 budget year, the Commonwealth of Pennsylvania provided a 3.60% increase in Basic Education funding to the district for a total of $10,203,620. Seven county school districts received increases of less than 6% in Basic Education Funding in 2009-10. Shippensburg Area School District received an 8.43% increase. In Pennsylvania, over 15 school districts received Basic Education Funding increases in excess of 10% in 2009. Muhlenberg School District in Berks County received the highest with a 22.31% increase in funding.[194] The amount of increase each school district received was determined by then Governor Edward G Rendell and the Secretary of Education Gerald Zahorchak through the allocation set in the state budget proposal made in February each year. According to the U.S. Census Bureau, Pennsylvania spent $7,824 Per Pupil in the year 2000. This amount increased up to $12,085 by the year 2008.[195][196]
The state's Basic Education Funding to the Cumberland Valley School District in 2008-09 was $9,848,655.28. In 2009, the District reported that 798 students received free or reduced-price lunches due to low family income. In 2008, there were 722 low-income students.[197]
Pennsylvania school districts also receive additional funding from the state through several other funding allocations, including Reimbursement of Charter School Expenditures; Special Education Funding; Secondary Career & Technical Education Subsidy; and Educational Assistance Program Funding. Plus all Pennsylvania school districts receive federal dollars for various programs including Special Education and Title I funding for children from low income families. In 2010 Pennsylvania spent over $24 billion for public education - local, state and federal dollars combined.
Accountability Block Grants
Beginning in 2004-2005, the state launched the Accountability Block Grant school funding. This program has provided $1.5 billion to Pennsylvania’s school districts. The Accountability Block Grant program requires that its taxpayer dollars are focused on specific interventions that are most likely to increase student academic achievement. These interventions include: teacher training, all-day kindergarten, lower class size K-3rd grade, literacy and math coaching programs that provide teachers with individualized job-embedded professional development to improve their instruction, before or after school tutoring assistance to struggling students, For the 2010-11 school year, the Cumberland Valley School District applied for and received $468,408 in addition to all other state and federal funding. The district used the funding to provide all-day kindergarten for the 6th year and for classroom based teacher coaches to improve instruction.[198][199]
Classrooms for the Future grant
The Classroom for the Future state program provided districts with hundreds of thousands of extra state funding to buy laptop computers for each core curriculum high school class (English, Science, History, Math) and paid for teacher training to optimize the computers use. The program was funded from 2006-2009. Cumberland Valley School District did not apply for funding in 2006-07. In 2007-08 received $247,473 and $279,455 in 2008-09 for a total funding of $526,928.[200] In Cumberland County, Big Spring School District received the highest grant - $695,531. The highest funding statewide was awarded to Philadelphia City School District in Philadelphia County - $9,409,073. In 2010, Classrooms for the Future grant funding was curtailed statewide due to a massive state financial crisis.
Energy project grant
Cumberland Valley School District received a $160,000 solar energy program grant to purchase and install a combined heat and power solar photovoltaic thermal system in Silver Spring Township. The 1-megawatt rooftop and ground-mounted system at the Cumberland Valley High School campus will generate 1.4 million kilowatt hours of energy annually, which could save the school nearly $175,000 in energy costs every year. The total project cost is $5.6 million.[201]
Other grants
Cumberland Valley School District did not participate in the state's: Science Its Elementary grants;[202] the Striving Readers Comprehensive Literacy grants,[203] 2012 and 2013 Pennsylvania Hybrid Learning Grants;[204] Pennsylvania Department of Environmental Protection grants to Promote Environmental Education or Pre-K Counts.
Federal Stimulus grant
Cumberland Valley School District received an extra $2,527,373 in ARRA - Federal Stimulus money to be used in specific programs like special education and meeting the academic needs of low-income students.[205][206] The funding was limited to the 2009-10 and 2010-2011 school years.[207] Due to the temporary nature of the funding, schools were repeatedly advised to use the funds for one-time expenditures like acquiring equipment, making repairs to buildings, training teachers to provide more effective instruction or purchasing books and software.
Race to the Top grant
Cumberland Valley School District officials did not apply for the Race to the Top federal grant.[208] Participation required the administration, the school board and the local teachers' union to sign in support of the grant. In Pennsylvania, 120 public school districts and 56 charter schools agreed to participate.[209] Pennsylvania was not approved for the grant. The failure of public school districts to agree to participate was cited as one reason that Pennsylvania was not approved.[210]
Real estate taxes
In June 2014, the Cumberland Valley School Board set the property taxes rate at 8.898 mills for the 2014-2015 school year.[211] The average assessed property in the District is $249,500. With the 2.1% tax increase in 2014, the average homeowner in the District will pay $2,220.51. A mill is $1 of tax for every $1,000 of a property's assessed value. Property taxes, in the Commonwealth of Pennsylvania, apply only to real estate - land and buildings. The property tax is not levied on cars, business inventory, or other personal property. Certain types of property are exempt from property taxes, including: places of worship, places of burial, private social clubs, charitable and educational institutions and government property. Irregular property reassessments have become a serious issue in the commonwealth as it creates a significant disparity in taxation within a community and across a region. Additionally, service related, disabled US military veterans may seek an exemption from paying property taxes. Pennsylvania school district revenues are dominated by two main sources: 1) Property tax collections, which account for the vast majority (between 75-85%) of local revenues; and 2) Act 511 tax collections, which are around 15% of revenues for school districts.[212] Irregular property reassessments have become a serious issue in the Commonwealth as it creates a significant disparity in taxation within a community and across a region.
According to a report prepared by the Pennsylvania Department of Education, the total real estate taxes collected by all school districts in Pennsylvania rose from $6,474,133,936 in 1999-00 to $10,438,463,356 in 2008-09.[222] The average yearly property tax paid by Cumberland County residents amounts to about 2.8% of their yearly income. Cumberland County is ranked 724th of the 3143 United States counties for property taxes as a percentage of median income.[223] Property taxes in Pennsylvania are relatively high on a national scale. According to the Tax Foundation, Pennsylvania ranked 11th in the U.S.A., in 2008, in terms of property taxes paid as a percentage of home value (1.34%) and 12th in the country in terms of property taxes as a percentage of income (3.55%).[224]
Act 1 Adjusted index
The Act 1 of 2006 Index regulates the rates at which each school district can raise property taxes in Pennsylvania. School districts are not allowed to raise taxes above that index unless they allow voters to vote by referendum, or they seek an exception from the state Department of Education. The base index for the 2010-2011 school year is 2.9 percent, but the Act 1 Index can be adjusted higher, depending on a number of factors, such as property values and the personal income of district residents. Act 1 included 10 exceptions, including: increasing pension costs, increases in special education costs, a catastrophe like a fire or flood, increase in health insurance costs for contracts in effect in 2006 or dwindling tax bases. The base index is the average of the percentage increase in the statewide average weekly wage, as determined by the PA Department of Labor and Industry, for the preceding calendar year and the percentage increase in the Employment Cost Index for Elementary and Secondary Schools, as determined by the Bureau of Labor Statistics in the U.S. Department of Labor, for the previous 12-month period ending June 30. For a school district with a market value/personal income aid ratio (MV/PI AR) greater than 0.4000, its index equals the base index multiplied by the sum of .75 and its MV/PI AR for the current year.[225] In June 2011, the Pennsylvania General Assembly eliminated six of the ten exceptions to the Act 1 Index.[226] Several exceptions were maintained: 1) costs to pay interest and principal on indebtedness incurred prior to September 4, 2004 for Act 72 schools and prior to June 27, 2006 for non-Act 72 schools; 2) costs to pay interest and principal on electoral debt; 3) costs incurred in providing special education programs and services (beyond what is already paid by the State); and 4) costs due to increases of more than the Index in the school’s share of payments to PSERS (PA school employees pension fund) taking into account the state mandated PSERS contribution rate.[227][228]
The Act 1 School District Adjusted Index for the Cumberland Valley School District 2006-2007 through 2011-2012.[229]
|
|
For the 2013-14 budget year, Cumberland Valley School Board did not apply for exceptions to exceed the Act 1 Index. For 2013-2014, 311 Pennsylvania public school districts adopted a resolution certifying that tax rates would not be increased above their index; 171 school districts adopted a preliminary budget leaving open the option of exceeded the Index limit. For the exception for pension costs, 89 school districts received approval to exceed the Index in full while others received a partial approval of their request. For special education costs, 75 public school districts received approval to exceed the tax limit. For the exception for teacher pension costs, 169 school districts received approval to exceed the Index. Eleven public school districts received an approval for grandfathered construction debts.[231]
For the 2012-13 budget year, Cumberland Valley School Board did not apply for exceptions to exceed the Act 1 Index. For 2012-2013, 274 school districts adopted a resolution certifying that tax rates would not be increased above their index; 223 school districts adopted a preliminary budget leaving open the option of exceeded the Index limit. For the exception for pension costs, 194 school districts received approval to exceed the Index. For special education costs, 129 districts received approval to exceed the tax limit. For the exception for pension costs, 194 school districts received approval to exceed the Index. For special education costs, 129 districts received approval to exceed the tax limit.[232]
For the 2011-12 school year, the Cumberland Valley School Board applied for an exception to exceed the Act 1 Index due to escalating pension costs. Each year, the Cumberland Valley School Board has the option of adopting either 1) a resolution in January certifying they will not increase taxes above their index or 2) a preliminary budget in February. A school district adopting the resolution may not apply for referendum exceptions or ask voters for a tax increase above the inflation index. A specific timeline for these decisions is publisher each year by the Pennsylvania Department of Education.[233]
According to a state report, for the 2011-2012 school year budgets, 247 school districts adopted a resolution certifying that tax rates would not be increased above their index; 250 school districts adopted a preliminary budget. Of the 250 school districts that adopted a preliminary budget, 231 adopted real estate tax rates that exceeded their index. Tax rate increases in the other 19 school districts that adopted a preliminary budget did not exceed the school district’s index. Of the districts who sought exceptions 221 used the pension costs exemption and 171 sought a Special Education costs exemption. Only 1 school district sought an exemption for Nonacademic School Construction Project, while 1 sought an exception for Electoral debt for school construction.[234]
The Cumberland Valley School Board did not apply for any exceptions to exceed the Act 1 index for the budget in 2010-2011, nor for its 2009-10 school budget.[235][236] In the Spring of 2010, 135 Pennsylvania school boards asked to exceed their adjusted index. Approval was granted to 133 of them and 128 sought an exception for pension costs increases.[237]
Property Tax Relief
In 2009, the Homestead/Farmstead Property Tax Relief from gambling for the Cumberland Valley School District was $63 per approved permanent primary residence. In the district, 15,335 property owners applied for the tax relief. In Cumberland County, the highest amount of tax relief in 2009, went to Mechanicsburg Area School District at $140. The highest property tax relief, in Pennsylvania school districts, went to the residents of Chester Upland School District of Delaware County who received $632 per approved homestead.[238] The tax relief was subtracted from the total annual school property tax bill. Property owners apply for the relief through their county Treasurer's office. Farmers can qualify for a farmstead exemption on a building used for agricultural purposes. The farm must be at least 10 contiguous acres (40,000 m2) and must be the primary residence of the owner. Farmers can qualify for both the homestead exemption and the farmstead exemption. In Cumberland County, 75.93% of eligible property owners, applied for property tax relief in 2009.[239]
Wellness policy
Cumberland Valley School Board established a district wellness policy in 2006 - Policy 246.[240] The policy deals with nutritious meals served at school, the control of access to some foods and beverages during school hours, age appropriate nutrition education for all students, and physical education for students K-12. The policy is in response to state mandates and federal legislation (P.L. 108 - 265). The law dictates that each school district participating in a program authorized by the Richard B. Russell National School Lunch Act (42 U.S.C. 1751 et seq) or the Child Nutrition Act of 1966 (42 U.S.C. 1771 et seq) "shall establish a local school wellness policy by School Year 2006."
The legislation placed the responsibility of developing a wellness policy at the local level so the individual needs of each district can be addressed. According to the requirements for the Local Wellness Policy, school districts must set goals for nutrition education and physical education that are aligned with the Pennsylvania State Academic Standards for Health, Safety and Physical Education, campus food provision, and other school-based activities designed to promote student wellness. Additionally, districts were required to involve a broad group of individuals in policy development and to have a plan for measuring policy implementation. Districts were offered a choice of levels of implementation for limiting or prohibiting low nutrition foods on the school campus. In final implementation these regulations prohibit some foods and beverages on the school campus.[241] The Pennsylvania Department of Education required the district to submit a copy of the policy for approval.
Cumberland Valley School District offers both a free school breakfast and a free or reduced-price lunch to low-income children. The meals are partially funded with federal dollars through the United States Department of Agriculture.[242] Children from families with incomes between 130 and 185 percent of the federal poverty level can be charged no more than 30 cents per breakfast. A foster child whose care and placement is the responsibility of the State or who is placed by a court with a caretaker household is eligible for both a free breakfast and a free lunch. Runaway, homeless and Migrant Youth are also automatically eligible for free meals.[243] The meals are partially funded with federal dollars through the United States Department of Agriculture.[242]
In 2013, the USDA issued new restrictions to foods in public schools. The rules apply to foods and beverages sold on all public school district campuses during the day. They limit vending machine snacks to a maximum of 200 calories per item. Additionally, all snack foods sold at school must meet competitive nutrient standards, meaning they must have fruits, vegetables, dairy or protein in them or contain at least 10 percent of the daily value of fiber, calcium, potassium, and Vitamin D.[244] In order to comply with the Healthy, Hunger-Free Kids Act of 2010 all US public school districts are required to raise the price of their school lunches to $2.60 regardless of the actual cost of the lunch.[245]
Cumberland Valley School District provides health services as mandated by the Commonwealth and the federal government. Nurses are available in each building to conduct annual health screenings (data reported to the PDE and state Department of Health) and to dispense prescribed medications to students during the school day. Students can be excluded from school unless they comply with all the State Department of Health’s extensive immunization mandates. School nurses monitor each pupil for this compliance.[246] Nurses also monitor each child's weight.
Highmark Healthy High 5 grant
In 2011, Cumberland Valley School District received funding through a Highmark Healthy High 5 grant. Eagle View Middle School received $9,999 which was used to purchase Fitness Quest program purchasing equipment to enhance their circuit training program for 180 students in the 8th grade. Good Hope Middle School received $9,641 and Monroe Elementary School received $5,603 for a Life Fit program for intellectually and developmentally challenged students.[247] Beginning in 2006, Highmark Foundation engaged in a 5-year, $100 million program to promote lifelong healthy behaviors in children and adolescents through local nonprofits and schools.
Extracurriculars
Cumberland Valley School District also provides a wide variety of clubs, activities and an extensive and costly sports program. Eligibility is determined by school board policy.[248][249] Varsity and junior varsity athletic activities are under the Pennsylvania Interscholastic Athletic Association.
By Pennsylvania law, all K-12 students in the district, including those who attend a private nonpublic school, cyber charter school, charter school and those homeschooled, are eligible to participate in the extracurricular programs, including all athletics. They must meet the same eligibility rules as the students enrolled in the district's schools.[250]
Sports
The District funds: High School:
|
|
Middle School Sports:
|
|
According to PIAA directory July 2012 [251]
References
- ↑ Tricia Kiline (September 9, 2013). "Cumberland Valley appoints new superintendent". Pennlive.com.
- ↑ PA ED Names and Addresses, 2014
- ↑ Eric Veronikis (August 4, 2014). "CV adds two assistant superintendents". Pennlive.com.
- ↑ National Center for Education Statistics, Common Core of Data - Cumberland Valley School District 2012, 2014
- ↑ National Center for Education Statistics, Common Core of Data - Cumberland Valley School District 2010, 2012
- ↑ Pennsylvania Department of Education (October 4, 2013). "Cumberland Valley School District Fast Facts 2013".
- ↑ NCES, Common Core of Data Cumberland Valley School District 2011-12, 2012
- ↑ Pennsylvania Department of Education, Enrollment and Projections for Cumberland Valley School District, July 2010
- ↑ PDE, Enrollment by LEA 2012-13, 2012
- ↑ Tricia Kline (June 16, 2014). "Cumberland Valley budget increases taxes by 2.1 percent". Pennlive.com.
- ↑ Tricia Kline., Cumberland Valley School Board approves budget, bargaining agreement, Pennlive.com, June 03, 2013
- ↑ Paul Kiesow (May 20, 2011). "Cumberland Valley School Board OKs tentative budget with 2.9% tax increase".
- ↑ Pennlive.com, Cumberland Valley narrowly passes school district budget, June 17, 2010
- ↑ US Census Bureau, 2010 Census Poverty Data by Local Educational Agency, 2011
- ↑ US Census Bureau, American Fact Finder, 2009
- ↑ US Census Bureau (2010). "American Fact Finder, State and County quick facts".
- ↑ US Census Bureau (September 2011). "Income, Poverty, and Health Insurance Coverage in the United States: 2010" (PDF).
- ↑ Michael Sauter; Alexander E.M. Hess (August 31, 2013). "America's most popular six-figure jobs". USA Today.
- ↑ Pennsylvania Department of Education (September 21, 2011). "More Than 100 Entities Sign Up to Participate in Teacher and Principal Evaluation Pilot Program".
- 1 2 Augenblick, Palaich, and Associates, Inc. Costing Out the Resources Needed to Meet Pennsylvania’s Public Education Goals. November 2007
- ↑ Pennsylvania School Code 2009
- ↑ The Commonwealth Foundation for Public Policy Alternatives. "The Pennsylvania Project". Retrieved May 20, 2010.
- ↑ Pittsburgh Business Times (April 11, 2014). "Guide to Pennsylvania Schools Statewide School District Ranking 2014".
- ↑ Pittsburgh Business Times (April 11, 2014). "What makes up a district's School Performance Profile score?".
- ↑ Pittsburgh Business Times, 2013 Guide Pennsylvania School Ranking, April 4, 2013
- ↑ "Statewide Honor Roll Rankings 2011,". Pittsburgh Business Times. April 2011. Archived from the original on 2011-07-23.
- ↑ "Statewide Honor Roll Rankings 2010,". Pittsburgh Business Times. April 30, 2010.
- ↑ "Three of top school districts in state hail from Allegheny County". Pittsburgh Business Times. May 23, 2007.
- ↑ Pennsylvania Department of Education (September 21, 2012). "Cumberland Valley School District AYP Status 2012".
- ↑ Pennsylvania Department of Education, Pennsylvania Public School District AYP History, 2011
- ↑ Pennsylvania Department of Education, Pennsylvania District AYP History 2003-2010, 2011
- ↑ PDE (October 4, 2013). "Cumberland Valley High School Graduation rate".
- ↑ Pennsylvania Department of Education (2012). "CUMBERLAND VALLEY School District - AYP Data Table 2012".
- ↑ Pennsylvania Department of Education, CUMBERLAND VALLEY School District - District AYP Data Table, September 29, 2011
- ↑ Pennsylvania Department of Education (March 15, 2011). "New 4-year Cohort Graduation Rate Calculation Now Being Implemented". Archived from the original on 2010-09-14.
- ↑ Pennsylvania Department of Education (September 2010). "Cumberland Valley High School Academic Achievement Report Card 2010 data table". Pittsburgh Business Times.
- ↑ Pennsylvania Department of Education (2009). "Cumberland Valley School District Academic Achievement Report Card 2009".
- ↑ Pennsylvania Partnerships for Children (2007). "High School Graduation Rates".
- ↑ Pennsylvania Department of Education (2006). "Cumberland Valley High School Academic Achievement Report Card 2006".
- ↑ Pennsylvania Department of Education (2005). "Cumberland Valley School District Academic Achievement Report Card 2005".
- ↑ US News and World Report, Best High Schools, 2014
- ↑ National Center for Education Statistics, Common Care Data - Cumberland Valley High School, 2010
- ↑ Pennsylvania Department of Education, Professional Qualifications of Teachers High School, September 29, 2011
- ↑ Pennsylvania Department of Education (October 4, 2013). "Cumberland Valley High School Academic Performance Data 2013".
- ↑ Eleanor Chute; Mary Niederberger (December 11, 2013). "New assessment shows fuller picture of Pa. schools". Pittsburgh Post-Gazette.
- ↑ US News; World Report (April 22, 2014). "High School Overview 2014". Archived from the original on 2016-03-20.
- ↑ Pennsylvania Department of Education (September 21, 2012). "Cumberland Valley High School - School AYP Overview 2012".
- ↑ Pennsylvania Department of Education, Cumberland Valley High School AYP Overview 2011, September 29, 2011
- 1 2 Pennsylvania Department of Education (2014). "State Academic Standards".
- ↑ Pennsylvania Department of Education (2014). "State Assessment System".
- ↑ Pennsylvania Department of Education (September 29, 2012). "2011-2012 PSSA and AYP Results".
- ↑ Pennsylvania Department of Education (September 29, 2011). "2010-2011 PSSA and AYP Results".
- ↑ Pennsylvania Department of Education Report (September 14, 2010). "PSSAs: Reading, Math, Writing and Science Results".
- ↑ Pennsylvania Department of Education Report (August 15, 2009). "Cumberland Valley High School Academic Achievement Report Card 2009".
- ↑ Cumberland Valley School District Academic Achievement Report Card 2007, Pennsylvania Department of Education, 2007
- ↑ Pennsylvania Department of Education Report (2006). "Cumberland Valley School District Academic Achievement Report Card 2006".
- ↑ Cumberland Valley School District Academic Achievement Report Card 2005, Pennsylvania Department of Education, 2005
- 1 2 Pittsburgh Post Gazette (October 15, 2012). "How is your school doing?".
- ↑ Pennsylvania Department of Education Report (August 15, 2009). "2009 PSSAs: Reading, Math, Writing and Science Results".
- ↑ "Pennsylvania Math Highest Scoring High Schools". 2010.
- ↑ Pennsylvania Department of Education (September 21, 2012). "Cumberland Valley High School Academic Achievement Report Card 2012" (PDF).
- ↑ Pennsylvania Department of Education (August 2009). "Report on Science PSSA 2009 by Schools.".
- ↑ Pennsylvania Department of Education. "Science PSSA 2008 report by school and grade".
- ↑ The Pennsylvania Basic Education/Higher Education Science and Technology Partnership, Science in Motion annual report, 2012
- ↑ Pennsylvania Department of Education (January 2009). "Pennsylvania College Remediation Report,".
- ↑ National Center for Education Statistics
- ↑
- ↑ Cumberland Valley School Administration (2010). "Cumberland Valley Student Handbook".
- ↑ "Pennsylvania Code §4.24 (a) High school graduation requirements".
- ↑ Pennsylvania State Board of Education, Proposed changes to Chapter 4, May 10, 2012
- ↑ Pennsylvania Department of Education (2010). "Keystone Exam Overview" (PDF).
- ↑ Pennsylvania Department of Education (September 2011). "Pennsylvania Keystone Exams Overview". Archived from the original on 2012-03-17.
- ↑ Pennsylvania State Board of Education (2010). "Rules and Regulation Title 22 PA School Code CH. 4".
- ↑ Pennsylvania Department of Education, State Board of Education Finalizes Adoption of Pennsylvania Common Core State Academic Standards and High School Graduation Requirements, March 14, 2013
- ↑ Pennsylvania Department of Education (2011). "Keystone Exams".
- ↑ College Board (2013). "The 2013 SAT Report on College & Career Readiness".
- ↑ Pennsylvania Department of Education (2011). "Public School SAT Scores 2011". Archived from the original on 2011-10-15.
- ↑ College Board (September 2011). "SAT Scores State By State - Pennsylvania". Archived from the original on 2011-10-08.
- ↑ "While U.S. SAT scores dip across the board, N.J. test-takers hold steady". NJ.com. September 2011.
- ↑ PDE, School Performance Profile - Academic Performance Data - High School, December 2013
- ↑ Pennsylvania Department of Education (October 4, 2013). "Eagle View Middle School Fast Facts 2013".
- ↑ Pennsylvania Department of Education, Professional Qualifications of Teachers Eagle View Middle School, October 4, 2013
- ↑ National Center for Education Statistics, Common Care Data – Eagle View Middle School, 2010
- ↑ Pennsylvania Department of Education, Professional Qualifications of Teachers Eagle View Middle School AYP report card 2012, September 29, 2011
- ↑ Pennsylvania Department of Education (October 4, 2013). "Eagle View Middle School Academic Performance Data 2013,".
- ↑ Pennsylvania Department of Education (September 21, 2012). "Eagle View Middle School AYP Overview 2012".
- ↑ Pennsylvania Department of Education. "IU16-PSSA 95-96 Results by School". Retrieved May 11, 2014.
- ↑ Pennsylvania Department of Education (2014). "Standards Aligned Systems".
- ↑ Pennsylvania Department of Education (2014). "State Academic Standards Mathematics".
- ↑ Pennsylvania Department of Education (August 15, 2008). "Reading and Math PSSA 2008 by Schools".
- ↑ Pennsylvania Department of Education (September 21, 2012). "Eagle View School Academic Achievement Report Card 2012" (PDF).
- ↑ Pennsylvania Department of Education (September 14, 2009). "Eagle View Middle School Academic Report Card 2009".
- ↑ Pennsylvania Department of Education Report (August 2010). "Science PSSA 2010 by Schools".
- ↑ Pennsylvania Department of Education Report (August 2009). "Science PSSA 2009 by Schools".
- ↑ Pennsylvania Department of Education Report (August 15, 2008). "Science PSSA 2008 by Schools".
- ↑ Pennsylvania Department of Education (October 4, 2013). "Good Hope Middle School Fast Facts 2013".
- ↑ Pennsylvania Department of Education, Professional Qualifications of Teachers Good Hope Middle School, October 4, 2013
- ↑ National Center for Education Statistics, Common Core Data – Good View Middle School, 2011
- ↑ Pennsylvania Department of Education, Professional Qualifications of Teachers Good Hope Middle School, September 21, 2012
- ↑ Pennsylvania Department of Education (October 4, 2013). "Good Hope Middle School Academic Performance Data 2013".
- ↑ Pennsylvania Department of Education (September 21, 2012). "Good Hope Middle School AYP Overview 2012,".
- ↑ Pennsylvania Department of Education (October 4, 2013). "Green Ridge Elementary School Fast Facts 2013".
- ↑ Pennsylvania Department of Education, Green Ridge School Performance Profile, Elementary School Fast Facts 2013, 2013
- ↑ Pennsylvania Department of Education (October 4, 2013). "Green Ridge Elementary School Academic Performance Data 2013".
- ↑ Pennsylvania Department of Education (September 21, 2012). "Green Ridge Elementary School AYP Overview 2012".
- ↑ Pennsylvania Department of Education (October 4, 2013). "Hampden Elementary School Fast Facts 2013".
- ↑ Pennsylvania Department of Education, School Performance Profile, Hampden Elementary School Fast Facts 2013, 2013
- ↑ Pennsylvania Department of Education (October 4, 2013). "Hampden Elementary School Academic Performance Data 2013".
- ↑ Pennsylvania Department of Education, (September 21, 2012). "Hampden Elementary School AYP Overview 2012".
- ↑ Pennsylvania Department of Education (October 4, 2013). "Middlesex Elementary School Fast Facts 2013".
- ↑ Pennsylvania Department of Education, School Performance Profile, Middlesex Elementary School Fast Facts 2013, 2013
- ↑ Pennsylvania Department of Education (October 4, 2013). "Middlesex Elementary School Academic Performance Data 2013".
- ↑ Pennsylvania Department of Education (September 21, 2012). "Middlesex Elementary School AYP Overview 2012".
- ↑ Pennsylvania Department of Education (October 4, 2013). "Monroe Elementary School Fast Facts 2013".
- ↑ Pennsylvania Department of Education, School Performance Profile, Monroe Elementary School Fast Facts 2013, 2013
- ↑ National Center for Education Statistics, Common Core Data – Monroe Elementary School 2010-11, 2014
- ↑ Pennsylvania Department of Education, Professional Qualifications of Teachers Monroe Elementary School, September 21, 2012
- 1 2 3 4 Pennsylvania Partnership for Children, Full-Day Kindergarten Enrollment, 2010
- ↑ Pennsylvania Department of Education (October 4, 2013). "Monroe Elementary School Academic Performance Data 2013".
- ↑ Pennsylvania Department of Education, Elementary School AYP Overview, September 21, 2012
- ↑ Pennsylvania Department of Education (October 4, 2013). "Shaull Elementary School Fast Facts 2013".
- ↑ Pennsylvania Department of Education, School Performance Profile Shaull Elementary School Fast Facts 2013, October 4, 2013
- ↑ National Center for Education Statistics, Common Core Data – Shaull Elementary School, 2011
- ↑ Pennsylvania Department of Education, Professional Qualifications of Teachers Shaull Elementary School, September 21, 2012
- ↑ Pennsylvania Department of Education (October 4, 2013). "Shaull Elementary School Academic Performance Data 2013".
- ↑ Pennsylvania Department of Education, Shaull Elementary School AYP Overview 2012, September 21, 2012
- ↑ Pennsylvania Department of Education (October 4, 2013). "Silver Spring Elementary School Fast Facts 2013".
- ↑ Pennsylvania Department of Education, School Performance Profile, Silver Spring Elementary School Fast Facts 2013, October 4, 2013
- ↑ National Center for Education Statistics, Common Core Data – Silver Spring Elementary School, 2011
- ↑ Pennsylvania Department of Education, Professional Qualifications of Teachers Silver Spring Elementary School, September 21, 2012
- ↑ Pennsylvania Department of Education (October 4, 2013). "Silver Spring Elementary School Academic Performance Data 2013".
- ↑ Pennsylvania Department of Education (September 21, 2012). "Silver Spring Elementary School AYP Overview 2012".
- ↑ Pennsylvania Department of Education (October 4, 2013). "Sporting HIll Elementary School Fast Facts 2013".
- ↑ Pennsylvania Department of Education, School Performance Profile Sporting HIll Elementary School Fast Facts 2013, 2013
- ↑ National Center for Education Statistics, Common Core Data – Sporting Hill Elementary School 2010-2011, 2011
- ↑ Pennsylvania Department of Education, Professional Qualifications of Teachers Sporting HIll Elementary School, September 21, 2012
- ↑ Pennsylvania Department of Education (October 4, 2013). "Sporting Hill Elementary School Academic Performance Data 2013".
- ↑ Pennsylvania Department of Education (September 21, 2012). "Sporting Hill Elementary School AYP Overview 2013".
- ↑ "Cumberland Valley School District Special Education Data Report" (PDF). 2009.
- ↑ CSVD Special Education Services
- ↑ Pennsylvania Department of Education. "Pennsylvania Special Education Funding".
- ↑ Pennsylvania Department of Education (July 2010). "Special Education Funding from Pennsylvania State_2010-2011".
- ↑ Pennsylvania Department of Education (2011). "Special Education Funding 2011-2012 Fiscal Year".
- ↑ Pennsylvania Department of Education, (April 2012). "Investing in PA kids,". Archived from the original on 2013-10-01.
- ↑ Pennsylvania Department of Education (Revised December 1, 2009 Child Count (Collected July 2010)). "Gifted Students as Percentage of Total Enrollment by School District/Charter School" (PDF). Archived from the original (PDF) on 2016-03-04. Check date values in:
|date=(help) - ↑ Pennsylvania Department of Education and Pennsylvania School Board. "CHAPTER 16. Special Education For Gifted Students". Retrieved February 4, 2011.
- ↑ Pennsylvania General Assembly, Taxpayer Relief Act, Act 1 of the Special Session of 2006, June 27, 2006
- ↑ Pennsylvania Department of Education (2013). "Investing in Pennsylvania Students".
- ↑ "Cumberland Valley School District Payroll report 2011". OpenPA Gov.org. 2013. Archived from the original on 2010-11-19.
- ↑ Times Tribune (June 16, 2013). "PA Teacher Profile Database 2011-12".
- ↑ LIAM MIGDAIL-SMITH (February 27, 2011). "Cumberland Valley School District, teachers union reach tentative contract agreement".
- ↑ Pennsylvania Department of Education (2012). "Investing in Pennsylvania Students".
- ↑ Openpagov.org, Cumberland Valley School District payroll report 2011-12, 2012
- ↑ American Enterprise Institute, (2011). "Assessing the Compensation of Public School Teachers". Archived from the original on 2013-01-03.
- ↑ OpenPAgov.org (June 2011). "Cumberland Valley School District Payroll Report 2009". Archived from the original on 2010-11-19.
- ↑ Cumberland Valley School Board (July 1, 2007). "Cumberland Valley School District Teacher Employment Contract" (PDF).
- ↑ The Patriot News (February 21, 2010). "Legislature must act on educators' pension hole.".
- ↑ Fenton, Jacob, (April 2010). "Average classroom teacher salary in Cumberland County, 2006-07". The Morning Call. Archived from the original on 2011-07-23.
- ↑ Teachers need to know enough is enough, PaDelcoTimes, April 20, 2010.
- ↑ Fenton, Jacob. (Feb 2009). "Pennsylvania School District Data: Will School Consolidation Save Money?, The Morning Call,". Archived from the original on 2011-07-23.
- ↑ Pickel, Janet, (June 20, 2008). "CV schools chief to earn $150,000". The Patriot-News.
- ↑ Pennsylvania School Board Association (October 2009). "Public School Salaries 11th edition,".
- ↑ Openpagov.org, Cumberland Valley School District payroll report 2012, 2012
- ↑ Tricia Kline., Former Cumberland Valley superintendent receives $25,000 in bonus, severance pay, Pennlive.com, June 18, 2013
- ↑ John Luciew (August 26, 2013). "Acting Education Secretary William Harner loses two jobs in same year". PAtriot News.
- ↑ Tricia Kline (April 22, 2014). "Health department position elimination is a 'gamble CV nurses are not willing to take'". Pennlive.com.
- ↑ General Reserved Fund Balance by School District 1996-2008, Pennsylvania Department of Education Report 2008.
- ↑ Jan Murphy (August 18, 2014). "School district reserves rise despite $1 billion cut in state aid". Pennlive.com.
- ↑ PDE, Investing in Pennsylvania Students, July 2014
- ↑ Murphy, Jan., Pennsylvania's public schools boost reserves, CentreDaily Times, September 22, 2010
- ↑ Pennsylvania Auditor General (November 2009). "CUMBERLAND VALLEY SCHOOL DISTRICT CUMBERLAND COUNTY, PENNSYLVANIA PERFORMANCE AUDIT REPORT".
- ↑ Pennsylvania Auditor General (January 2013). "CUMBERLAND VALLEY SCHOOL DISTRICT CUMBERLAND COUNTY, PENNSYLVANIA PERFORMANCE AUDIT REPORT".
- ↑ "Per Pupil Spending in Pennsylvania Public Schools in 2008 Sort by Administrative Spending".
- ↑ Pennsylvania Department of Education (2010). "2009-10 Selected Data - 2009-10 Total Expenditures per ADM".
- ↑ United States Census Bureau (2009). "States Ranked According to Per Pupil Elementary-Secondary Public School System Finance Amounts: 2008-09" (PDF).
- ↑ US Census Bureau (2009). "Total and current expenditures per pupil in fall enrollment in public elementary and secondary education, by function and state or jurisdiction: 2006-07".
- ↑ US Census Bureau (March 2003). "Public Education Finances 2000-01 Annual Survey of Local Government Finances" (PDF).
- ↑ Pennsylvania Department of Education (May 2012). "Pennsylvania Public School District Tuition Rates".
- ↑ Penn State Cooperative Extension (2010). "What are the Local Taxes in Pennsylvania?, Local Tax Reform Education Project,". Archived from the original on 2010-10-27.
- ↑ Pennsylvania Department of Revenue (2010). "Income Tax Forgiveness information".
- ↑ Penn State Cooperative Extension (2010). "What are the Local Taxes in Pennsylvania?, Local Tax Reform Education Project,". Archived from the original on 2010-10-27.
- ↑ Pennsylvania Department of Revenue (April 2010). "Personal Income Taxation Guidelines". Archived from the original on 2009-12-13.
- ↑ Pennsylvania Representative Todd Stephens (January 23, 2014). "LEEF Funding Chart 2014".
- ↑ PDE (July 7, 2014). "Enacted Education Budget 2014-2015".
- ↑ Pennsylvania Department of Education, 2014-15 Enacted Education Budget Fast Facts, July 14, 2014
- ↑ Democrat Appropriations Committee, Report on Education funding by LEA, July 2, 2013
- ↑ Pennsylvania Office of the Budget, 2013-14 State Budget Highlights, 2013
- ↑ Senator Jake Corman (June 28, 2012). "Pennsylvania Education funding by Local School District" (PDF). Archived from the original (PDF) on 2012-07-30.
- ↑ Pennsylvania General Assembly Sen Jake Corman (June 29, 2012). "SB1466 of 2012 General Fund Appropriation".
- ↑ PA Senate Appropriations Committee (June 28, 2011). "School District 2011-12 funding Report".
- ↑ Pennsylvania Senate Appropriations Committee (June 2011). "Senate Budget Hearings 2011-2012 School District funding for 2011-2012".
- ↑ Pennsylvania Department of Education Report on Funding by School District, August 2010
- ↑ Governor's Budget Proposal 2010. Office of Budget, October 2009
- ↑ Pennsylvania Department of Education Report on Funding by school district October 2009
- ↑ U.S. Census Bureau., Annual Survey of Local Government Finances., 2000
- ↑ U.S. Census Bureau., 2008 Survey of Local Government Finances – School Systems, 2010
- ↑ Pennsylvania Department of Education District Basic Education Allocations Report 2009 & 2010
- ↑ Pennsylvania Department of Education (2010). "Accountability Block Grant report 2010, Grantee list 2010".
- ↑ Pennsylvania Department of Education (2009). "Accountability Block Grant 2008-2009 Mid Year Report".
- ↑ Pennsylvania Auditor General (December 22, 2008). "Classrooms For the Future grants audit" (PDF).
- ↑ DCED Press Office (July 8, 2010). "DCED: Pennsylvania Invests $18 Million to Support Alternative Energy Projects; Help Businesses, Schools Conserve Energy, Cut Costs".
- ↑ Pennsylvania Department of Education, Science: It’s Elementary Grantees Students in 143 Schools Benefit from Intensive Science Curriculum, July 22, 2008
- ↑ Pennsylvania Department of Education (May 23, 2012). "Pennsylvania Awards $36.1 Million to Strengthen Literacy Programs".
- ↑ Pennsylvania Department of Education Press Office (October 17, 2013). "Acting Secretary of Education Says Hybrid Learning Benefits Students; Highlights Success of First-Year Pilot Program".
- ↑ Cumberland County ARRA FUNDING Report website Accessed April 2010 Archived April 9, 2010, at the Wayback Machine.
- ↑ ProPublica (2009). "Recovery Tracker Eye on the stimulus".
- ↑ "School stimulus money". Pittsburgh Post-Gazette. March 12, 2009.
- ↑ Pennsylvania's 'Race to the Top' Fueled by Effective Reforms, Strong Local Support, Governor's Press release January 20, 2010
- ↑ Pennsylvania's 'Race to the Top' Fueled by Effective Reforms, Strong Local Support
- ↑ Race to the Top Fund, U.S. Department of Education, March 29, 2010.
- ↑ Lorenzo Falcone (June 30, 2014). "Most midstate school districts are raising taxes next year". Pennlive.com.
- ↑ Pennsylvania Department of Education (2004). "Act 511 Tax Report".
- ↑ Pennsylvania Department of Education, Finances_Real Estate Tax Rates 2013-14, 2013
- ↑ Pennsylvania Department of Education, Finances_Real Estate Tax Rates 2012-13, 2012
- ↑ Pennsylvania Department of Education (2011). "Real Estate Tax Millage by School District,".
- ↑ Pennsylvania Department of Education (2010). "Real Estate Tax Millage by School District".
- ↑ Pennsylvania Department of Education (2009). "Real Estate Tax Millage by School District".
- ↑ Pennsylvania Department of Education (2008). "Pennsylvania School District Real Estate Tax Rates 2008-09".
- ↑ Pennsylvania Department of Education (2008). "Real Estate Tax Millage by School District".
- ↑ Pennsylvania Department of Education, Real Estate Tax Millage by School District, 2006
- ↑ Pennsylvania Department of Education, Real Estate Tax Millage by School District, 2005
- ↑ Pennsylvania Department of Education (2009). "Pennsylvania School Finances - Summaries of Annual Financial Report Data 2008-09".
- ↑ Cumberland County Property Taxes 2012, Tax-rates.org, 2012
- ↑ Tax Foundation (September 28, 2010). "New Census Data on Property Taxes on Homeowners,". Archived from the original on 2011-09-06.
- ↑ Pennsylvania Department of Education 2010-11 Act 1 of 2006 Referendum Exception Guidelines.
- ↑ Kaitlynn Riely (August 4, 2011). "Law could restrict school construction projects". Pittsburgh Post-Gazette.
- ↑ Pennsylvania General Assembly (June 29, 2011). "SB330 of 2011".
- ↑ Eric Boehm (July 1, 2011). "Property tax reform final piece of state budget". PA Independent.
- ↑ Pennsylvania Department of Education (May 2010). "Special Session Act 1 of 2006 School District Adjusted Index for 2006-2007 through 2011-2012,".
- ↑ Pennsylvania Department of Education (2011). "The Index Special Session Act 1 of 2006".
- ↑ Pennsylvania Department of Education, Report on Referendum Exceptions For School Year 2013-2014, April 2013
- ↑ Pennsylvania Department of Education, Report on Referendum Exceptions For School Year 2012-2013, March 30, 2012
- ↑ Pennsylvania Department of Education (2011). "Special Session Act 1 of 2006 the Taxpayer Relief Act information".
- ↑ Pennsylvania Department of Education (April 2011). "Report on Exceptions".
- ↑ Pennsylvania Department of Education (April 2010). "Pennsylvania SSAct1_Act1 Exceptions Report 2010-2011".
- ↑ Pennsylvania Department of Education (April 2010). "Pennsylvania SSAct1_Act1 Exceptions Report 2009-2010".
- ↑ Scarcella, Frank; Pursell, Tricia, (May 25, 2010). "Local school tax assessments exceed state averages.". The Daily Item.
- ↑ Pennsylvania Department of Education (May 1, 2009). "Tax Relief per Homestead 2009,".
- ↑ Auditor General Office, (February 23, 2010). "Special Report Pennsylvania Property Tax Relief,".
- ↑ Cumberland Valley School Board Policy Manual
- ↑ Nutrition Standards for Competitive Foods in Pennsylvania Schools for the School Nutrition Incentive, Pennsylvania Department of Education — Division of Food and Nutrition. July 2008
- 1 2 Pennsylvania Hunger Action Center, The Pennsylvania School Breakfast Report Card, 2009
- ↑ USDA, Child Nutrition Programs - Eligibility Manual for School Meals, 2012
- ↑ USDA, Child Nutrition Programs, June 27, 2013
- ↑ United States Department of Agriculture (2011). "Food and Nutrition Service Equity in School Lunch Pricing Fact Sheet" (PDF). Archived from the original (PDF) on 2013-09-22.
- ↑ Pennsylvania State Department of Health (2010). "Pennsylvania Bulletin Doc. No. 10-984 School Immunizations; Communicable and Noncommunicable Diseases".
- ↑ Highmark Foundation, 2011 School Challenge Grants, 2011
- ↑ Cumberland Valley School Board (June 28, 2005). "Cumberland Valley School Board Policy Manual Extracurriculars and CoCurricular Activities Policy 122".
- ↑ Cumberland Valley School Board (2009). "Interscholastic Athletics Policy 123".
- ↑ Home-Schooled, Charter School Children Can Participate in School District Extracurricular Activities, Pennsylvania Office of the Governor Press Release, November 10, 2005
- ↑ Pennsylvania Interscholastic Athletics Association (2012). "PIAA School Directory".
External links
Cumberland County, Pennsylvania Schools | |||||||||||||||||||||||||||||||||
|---|---|---|---|---|---|---|---|---|---|---|---|---|---|---|---|---|---|---|---|---|---|---|---|---|---|---|---|---|---|---|---|---|---|
| |||||||||||||||||||||||||||||||||
| |||||||||||||||||||||||||||||||||
Coordinates: 40°14′18″N 77°03′38″W / 40.23839°N 77.06065°W