Croatian parliamentary election, 1995
| | |||||||||||||||||||||||||||||||||||||||||||||||||||||||||||||||||||||||||
| |||||||||||||||||||||||||||||||||||||||||||||||||||||||||||||||||||||||||
| |||||||||||||||||||||||||||||||||||||||||||||||||||||||||||||||||||||||||
| |||||||||||||||||||||||||||||||||||||||||||||||||||||||||||||||||||||||||


Parliamentary elections were held in Croatia on 29 October 1995 to elect the 127 members of the Chamber of Representatives.[1] The result was a victory for the Croatian Democratic Union, which won 75 seats, an absolute majority. Therefore, this was the last election to date in which a single party won enough seats to govern alone, without the need for a pre-election or post-election coalition. Voter turnout was 68.8%.[2]
Background
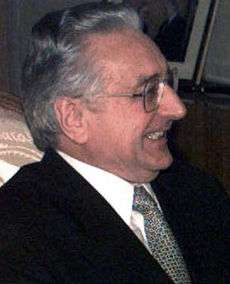
The term of the existing Chamber of Representatives was to expire one year later, in 1996. However, Croatian government of Franjo Tudjman and his Croatian Democratic Union party hoped to exploit national euphoria over the success of Operation Storm.[3] Chamber of Representatives was quickly dissolved, but not before passing yet another piece of electoral legislation, introducing new voting system which was to improve chances of ruling party.
According to the new electoral law, 32 seats were won in individual constituencies on First past the post basis, while 80 seats were to be distributed on the basis of proportional representation, with the threshold being raised from previous 2% to 5%.
Another addition was raised threshold for lists of party coalitions - 8% for coalition of two parties and 11% for coalition of three and more parties. It is more than obvious that the new rules were introduced to discourage coalitions of small opposition parties and subsequently have their votes dispersed and wasted below the threshold, allowing stronger party to get additional seats.
While 12 seats were kept for Croatian expatriates, number of seats reserved for ethnic minorities have changed. This was most evident in case of Serbs, who had only 3 seats compared with previous 11.
Under such conditions, Croatian opposition parties were more concerned about their own political survival than actually challenging ruling party. Learning from their mistakes during 1992 elections, they created ad hoc coalitions and circumvented electoral thresholds by fielding other parties' members as their own candidates on the lists.
In the end, HDZ won roughly the same percentage of votes and same number of seats as three years earlier. More significant changes were among the ranks of Croatian opposition. Social Democratic Party of Croatia re-emerged as significant political factor with 8.93% votes, at the expense of Croatian Social Liberal Party which had its share of votes nearly halved. Both parties, however, were not as successful as large opposition coalition which included Croatian Peasant Party, Croatian People's Party and Istrian Democratic Assembly.
The most tense moment of the campaign occurred during the vote count. It appeared that Croatian Party of Rights would fail to break 5% threshold, only for the vote to mysteriously increase afterwards.
The election was held in conjunction with special elections for Zagreb City Assembly, which resulted with Zagreb Crisis.
Results
| Party | PR | Constituency | Diaspora | Total seats |
+/– | ||||||
|---|---|---|---|---|---|---|---|---|---|---|---|
| Votes | % | Seats | Votes | % | Seats | Votes | % | Seats | |||
| Croatian Democratic Union | 1,093,403 | 45.23 | 42 | 21 | 12 | 75 | –10 | ||||
| HSS-IDS-HNS-HKDU-SBHS[a] | 441,390 | 18.26 | 16 | 2 | 0 | 18 | +5 | ||||
| Croatian Social Liberal Party | 279,245 | 11.55 | 10 | 2 | 0 | 12 | –2 | ||||
| Social Democratic Party | 215,839 | 8.93 | 8 | 2 | 0 | 10 | –1 | ||||
| Croatian Party of Rights | 121,095 | 5.01 | 4 | 0 | 0 | 4 | –1 | ||||
| Social Democratic Union | 78,282 | 3.24 | 0 | 0 | 0 | 0 | 0 | ||||
| Croatian Independent Democrats | 72,612 | 3.00 | 0 | 0 | 1 | +1 | |||||
| Social Democratic Action of Croatia | 40,348 | 1.57 | 0 | 0 | 1 | +1 | |||||
| Croatian Party of Rights 1861 | 31,530 | 1.30 | 0 | 0 | 0 | 0 | 0 | ||||
| Croatian Christian Democratic Party | 16,986 | 0.70 | 0 | 0 | 0 | 0 | 0 | ||||
| Alliance of Primorje-Gorski Kotar | 0 | 0 | 1 | 0 | |||||||
| Serb People's Party | 0 | 0 | 2 | –1 | |||||||
| Other parties | 26,644 | 1.10 | 0 | 0 | 0 | 0 | 0 | ||||
| Independents | – | – | 0 | 4 | 0 | 4 | –1 | ||||
| Invalid/blank votes | 82,666 | – | – | – | – | – | – | – | – | ||
| Total | 2,500,040 | 100 | 80 | 32 | 12 | 127 | –11 | ||||
Sources:
| |||||||||||
a Within the alliance, the Croatian Peasant Party won 10 seats (+7), the Istrian Democratic Assembly won 3 (no change), the Croatian People's Party won 2 (–4), the Croatian Christian Democratic Union won 1 (+1) and the Slavonia-Baranja Croatian Party won one (+1).
Subsequent changes
The following changes happened after elections:
- The Croatian Pure Party of Rights gained one member of parliament
- The Croatian Christian Democratic Union gained one more member of parliament
- The Serb People's Party lost one member of parliament
- The Independent Democratic Serb Party gained one member of parliament
- The Liberal Party gained four members of parliament
- The Istrian Democratic Forum gained one member of parliament
- The Croatian Independent Democrats lost one member of parliament
- Social Democratic Action of Croatia lost one member of parliament
References
- ↑ Nohlen, D & Stöver, P (2010) Elections in Europe: A data handbook, p410 ISBN 978-3-8329-5609-7
- ↑ Nohlen & Stöver, p415
- ↑ http://www.jutarnji.hr/davor-butkovic--prva-hrvatska-vlada-koja-bi-mogla-pasti/895339/
External links
| |||||||||||||||||||||||||||
| |||||||||||||||||||||||||||
| |||||||||||||||||||||||||||
(For the 1918–1989 period see Elections in Yugoslavia) | |||||||||||||||||||||||||||