Copperopolis, California
| Copperopolis | |
|---|---|
| census-designated place | |
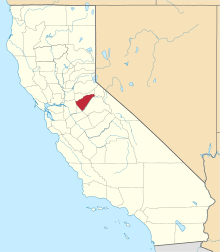
 Location in Calaveras County and the state of California | |
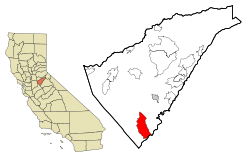
 Copperopolis Location in the United States | |
| Coordinates: 37°58′52″N 120°38′31″W / 37.98111°N 120.64194°WCoordinates: 37°58′52″N 120°38′31″W / 37.98111°N 120.64194°W | |
| Country |
|
| State |
|
| County | Calaveras |
| Area[1] | |
| • Total | 21.432 sq mi (55.510 km2) |
| • Land | 20.789 sq mi (53.844 km2) |
| • Water | 0.643 sq mi (1.666 km2) 3.09% |
| Elevation | 997 ft (304 m) |
| Population (2010) | |
| • Total | 3,671 |
| • Density | 170/sq mi (66/km2) |
| Time zone | Pacific (PST) (UTC-8) |
| • Summer (DST) | PDT (UTC-7) |
| ZIP code | 95228 |
| Area code(s) | 209 |
| FIPS code | 06-16210 |
| GNIS feature IDs | 1655921, 2407658 |
| Reference no. | 296 |
Copperopolis is a census-designated place (CDP) in Calaveras County, California, United States. The population was 3,671 at the 2010 census, up from 2,363 at the 2000 census. The town is located along State Route 4, (boundaries include Stallion Way and Gelding Road) and is registered as California Historical Landmark #296.[2]
History
Unlike most of the mining towns in the Calaveras County, Copperopolis' claim to fame is not gold, but copper. It was founded in 1860 by William K. Reed, Dr. Allen Blatchly, and Thomas McCarty, at the site of the second major discovery of copper ore in the region (the first was nearby Telegraph City).
William K. Reed and Thomas McCarty founded the Union Copper Mine (and later the Keystone & Empire mines). In 1862, Reed sold out his interest in the mines and built a toll road from Copperopolis through Telegraph City. It connected with a road running westerly into Stockton. This road was called "Reeds Turnpike" and remained a toll road until 1865. Copperopolis was on the main stage road from Sonora to Sacramento.
The town grew rapidly, as the need for copper during the Civil War to make bullets was great. The copper was sent to Stockton and then to San Francisco, where it was loaded onto ships and taken around Cape Horn before finally arriving in smelters on the East Coast.
After the war ended, mining and shipping copper proved to expensive and the population dwindled as the mines closed. However, a Boston company purchased the mines in the 1880s and mining operations resumed. The town went through boom periods during the two World Wars, when demand for copper went up again. By the time the mines closed in 1946, according to the U.S. Bureau of Mines, they had produced 72,598,883 pounds of copper worth over $12 million, which adjusted for inflation is worth approximately $160 million as of 2016.[3] No copper mining has been done since.
The first post office was established in 1861.[4]
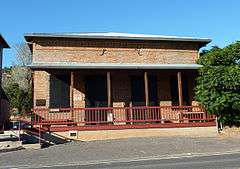
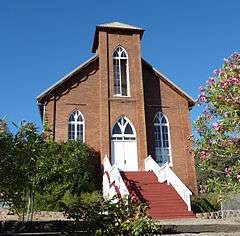
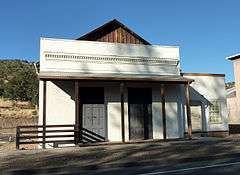
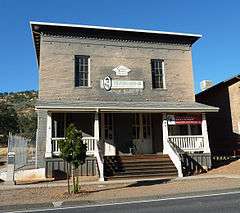
Copperopolis has four buildings listed on the National Register of Historic Places:
Geography
According to the United States Census Bureau, the CDP has a total area of 22.1 square miles (57 km2), of which, 21.5 square miles (56 km2) of it is land and 0.6 square miles (1.6 km2) of it (2.89%) is water.
Demographics
2010
The 2010 United States Census[5] reported that Copperopolis had a population of 3,671. The population density was 171.3 people per square mile (66.1/km²). The racial makeup of Copperopolis was 3,318 (90.4%) White, 31 (0.8%) African American, 43 (1.2%) Native American, 36 (1.0%) Asian, 12 (0.3%) Pacific Islander, 83 (2.3%) from other races, and 148 (4.0%) from two or more races. Hispanic or Latino of any race were 454 persons (12.4%).
The Census reported that 3,671 people (100% of the population) lived in households, 0 (0%) lived in non-institutionalized group quarters, and 0 (0%) were institutionalized.
There were 1,466 households, out of which 413 (28.2%) had children under the age of 18 living in them, 898 (61.3%) were opposite-sex married couples living together, 114 (7.8%) had a female householder with no husband present, 58 (4.0%) had a male householder with no wife present. There were 92 (6.3%) unmarried opposite-sex partnerships, and 12 (0.8%) same-sex married couples or partnerships. 291 households (19.8%) were made up of individuals and 115 (7.8%) had someone living alone who was 65 years of age or older. The average household size was 2.50. There were 1,070 families (73.0% of all households); the average family size was 2.86.
The population was spread out with 783 people (21.3%) under the age of 18, 253 people (6.9%) aged 18 to 24, 710 people (19.3%) aged 25 to 44, 1,270 people (34.6%) aged 45 to 64, and 655 people (17.8%) who were 65 years of age or older. The median age was 46.9 years. For every 100 females there were 102.4 males. For every 100 females age 18 and over, there were 103.0 males.
There were 2,336 housing units at an average density of 109.0 per square mile (42.1/km²), of which 1,089 (74.3%) were owner-occupied, and 377 (25.7%) were occupied by renters. The homeowner vacancy rate was 6.7%; the rental vacancy rate was 8.7%. 2,549 people (69.4% of the population) lived in owner-occupied housing units and 1,122 people (30.6%) lived in rental housing units.
2000
As of the census[6] of 2000, there were 2,363 people, 959 households, and 717 families residing in the CDP. The population density was 109.9 people per square mile (42.4/km²). There were 1,374 housing units at an average density of 63.9 per square mile (24.7/km²). The racial makeup of the CDP was 90.22% White, 0.68% Black or African American, 1.61% Native American, 1.90% Asian, 0.17% Pacific Islander, 1.65% from other races, and 3.77% from two or more races. 8.55% of the population were Hispanic or Latino of any race.
There were 959 households out of which 27.3% had children under the age of 18 living with them, 63.0% were married couples living together, 8.3% had a female householder with no husband present, and 25.2% were non-families. 19.7% of all households were made up of individuals and 8.3% had someone living alone who was 65 years of age or older. The average household size was 2.46 and the average family size was 2.81.
In the CDP the population was spread out with 23.0% under the age of 18, 5.1% from 18 to 24, 22.2% from 25 to 44, 31.3% from 45 to 64, and 18.4% who were 65 years of age or older. The median age was 45 years. For every 100 females there were 98.6 males. For every 100 females age 18 and over, there were 96.3 males.
The median income for a household in the CDP was $41,677, and the median income for a family was $46,339. Males had a median income of $42,125 versus $30,833 for females. The per capita income for the CDP was $23,530. About 8.6% of families and 12.4% of the population were below the poverty line, including 20.3% of those under age 18 and 9.4% of those age 65 or over.
Politics
In the state legislature, Copperopolis is in the 8th Senate District, represented by Republican Tom Berryhill,[7] and the 5th Assembly District, represented by Republican Frank Bigelow.[8] Federally, Copperopolis is in California's 4th congressional district, represented by Republican Tom McClintock.[9]
Literature
Copperopolis is famous for the shack on Jack Ass Hill, where Mark Twain is supposed to have written one of his most famous works, "The Celebrated Jumping Frog of Calaveras County". Author K. Martin Gardner expounds on this literary history, and Twain's friendship with renowned scientist of the time, Nikola Tesla, in his novel Copperopolis.
See also
| Wikimedia Commons has media related to Copperopolis, California. |
References
- ↑ "2010 Census U.S. Gazetteer Files – Places – California". United States Census Bureau.
- ↑ "Copperopolis". Office of Historic Preservation, California State Parks. Retrieved 2012-10-06.
- ↑ "Dollar Times Inflation Calculator". Dollar Times. HBrothers. Retrieved 30 March 2016.
- ↑ Durham, David L. (1998). California's Geographic Names: A Gazetteer of Historic and Modern Names of the State. Clovis, Calif.: Word Dancer Press. p. 761. ISBN 1-884995-14-4.
- ↑ "2010 Census Interactive Population Search: CA - Copperopolis CDP". U.S. Census Bureau. Retrieved July 12, 2014.
- ↑ "American FactFinder". United States Census Bureau. Archived from the original on 2013-09-11. Retrieved 2008-01-31.
- ↑ "Senators". State of California. Retrieved March 21, 2013.
- ↑ "Members Assembly". State of California. Retrieved March 21, 2013.
- ↑ "California's 4th Congressional District - Representatives & District Map". Civic Impulse, LLC. Retrieved March 2, 2013.