Connectome
A connectome (/kəˈnɛktoʊm/) is a comprehensive map of neural connections in the brain, and may be thought of as its "wiring diagram". More broadly, a connectome would include the mapping of all neural connections within an organism's nervous system.
The production and study of connectomes, known as connectomics, may range in scale from a detailed map of the full set of neurons and synapses within part or all of the nervous system of an organism to a macro scale description of the functional and structural connectivity between all cortical areas and subcortical structures. The term "connectome" is used primarily in scientific efforts to capture, map, and understand the organization of neural interactions within the brain.
Research has successfully constructed the full connectome of one animal: the roundworm C. elegans (White et al., 1986,[2] Varshney et al., 2011[3]). Partial connectomes of a mouse retina[4] and mouse primary visual cortex[5] have also been successfully constructed. Bock et al.'s complete 12 TB data set is publicly available at Open Connectome Project.
The ultimate goal of connectomics is to map the human brain. This effort is pursued by the Human Connectome Project, sponsored by the National Institutes of Health, whose focus is to build a network map of the human brain in healthy, living adults.
Origin and usage of the term "connectome"
In 2005, Dr. Olaf Sporns at Indiana University and Dr. Patric Hagmann at Lausanne University Hospital independently and simultaneously suggested the term "connectome" to refer to a map of the neural connections within the brain. This term was directly inspired by the ongoing effort to sequence the human genetic code—to build a genome.
"Connectomics" (Hagmann, 2005) has been defined as the science concerned with assembling and analyzing connectome data sets.[6]
In their 2005 paper, "The Human Connectome, a structural description of the human brain", Sporns et al. wrote:
- To understand the functioning of a network, one must know its elements and their interconnections. The purpose of this article is to discuss research strategies aimed at a comprehensive structural description of the network of elements and connections forming the human brain. We propose to call this dataset the human "connectome," and we argue that it is fundamentally important in cognitive neuroscience and neuropsychology. The connectome will significantly increase our understanding of how functional brain states emerge from their underlying structural substrate, and will provide new mechanistic insights into how brain function is affected if this structural substrate is disrupted.[7]
In his 2005 Ph.D. thesis, From diffusion MRI to brain connectomics, Hagmann wrote:
- It is clear that, like the genome, which is much more than just a juxtaposition of genes, the set of all neuronal connections in the brain is much more than the sum of their individual components. The genome is an entity it-self, as it is from the subtle gene interaction that [life] emerges. In a similar manner, one could consider the brain connectome, set of all neuronal connections, as one single entity, thus emphasizing the fact that the huge brain neuronal communication capacity and computational power critically relies on this subtle and incredibly complex connectivity architecture.[6]
Pathways through cerebral white matter can be charted by histological dissection and staining, by degeneration methods, and by axonal tracing. Axonal tracing methods form the primary basis for the systematic charting of long-distance pathways into extensive, species-specific anatomical connection matrices between gray matter regions. Landmark studies have included the areas and connections of the visual cortex of the macaque (Felleman and Van Essen, 1991)[8] and the thalamo-cortical system in the feline brain (Scannell et al., 1999).[9] The development of neuroinformatics databases for anatomical connectivity allow for continual updating and refinement of such anatomical connection maps. The online macaque cortex connectivity tool CoCoMac (Kötter, 2004)[10] is a prominent example of such a database.
In the human brain, the significance of the connectome stems from the realization that the structure and function of the human brain are intricately linked, through multiple levels and modes of brain connectivity. There are strong natural constraints on which neurons or neural populations can interact, or how strong or direct their interactions are. Indeed, the foundation of human cognition lies in the pattern of dynamic interactions shaped by the connectome.
However, structure-function relationships in the brain are unlikely to reduce to simple one-to-one mappings. In fact, the connectome can evidently support a great number of variable dynamic states, depending on current sensory inputs, global brain state, learning and development. Some changes in functional state may involve rapid changes of structural connectivity at the synaptic level, as has been elucidated by two-photon imaging experiments showing the rapid appearance and disappearance of dendritic spines (Bonhoeffer and Yuste, 2002).[11]
Despite such complex and variable structure-function mappings, the connectome is an indispensable basis for the mechanistic interpretation of dynamic brain data, from single-cell recordings to functional neuroimaging.
The term "connectome" was more recently popularized by Sebastian Seung's "I am my Connectome" speech given at the 2010 TED conference, which discusses the high-level goals of mapping the human connectome, as well as ongoing efforts to build a three-dimensional neural map of brain tissue at the microscale.[12] In 2012, Seung published the book Connectome: How the Brain's Wiring Makes Us Who We Are.
The connectome at multiple scales
Brain networks can be defined at different levels of scale, corresponding to levels of spatial resolution in brain imaging (Kötter, 2007, Sporns, 2010).[13][14] These scales can be roughly categorized as microscale, mesoscale and macroscale. Ultimately, it may be possible to join connectomic maps obtained at different scales into a single hierarchical map of the neural organization of a given species that ranges from single neurons to populations of neurons to larger systems like cortical areas. Given the methodological uncertainties involved in inferring connectivity from the primary experimental data, and given that there are likely to be large differences in the connectomes of different individuals, any unified map will likely rely on probabilistic representations of connectivity data (Sporns et al., 2005).[7]
Mapping the connectome at the "microscale" (micrometer resolution) means building a complete map of the neural systems, neuron-by-neuron. The challenge of doing this becomes obvious: the number of neurons comprising the brain easily ranges into the billions in more highly evolved organisms. The human cerebral cortex alone contains on the order of 1010 neurons linked by 1014 synaptic connections.[15] By comparison, the number of base-pairs in a human genome is 3×10⁹. A few of the main challenges of building a human connectome at the microscale today include: (1) data collection would take years given current technology; (2) machine vision tools to annotate the data remain in their infancy, and are inadequate; and (3) neither theory nor algorithms are readily available for the analysis of the resulting brain-graphs. To address the data collection issues, several groups are building high-throughput serial electron microscopes (Kasthuri et al., 2009; Bock et al. 2011). To address the machine-vision and image-processing issues, the Open Connectome Project is alg-sourcing (algorithm outsourcing) this hurdle. Finally, statistical graph theory is an emerging discipline which is developing sophisticated pattern recognition and inference tools to parse these brain-graphs (Goldenberg et al., 2009).
A "mesoscale" connectome corresponds to a spatial resolution of hundreds of micrometers. Rather than attempt to map each individual neuron, a connectome at the mesoscale would attempt to capture anatomically and/or functionally distinct neuronal populations, formed by local circuits (e.g. cortical columns) that link hundreds or thousands of individual neurons. This scale still presents a very ambitious technical challenge at this time and can only be probed on a small scale with invasive techniques or very high field MRI on a local scale.
A connectome at the macroscale (millimeter resolution) attempts to capture large brain systems that can be parcellated into anatomically distinct modules (areas, parcels or nodes), each having a distinct pattern of connectivity. Connectomic databases at the mesoscale and macroscale may be significantly more compact than those at cellular resolution, but they require effective strategies for accurate anatomical or functional parcellation of the neural volume into network nodes (for complexities see, e.g., Wallace et al., 2004).[16]
Mapping the connectome at the cellular level
Current non-invasive imaging techniques cannot capture the brain's activity on a neuron-by-neuron level. Mapping the connectome at the cellular level in vertebrates currently requires post-mortem microscopic analysis of limited portions of brain tissue. Non-optical techniques that rely on high-throughput DNA sequencing have been proposed recently by Tony Zador (CSHL).[17]
Traditional histological circuit-mapping approaches rely on imaging and include light-microscopic techniques for cell staining, injection of labeling agents for tract tracing, or chemical brain preservation , staining and reconstruction of serially sectioned tissue blocks via electron microscopy (EM). Each of these classical approaches has specific drawbacks when it comes to deployment for connectomics. The staining of single cells, e.g. with the Golgi stain, to trace cellular processes and connectivity suffers from the limited resolution of light-microscopy as well as difficulties in capturing long-range projections. Tract tracing, often described as the "gold standard" of neuroanatomy for detecting long-range pathways across the brain, generally only allows the tracing of fairly large cell populations and single axonal pathways. EM reconstruction was successfully used for the compilation of the C. elegans connectome (White et al., 1986).[2] However, applications to larger tissue blocks of entire nervous systems have traditionally had difficulty with projections that span longer distances.
Recent advances in mapping neural connectivity at the cellular level offer significant new hope for overcoming the limitations of classical techniques and for compiling cellular connectome data sets (Livet et al., 2007; Lichtman et al., 2008).[18][19][20] Using Brainbow, a combinatorial color labeling method based on the stochastic expression of several fluorescent proteins, Lichtman and colleagues were able to mark individual neurons with one of over 100 distinct colors. The labeling of individual neurons with a distinguishable hue then allows the tracing and reconstruction of their cellular structure including long processes within a block of tissue.
In March 2011, the journal Nature published a pair of articles on micro-connectomes: Bock et al.[5] and Briggman et al.[4] In both articles, the authors first characterized the functional properties of a small subset of cells, and then manually traced a subset of the processes emanating from those cells to obtain a partial subgraph. In alignment with the principles of open-science, the authors of Bock et al. (2011) have released their data for public access. The full resolution 12TB dataset from Bock et al. is available at the Open Connectome Project. In 2012, a Citizen science project called EyeWire began attempting to crowdsource the mapping of the connectome through an interactive game.[21] Independently, important topologies of functional interactions among several hundred cells are also gradually going to be declared (Shimono and Beggs, 2014).[22] Scaling up ultrastructural circuit mapping to the whole mouse brain is currently underway (Mikula, 2012).[23] An alternative approach to mapping connectivity was recently proposed by Zador and colleagues (Zador et al., 2012).[17] Zador's technique, called BOINC (barcoding of individual neuronal connections) uses high-throughput sequencing to map neural circuits. Briefly, the approach consists of (1) labelling each neuron with a unique DNA barcode; (2) transferring barcodes between synaptically coupled neurons (for example using PRV); and (3) fusion of barcodes to represent a synaptic pair. This approach has the potential to be cheap, fast, and extremely high-throughput.
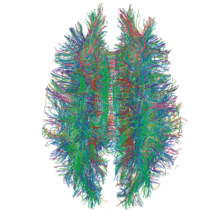
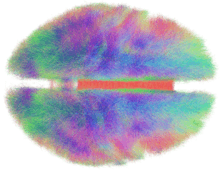
Mapping the connectome at the macro scale
Established methods of brain research, such as axonal tracing, provided early avenues for building connectome data sets. However, more recent advances in living subjects has been made by the use of non-invasive imaging technologies such as diffusion magnetic resonance imaging and functional magnetic resonance imaging (fMRI). The first, when combined with tractography allows reconstruction of the major fiber bundles in the brain. The second allows the researcher to capture the brain's network activity (either at rest or while performing directed tasks), enabling the identification of structurally and anatomically distinct areas of the brain that are functionally connected.
Notably, the goal of the Human Connectome Project, led by the WU-Minn consortium, is to build a structural and functional map of the healthy human brain at the macro scale, using a combination of multiple imaging technologies and resolutions.
Recent advances in connectivity mapping

Over the past few years, several investigators have attempted to map the large-scale structural architecture of the human cerebral cortex. One attempt exploited cross-correlations in cortical thickness or volume across individuals (He et al., 2007).[24] Such gray-matter thickness correlations have been postulated as indicators for the presence of structural connections. A drawback of the approach is that it provides highly indirect information about cortical connection patterns and requires data from large numbers of individuals to derive a single connection data set across a subject group. Other investigators have attempted to build whole-brain connection matrices from diffusion imaging data.
Primary challenge for macroscale connectomics: determining parcellations of the brain
The initial explorations in macroscale human connectomics were done using either equally sized regions or anatomical regions with unclear relationship to the underlying functional organization of the brain (e.g. gyral and sulcal-based regions). While much can be learned from these approaches, it is highly desirable to parcellate the brain into functionally distinct parcels: brain regions with distinct architectonics, connectivity, function, and/or topography (Felleman and Van Essen, 1991).[25] Accurate parcellation allows each node in the macroscale connectome to be more informative by associating it with a distinct connectivity pattern and functional profile. Parcellation of localized areas of cortex have been accomplished using diffusion tractography (Beckmann et al. 2009)[26] and functional connectivity (Nelson et al. 2010)[27] to non-invasively measure connectivity patterns and define cortical areas based on distinct connectivity patterns. Such analyses may best be done on a whole brain scale and by integrating non-invasive modalities. Accurate whole brain parcellation may lead to more accurate macroscale connectomes for the normal brain, which can then be compared to disease states.
Mapping functional connectivity to complement anatomical connectivity
Using functional MRI (fMRI) in the resting state and during tasks, functions of the connectome circuits are being studied.[28] Just as detailed road maps of the earth's surface do not tell us much about the kind of vehicles that travel those roads or what cargo they are hauling, to understand how neural structures result in specific functional behavior such as consciousness, it is necessary to build theories that relate functions to anatomical connectivity.[29] However, the bond between structural and functional connectivity is not straightforward. Computational models of whole-brain network dynamics are valuable tools to investigate the role of the anatomical network in shaping functional connectivity.[30][31] In particular, computational models can be used to predict the dynamic effect of lesions in the connectome.[32][33]
The connectome as a network or graph
The connectome can be studied as a network by means of network science and graph theory. In case of a micro-scale connectome, the nodes of this network (or graph) are the neurons, and the edges correspond to the synapses between those neurons. For the macro-scale connectome, the nodes correspond to the ROIs (regions of interest), while the edges of the graph are derived from the axons interconnecting those areas. Thus connectomes are sometimes referred to as brain graphs, as they are indeed graphs in a mathematical sense which describe the connections in the brain (or, in a broader sense, the whole nervous system).
One group of researchers (Iturria-Medina et al., 2008)[34] has constructed connectome data sets using diffusion tensor imaging (DTI)[35][36] followed by the derivation of average connection probabilities between 70-90 cortical and basal brain gray matter areas. All networks were found to have small-world attributes and "broad-scale" degree distributions. An analysis of betweenness centrality in these networks demonstrated high centrality for the precuneus, the insula, the superior parietal and the superior frontal cortex. Another group (Gong et al. 2008)[37] has applied DTI to map a network of anatomical connections between 78 cortical regions. This study also identified several hub regions in the human brain, including the precuneus and the superior frontal gyrus.
Hagmann et al. (2007)[38] constructed a connection matrix from fiber densities measured between homogeneously distributed and equal-sized regions of interest (ROIs) numbering between 500 and 4000. A quantitative analysis of connection matrices obtained for approximately 1000 ROIs and approximately 50,000 fiber pathways from two subjects demonstrated an exponential (one-scale) degree distribution as well as robust small-world attributes for the network. The data sets were derived from diffusion spectrum imaging (DSI) (Wedeen, 2005),[39] a variant of diffusion-weighted imaging[40][41] that is sensitive to intra-voxel heterogeneities in diffusion directions caused by crossing fiber tracts and thus allows more accurate mapping of axonal trajectories than other diffusion imaging approaches (Wedeen, 2008).[42] The combination of whole-head DSI datasets acquired and processed according to the approach developed by Hagmann et al. (2007)[38] with the graph analysis tools conceived initially for animal tracing studies (Sporns, 2006; Sporns, 2007)[43][44] allow a detailed study of the network structure of human cortical connectivity (Hagmann et al., 2008).[45] The human brain network was characterized using a broad array of network analysis methods including core decomposition, modularity analysis, hub classification and centrality. Hagmann et al. presented evidence for the existence of a structural core of highly and mutually interconnected brain regions, located primarily in posterior medial and parietal cortex. The core comprises portions of the posterior cingulate cortex, the precuneus, the cuneus, the paracentral lobule, the isthmus of the cingulate, the banks of the superior temporal sulcus, and the inferior and superior parietal cortex, all located in both cerebral hemispheres.
A subfield of connectomics deals with the comparison of the brain graphs of multiple subjects. It is possible to build a consensus graph such the Budapest Reference Connectome by allowing only edges that are present in at least k connectomes, for a selectable k parameter. The Budapest Reference Connectome has led the researchers to the discovery of the Consensus Connectome Dynamics of the human brain graphs. The edges appeared in all of the brain graphs form a connected subgraph around the brainstem. By allowing gradually less frequent edges, this core subgraph grows continuously, as a shrub. The growth dynamics may reflect the individual brain development and provide an opportunity to direct some edges of the human consensus brain graph.[46]
The possible causes of the difference between individual connectomes were also investigated. It has been found that the macro-scale connectomes of women contain significantly more edges than those of men, and a larger portion of the edges in the connectomes of women run between the two hemispheres.[47][48] In addition, connectomes generally exhibit a small-world character, with overall cortical connectivity decreasing with age.[49] The aim of the as of 2015 ongoing HCP Lifespan Pilot Project is to identify connectome differences between 6 age groups (4–6, 8–9, 14–15, 25–35, 45–55, 65–75).
More recently, connectograms have been used to visualize full-brain data by placing cortical areas around a circle, organized by lobe.[50][51] Inner circles then depict cortical metrics on a color scale. White matter fiber connections in DTI data are then drawn between these cortical regions and weighted by fractional anisotropy and strength of the connection. Such graphs have even been used to analyze the damage done to the famous traumatic brain injury patient Phineas Gage.[52]
Statistical graph theory is an emerging discipline which is developing sophisticated pattern recognition and inference tools to parse these brain graphs (Goldenberg et al., 2009).
See also
- Outline of brain mapping
- Outline of the human brain
- Human Connectome Project
- Drosophila connectome
- List of animals by number of neurons
- Interactome
References
- ↑ Horn, Andreas; Ostwald, Dirk; Reisert, Marco; Blankenburg, Felix (2013). "The structural-functional connectome and the default mode network of the human brain". NeuroImage. 102: 142–151. doi:10.1016/j.neuroimage.2013.09.069. PMID 24099851.
- 1 2 White, J. G.; Southgate, E.; Thomson, J. N.; Brenner, S. (1986). "The Structure of the Nervous System of the Nematode Caenorhabditis elegans". Philosophical Transactions of the Royal Society B: Biological Sciences. 314 (1165): 1–340. Bibcode:1986RSPTB.314....1W. doi:10.1098/rstb.1986.0056. PMID 22462104.
- ↑ Varshney, L. R.; Chen, B. L.; Paniagua, E.; Hall, D. H.; Chklovskii, D. B. (2011). Sporns, Olaf, ed. "Structural Properties of the Caenorhabditis elegans Neuronal Network". PLoS Computational Biology. 7 (2): e1001066. Bibcode:2011PLSCB...7E0010V. doi:10.1371/journal.pcbi.1001066. PMC 3033362
 . PMID 21304930.
- 1 2 Briggman, K. L.; Helmstaedter, M.; Denk, W. (Mar 10, 2011). "Wiring specificity in the direction-selectivity circuit of the retina". Nature. 471 (7337): 183–8. Bibcode:2011Natur.471..183B. doi:10.1038/nature09818. PMID 21390125.
- 1 2 Bock, Davi D.; Lee, Wei-Chung Allen; Kerlin, Aaron M.; Andermann, Mark L.; Hood, Greg; Wetzel, Arthur W.; Yurgenson, Sergey; Soucy, Edward R.; Kim, Hyon Suk; Reid, R. Clay (2011). "Network anatomy and in vivo physiology of visual cortical neurons". Nature. 471 (7337): 177–182. Bibcode:2011Natur.471..177B. doi:10.1038/nature09802. PMC 3095821. PMID 21390124.
- 1 2 Hagmann, Patric (2005). From diffusion MRI to brain connectomics (Thesis). Lausanne: EPFL. doi:10.5075/epfl-thesis-3230. Retrieved 2014-01-16.
- 1 2 Sporns, Olaf; Tononi, Giulio; Kötter, Rolf (2005). "The Human Connectome: A Structural Description of the Human Brain". PLoS Computational Biology. 1 (4): e42. Bibcode:2005PLSCB...1...42S. doi:10.1371/journal.pcbi.0010042. PMC 1239902. PMID 16201007.
- ↑ Felleman, Daniel J.; Rakic, David C. (1991). "Distributed Hierarchical Processing in the Primate Cerebral Cortex". Cerebral Cortex. 1 (1): 1–47. doi:10.1093/cercor/1.1.1-a. PMID 1822724.
- ↑ Scannell, J.W.; Burns, GA; Hilgetag, CC; O'Neil, MA; Young, MP (1999). "The Connectional Organization of the Cortico-thalamic System of the Cat". Cerebral Cortex. 9 (3): 277–99. doi:10.1093/cercor/9.3.277. PMID 10355908.
- ↑ Kötter, Rolf (2004). "Online Retrieval, Processing, and Visualization of Primate Connectivity Data From the CoCoMac Database". Neuroinformatics. 2 (2): 127–44. doi:10.1385/NI:2:2:127. PMID 15319511.
- ↑ Bonhoeffer, Tobias; Yuste, Rafael (2002). "Spine MotilityPhenomenology, Mechanisms, and Function". Neuron. 35 (6): 1019–27. doi:10.1016/S0896-6273(02)00906-6. PMID 12354393.
- ↑ Seung, Sebastian (September 2010) [recorded July 2010]. "Sebastian Seung: I am my connectome". TEDTalks. Retrieved 2011-08-07.
- ↑ Kötter, Rolf (2007). "Anatomical Concepts of Brain Connectivity". Handbook of Brain Connectivity. Understanding Complex Systems. pp. 149–67. doi:10.1007/978-3-540-71512-2_5. ISBN 978-3-540-71462-0.
- ↑ "Networks of the Brain". The MIT Press. 2010-11-30. Retrieved 2011-08-07.
- ↑ Azevedo, Frederico A C; Carvalho, Ludmila R. B.; Grinberg, Lea T.; Farfel, José Marcelo; Ferretti, Renata E. L.; Leite, Renata E. P.; Filho, Wilson Jacob; Lent, Roberto; Herculano-Houzel, Suzana (2009). "Equal numbers of neuronal and nonneuronal cells make the human brain an isometrically scaled-up primate brain". The Journal of Comparative Neurology. 513 (5): 532–541. doi:10.1002/cne.21974. PMID 19226510.
- ↑ Wallace, M. T.; Ramachandran, R.; Stein, B. E. (2004). "A revised view of sensory cortical parcellation". Proceedings of the National Academy of Sciences. 101 (7): 2167–72. Bibcode:2004PNAS..101.2167W. doi:10.1073/pnas.0305697101. PMC 357070. PMID 14766982.
- 1 2 Zador, Anthony M.; Dubnau, Joshua; Oyibo, Hassana K.; Zhan, Huiqing; Cao, Gang; Peikon, Ian D. (2012). "Sequencing the Connectome". PLoS Biology. 10 (10): e1001411. doi:10.1371/journal.pbio.1001411. PMC 3479097. PMID 23109909.
- ↑ Livet, Jean; Weissman, Tamily A.; Kang, Hyuno; Draft, Ryan W.; Lu, Ju; Bennis, Robyn A.; Sanes, Joshua R.; Lichtman, Jeff W. (2007). "Transgenic strategies for combinatorial expression of fluorescent proteins in the nervous system". Nature. 450 (7166): 56–62. Bibcode:2007Natur.450...56L. doi:10.1038/nature06293. PMID 17972876.
- ↑ Lichtman, J; Sanes, J (2008). "Ome sweet ome: what can the genome tell us about the connectome?". Current Opinion in Neurobiology. 18 (3): 346–53. doi:10.1016/j.conb.2008.08.010. PMC 2735215. PMID 18801435.
- ↑ Lichtman, Jeff W.; Livet, Jean; Sanes, Joshua R. (2008). "A technicolour approach to the connectome". Nature Reviews Neuroscience. 9 (6): 417–22. doi:10.1038/nrn2391. PMC 2577038. PMID 18446160.
- ↑ "About << EyeWire". Retrieved 26 March 2012.
- ↑ Shimono, Masanori; Beggs, John (2015). "Functional clusters, hubs, and communities in the cortical microconnectome". Cerebral Cortex. 25 (10): 3743–57. doi:10.1093/cercor/bhu252. PMC 4585513. PMID 25336598.
- ↑ Mikula, Shawn; Binding, Jonas; Denk, Winfried (2012). "Staining and Embedding the Whole Mouse Brain for Electron Microscopy". Nature Methods. 9 (12): 1198–1201. doi:10.1038/nmeth.2213. PMID 23085613.
- ↑ He, Y.; Chen, Z. J.; Evans, A. C. (2006). "Small-World Anatomical Networks in the Human Brain Revealed by Cortical Thickness from MRI". Cerebral Cortex. 17 (10): 2407–19. doi:10.1093/cercor/bhl149. PMID 17204824.
- ↑ Felleman, Daniel J.; Van Essen, David C. (1991). "Distributed Hierarchical Processing in the Primate Cerebral Cortex". Cerebral Cortex. 1 (1): 1–47. doi:10.1093/cercor/1.1.1-a. PMID 1822724.
- ↑ Beckmann, M.; Johansen-Berg, H.; Rushworth, M. F. S. (2009). "Connectivity-Based Parcellation of Human Cingulate Cortex and Its Relation to Functional Specialization". Journal of Neuroscience. 29 (4): 1175–90. doi:10.1523/JNEUROSCI.3328-08.2009. PMID 19176826.
- ↑ Nelson, Steven M.; Cohen, Alexander L.; Power, Jonathan D.; Wig, Gagan S.; Miezin, Francis M.; Wheeler, Mark E.; Velanova, Katerina; Donaldson, David I.; Phillips, Jeffrey S.; Schlaggar, Bradley L.; Petersen, SE (2010). "A Parcellation Scheme for Human Left Lateral Parietal Cortex". Neuron. 67 (1): 156–70. doi:10.1016/j.neuron.2010.05.025. PMC 2913443. PMID 20624599.
- ↑ Van Dijk KR, Hedden T, Venkataraman A, Evans KC, Lazar SW, Buckner RL (January 2010). "Intrinsic functional connectivity as a tool for human connectomics: theory, properties, and optimization". Journal of Neurophysiology. 103 (1): 297–321. doi:10.1152/jn.00783.2009. PMC 2807224. PMID 19889849.
- ↑ Allen M, Williams G (2011). "Consciousness, plasticity, and connectomics: the role of intersubjectivity in human cognition". Frontiers in Psychology. 2: 20. doi:10.3389/fpsyg.2011.00020. PMC 3110420. PMID 21687435.
- ↑ Cabral; et al. (2014). "Exploring the network dynamics underlying brain activity during rest". Progress in Neurobiology. 114: 102–131. doi:10.1016/j.pneurobio.2013.12.005.
- ↑ Honey; et al. (2007). "Network structure of cerebral cortex shapes functional connectivity on multiple time scales". PNAS. 104: 10240–10245. doi:10.1073/pnas.0701519104.
- ↑ Cabral; et al. (2012). "Modeling the outcome of structural disconnection on resting-state functional connectivity". NeuroImage. 62: 1342–1353. doi:10.1016/j.neuroimage.2012.06.007.
- ↑ Honey and Sporns (2008). "Dynamical consequences of lesions in cortical networks". Human Brain Mapping. 29: 802–809. doi:10.1002/hbm.20579.
- ↑ Iturria-Medina, Yasser; Sotero, Roberto C.; Canales-Rodríguez, Erick J.; Alemán-Gómez, Yasser; Melie-García, Lester (2008). "Studying the human brain anatomical network via diffusion-weighted MRI and Graph Theory". NeuroImage. 40 (3): 1064–76. doi:10.1016/j.neuroimage.2007.10.060. PMID 18272400.
- ↑ Basser, P. J.; Mattiello, J.; Le Bihan, D. (1994). "MR Diffusion Tensor Spectroscopy and Imaging". Biophysical Journal. 66 (1): 259–267. Bibcode:1994BpJ....66..259B. doi:10.1016/S0006-3495(94)80775-1. PMC 1275686. PMID 8130344.
- ↑ Basser, P. J.; Mattiello, J.; Le Bihan, D. (March 1994). "Estimation of the effective self-diffusion tensor from the NMR spin echo". Journal of Magnetic Resonance, Series B. 103 (3): 247–254. Bibcode:1994JMRB..103..247B. doi:10.1006/jmrb.1994.1037. PMID 8019776.
- ↑ Gong, G.; He, Y.; Concha, L.; Lebel, C.; Gross, D. W.; Evans, A. C.; Beaulieu, C. (2008). "Mapping Anatomical Connectivity Patterns of Human Cerebral Cortex Using In Vivo Diffusion Tensor Imaging Tractography". Cerebral Cortex. 19 (3): 524–36. doi:10.1093/cercor/bhn102. PMC 2722790. PMID 18567609.
- 1 2 Hagmann, Patric; Kurant, Jean-Philippe; Gigandet, Reto; Thiran, P; Wedeen, Maciej; Meuli, Xavier; Thiran, Patrick; Wedeen, Van J.; Sporns, Olaf (2007). Sporns, Olaf, ed. "Mapping Human Whole-Brain Structural Networks with Diffusion MRI". PLoS ONE. 2 (7): e597. Bibcode:2007PLoSO...2..597H. doi:10.1371/journal.pone.0000597. PMC 1895920. PMID 17611629.
- ↑ Wedeen, Van J.; Hagmann, Patric; Tseng, Wen-Yih Isaac; Reese, Timothy G.; Weisskoff, Robert M. (2005). "Mapping complex tissue architecture with diffusion spectrum magnetic resonance imaging". Magnetic Resonance in Medicine. 54 (6): 1377–86. doi:10.1002/mrm.20642. PMID 16247738.
- ↑ Le Bihan D. and Breton,E. Imagerie de diffusion in vivo par résonance magnétique nucléaire. C.R.Acad.Sc.Paris T.301, Série II:1109-1112, 1985
- ↑ Le Bihan D., Breton E., Lallemand D., Grenier P., Cabanis E., Laval-Jeantet M. MR Imaging of Intravoxel Incoherent Motions: Application to Diffusion and Perfusion in Neurologic Disorders, Radiology, 161,401-407, 1986.
- ↑ Wedeen, V.J.; Wang, R.P.; Schmahmann, J.D.; Benner, T.; Tseng, W.Y.I.; Dai, G.; Pandya, D.N.; Hagmann, P.; d'Arceuil, H.; De Crespigny, A.J. (2008). "Diffusion spectrum magnetic resonance imaging (DSI) tractography of crossing fibers". NeuroImage. 41 (4): 1267–77. doi:10.1016/j.neuroimage.2008.03.036. PMID 18495497.
- ↑ Sporns, O (2006). "Small-world connectivity, motif composition, and complexity of fractal neuronal connections". Bio Systems. 85 (1): 55–64. doi:10.1016/j.biosystems.2006.02.008. PMID 16757100.
- ↑ Sporns, Olaf; Honey, Christopher J.; Kötter, Rolf (2007). Kaiser, Marcus, ed. "Identification and Classification of Hubs in Brain Networks". PLoS ONE. 2 (10): e1049. Bibcode:2007PLoSO...2.1049S. doi:10.1371/journal.pone.0001049. PMC 2013941. PMID 17940613.
- ↑ Hagmann, Patric; Cammoun, Leila; Gigandet, Xavier; Meuli, Reto; Honey, Christopher J.; Wedeen, Van J.; Sporns, Olaf (2008). Friston, Karl J., ed. "Mapping the Structural Core of Human Cerebral Cortex". PLoS Biology. 6 (7): e159. doi:10.1371/journal.pbio.0060159. PMC 2443193. PMID 18597554.
- ↑ Kerepesi, Csaba; et al. (2016). "How to Direct the Edges of the Connectomes: Dynamics of the Consensus Connectomes and the Development of the Connections in the Human Brain". PLOS ONE. 11 (6): e0158680. doi:10.1371/journal.pone.0158680. PMC 4928947. PMID 27362431.
- ↑ Ingalhalikar, M.; Smith, A.; Parker, D.; Satterthwaite, T. D.; Elliott, M. A.; Ruparel, K.; Hakonarson, H.; Gur, R. E.; Gur, R. C.; Verma, R. (2013). "Sex differences in the structural connectome of the human brain". Proceedings of the National Academy of Sciences. 111 (2): 823–828. Bibcode:2014PNAS..111..823I. doi:10.1073/pnas.1316909110. ISSN 0027-8424. PMID 24297904.
- ↑ Szalkai, Balázs; Varga, Bálint; Grolmusz, Vince (2015). "Graph Theoretical Analysis Reveals: Women's Brains Are Better Connected than Men's". PLOS ONE. 10 (7): e0130045. doi:10.1371/journal.pone.0130045. ISSN 1932-6203.
- ↑ Gong, G.; Rosa-Neto, P.; Carbonell, F.; Chen, Z. J.; He, Y.; Evans, A. C. (2009). "Age- and Gender-Related Differences in the Cortical Anatomical Network". Journal of Neuroscience. 29 (50): 15684–15693. doi:10.1523/JNEUROSCI.2308-09.2009. ISSN 0270-6474.
- ↑ Irimia A, Chambers MC, Torgerson CM, Van Horn JD (April 2012). "Circular representation of human cortical networks for subject and population-level connectomic visualization". NeuroImage. 60 (2): 1340–51. doi:10.1016/j.neuroimage.2012.01.107. PMC 3594415. PMID 22305988.
- ↑ Irimia A, Chambers MC, Torgerson CM, et al. (2012). "Patient-tailored connectomics visualization for the assessment of white matter atrophy in traumatic brain injury". Frontiers in Neurology. 3: 10. doi:10.3389/fneur.2012.00010. PMC 3275792. PMID 22363313.
- ↑ Van Horn JD, Irimia A, Torgerson CM, Chambers MC, Kikinis R, Toga AW (2012). "Mapping connectivity damage in the case of Phineas Gage". PLOS ONE. 7 (5): e37454. Bibcode:2012PLoSO...737454V. doi:10.1371/journal.pone.0037454. PMC 3353935. PMID 22616011.
External links
| Wikimedia Commons has media related to Human connectome. |
- Open Connectome Project
- The Connectome Project at Harvard
- The official site for the NIH-sponsored Human Connectome Project
- The NITRC Human Connectome Project Site
- Connectome Research by EPFL/CHUV, Lausanne, Switzerland
- The NIH Blueprint for Neuroscience Research
- Connectome Research led by Dr. Shawn Mikula
- TED talk by Sebastian Seung: I am my connectome
- EyeWire, a citizen science game to map the retinal connectome
- Connectome on Scholarpedia
- MITK Diffusion: Free software for the processing of diffusion-weighted MR data including connectomics