Computer-aided diagnosis
In radiology, computer-aided detection (CADe), also called computer-aided diagnosis (CADx), are systems that assist doctors in the interpretation of medical images. Imaging techniques in X-ray, MRI, and ultrasound diagnostics yield a great deal of information that the radiologist or other professional has to analyze and evaluate comprehensively in a short time. CAD systems process digital images for typical appearances and to highlight conspicuous sections, such as possible diseases, in order to offer input to support a decision taken by the professional.
CAD is an interdisciplinary technology combining elements of artificial intelligence and computer vision with radiological image processing. A typical application is the detection of a tumor. For instance, some hospitals use CAD to support preventive medical check-ups in mammography (diagnosis of breast cancer), the detection of polyps in the colon, and lung cancer.
Computer-aided detection (CADe) systems are usually confined to marking conspicuous structures and sections. Computer-aided diagnosis (CADx) systems evaluate the conspicuous structures. For example, in mammography CAD highlights microcalcification clusters and hyperdense structures in the soft tissue. This allows the radiologist to draw conclusions about the condition of the pathology. Another application is CADq, which quantifies, e.g., the size of a tumor or the tumor's behavior in contrast medium uptake. Computer-aided simple triage (CAST) is another type of CAD, which performs a fully automatic initial interpretation and triage of studies into some meaningful categories (e.g. negative and positive). CAST is particularly applicable in emergency diagnostic imaging, where a prompt diagnosis of critical, life-threatening condition is required.
Although CAD has been used in clinical environments for over 40 years, CAD usually does not substitute the doctor or other professional, but rather plays a supporting role. The professional (generally a radiologist) is generally responsible for the final interpretation of a medical image. However, the goal of some CAD systems is to detect earliest signs of abnormality in patients that human professionals cannot, as in diabetic retinopathy.
Computer-aided diagnosis topics
Methodology
CAD is fundamentally based on highly complex pattern recognition. X-ray or other types of images are scanned for suspicious structures. Normally a few thousand images are required to optimize the algorithm. Digital image data are copied to a CAD server in a DICOM-format and are prepared and analyzed in several steps.
1. Preprocessing for
- Reduction of artifacts (bugs in images)
- Image noise reduction
- Leveling (harmonization) of image quality (increased contrast) for clearing the image's different basic conditions e.g. different exposure parameter.
- Filtering
2. Segmentation for
- Differentiation of different structures in the image, e.g. heart, lung, ribcage, blood vessels, possible round lesions
- Matching with anatomic databank
- Sample gray-values in volume of interest[1]
3. Structure/ROI (Region of Interest) Analyze Every detected region is analyzed individually for special characteristics:
- Compactness
- Form, size and location
- Reference to close-by structures / ROIs
- Average greylevel value analyze within a ROI
- Proportion of greylevels to border of the structure inside the ROI
4. Evaluation / classification After the structure is analyzed, every ROI is evaluated individually (scoring) for the probability of a TP. The following procedures are examples of classification algorithms.
- Nearest-Neighbor Rule (e.g. k-nearest neighbors)
- Minimum distance classifier
- Cascade Classifier
- Naive Bayesian Classifier
- Artificial Neural Network
- Radial basis function network (RBF)
- Support Vector Machine (SVM)
- Principle Component Analysis (PCA)
If the detected structures have reached a certain threshold level, they are highlighted in the image for the radiologist. Depending on the CAD system these markings can be permanently or temporary saved. The latter's advantage is that only the markings which are approved by the radiologist are saved. False hits should not be saved, because an examination at a later date becomes more difficult then.
Sensitivity and specificity
CAD systems seek to highlight suspicious structures. Today's CAD systems cannot detect 100% of pathological changes. The hit rate (sensitivity) can be up to 90% depending on system and application.[2] A correct hit is termed a True Positive (TP), while the incorrect marking of healthy sections constitutes a False Positive (FP). The less FPs indicated, the higher the specificity is. A low specificity reduces the acceptance of the CAD system because the user has to identify all of these wrong hits. The FP-rate in lung overview examinations (CAD Chest) could be reduced to 2 per examination. In other segments (e.g. CT lung examinations) the FP-rate could be 25 or more. In CAST systems the FP rate must be extremely low (less than 1 per examination) to allow a meaningful study triage.
Absolute detection rate
The absolute detection rate of the radiologist is an alternative metric to sensitivity and specificity. Overall, results of clinical trials about sensitivity, specificity, and the absolute detection rate can vary markedly. Each study result depends on its basic conditions and has to be evaluated on those terms. The following facts have a strong influence:
- Retrospective or prospective design
- Quality of the used images
- Condition of the x-ray examination
- Radiologist's experience and education
- Type of lesion
- Size of the considered lesion
Applications
CAD is used in the diagnosis of breast cancer, lung cancer, colon cancer, prostate cancer, bone metastases, coronary artery disease, congenital heart defect, pathological brain detection, Alzheimer's disease, and diabetic retinopathy.
Breast cancer
CAD is used in screening mammography (X-ray examination of the female breast). Screening mammography is used for the early detection of breast cancer. CAD is especially established in US and the Netherlands and is used in addition to human evaluation, usually by a radiologist. The first CAD system for mammography was developed in a research project at the University of Chicago. Today it is commercially offered by iCAD and Hologic. There are currently some non-commercial projects being developed, such as Ashita Project, a gradient-based screening software by Alan Hshieh, as well. However, while achieving high sensitivities, CAD systems tend to have very low specificity and the benefits of using CAD remain uncertain. Some studies suggest a positive impact on mammography screening programs,[3][4] but others show no improvement.[5][6] A 2008 systematic review on computer-aided detection in screening mammography concluded that CAD does not have a significant effect on cancer detection rate, but does undesirably increase recall rate (i.e. the rate of false positives). However, it noted considerable heterogeneity in the impact on recall rate across studies.[7]
Procedures to evaluate mammography based on magnetic resonance imaging exist too.
Lung cancer (bronchial carcinoma)
In the diagnosis of lung cancer, computed tomography with special three-dimensional CAD systems are established and considered as gold standard. At this a volumetric dataset with up to 3,000 single images is prepared and analyzed. Round lesions (lung cancer, metastases and benign changes) from 1 mm are detectable. Today all well-known vendors of medical systems offer corresponding solutions.
Early detection of lung cancer is valuable. The 5-year-survival-rate of lung cancer has stagnated in the last 30 years and is now at approximately just 15%. Lung cancer takes more victims than breast cancer, prostate cancer and colon cancer together. This is due to the asymptomatic growth of this cancer. In the majority of cases it is too late for a successful therapy if the patient develops first symptoms (e.g. chronic croakiness or hemoptysis). But if the lung cancer is detected early (mostly by chance), there is a survival rate at 47% according to the American Cancer Society.[8] At the same time the standard x-ray-examination of the lung is the most frequently x-ray examination with a 50% share. Indeed, the random detection of lung cancer in the early stage (stage 1) in the x-ray image is difficult. It is a fact that round lesions vary from 5–10 mm are easily overlooked.[9] The routine application of CAD Chest Systems may help to detect small changes without initial suspicion. Philips was the first vendor to present a CAD for early detection of round lung lesions on x-ray images.[10]
Colon cancer
CAD is available for detection of colorectal polyps in the colon. Polyps are small growths that arise from the inner lining of the colon. CAD detects the polyps by identifying their characteristic "bump-like" shape. To avoid excessive false positives, CAD ignores the normal colon wall, including the haustral folds. In early clinical trials, CAD helped radiologists find more polyps in the colon than they found prior to using CAD.[11][12]
Coronary artery disease
CAD is available for the automatic detection of significant (causing more than 50% stenosis) coronary artery disease in coronary CT angiography (CCTA) studies. A low false positives rate (60-70% specificity per patient)[13][14][15] allows using it as a computer-aided simple triage (CAST) tool distinguishing between positive and negative studies and yielding a preliminary report. This, for example, can be used for chest pain patients' triage in an emergency setting.
Congenital heart defect
Early detection of pathology can be the difference between life and death. CADe can be done by auscultation with a digital stethoscope and specialized software, also known as Computer-aided auscultation. Murmurs, irregular heart sounds, caused by blood flowing through a defective heart, can be detected with high sensitivity and specificity. Computer-aided auscultation is sensitive to external noise and bodily sounds and requires an almost silent environment to function accurately.
Pathological brain detection (PBD)
Chaplot et al. was the first to use Discrete Wavelet Transform (DWT) coefficients to detect pathological brains.[16] Maitra and Chatterjee employed the Slantlet transform, which is an improved version of DWT. Their feature vector of each image is created by considering the magnitudes of Slantlet transform outputs corresponding to six spatial positions chosen according to a specific logic.[17]
In 2010, Wang and Wu presented a forward neural network (FNN) based method to classify a given MR brain image as normal or abnormal. The parameters of FNN were optimized via adaptive chaotic particle swarm optimization (ACPSO). Results over 160 images showed that the classification accuracy was 98.75%.[18]
In 2011, Wu and Wang proposed using DWT for feature extraction, PCA for feature reduction, and FNN with scaled chaotic artificial bee colony (SCABC) as classifier.[19]
In 2013, Saritha et al. were the first to apply wavelet entropy (WE) to detect pathological brains. Saritha also suggested to use spider-web plots.[20] Later, Zhang et al. proved removing spider-web plots did not influence the performance.[21] Genetic pattern search method was applied to identify abnormal brain from normal controls. Its classification accuracy was reported as 95.188%.[22] Das et al. proposed to use Ripplet transform.[23] Zhang et al. proposed to use particle swarm optimization (PSO).[24] Kalbkhani et al. suggested to use GARCH model.[25]
In 2014, El-Dahshan et al. suggested to use pulse coupled neural network.[26]
In 2015, Zhou et al. suggested to apply naive Bayes classifier to detect pathological brains.[27]
Alzheimer's disease
CADs can be used to identify subjects with Alzheimer's and mild cognitive impairment from normal elder controls.
In 2014, Padma et al. used combined wavelet statistical texture features to segment and classify AD benign and malignant tumor slices.[28] Zhang et al. found kernel support vector machine decision tree had 80% classification accuracy, with an average computation time of 0.022s for each image classification.[29]
Eigenbran is a novel brain feature that can help to detect AD. Polynomial kernel SVM has been shown to achieve good accuracy. The polynomial KSVM performs better than linear SVM and RBF kernel SVM.[30]
Nuclear medicine
CADx is available for nuclear medicine images. Commercial CADx systems for the diagnosis of bone metastases in whole-body bone scans and coronary artery disease in myocardial perfusion images exist.[31]
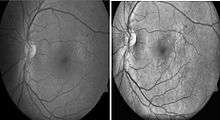
Diabetic retinopathy
Diabetic retinopathy is a disease of the retina that is diagnosed predominantly by fundoscopic images. Diabetic patients in industrialised countries generally undergo regular screening for the condition. Imaging is used to recognize early signs of abnormal retinal blood vessels. Manual analysis of these images can be time-consuming and unreliable.[32][33] CAD has been employed to enhance the accuracy, sensitivity, and specificity of automated detection method. The use of some CAD systems to replace human graders can be safe and cost effective.[33]
Image pre-processing, and feature extraction and classification are two main stages of these CAD algorithms.[34]
Pre-processing methods
Image normalization is minimizing the variation across the entire image. Intensity variations in areas between periphery and central macular region of the eye have been reported to cause inaccuracy of vessel segmentation.[35] Based on the 2014 review, this technique was the most frequently used and appeared in 11 out of 40 recently (since 2011) published primary research.[34]
Histogram equalization is useful in enhancing contrast within an image.[37] This technique is used to increase local contrast. At the end of the processing, areas that were dark in the input image would be brightened, greatly enhancing the contrast among the features present in the area. On the other hand, brighter areas in the input image would remain bright or be reduced in brightness to equalize with the other areas in the image. Besides vessel segmentation, other features related to diabetic retinopathy can be further separated by using this pre-processing technique. Microaneurysm and hemorrhages are red lesions, whereas exudates are yellow spots. Increasing contrast between these two groups allow better visualization of lesions on images. With this technique, 2014 review found that 10 out of the 14 recently (since 2011) published primary research.[34]
Green channel filtering is another technique that is useful in differentiating lesions rather than vessels. This method is important because it provides the maximal contrast between diabetic retinopathy-related lesions.[38] Microaneurysms and hemorrhages are red lesions that appear dark after application of green channel filtering. In contrast, exudates, which appear yellow in normal image, are transformed into bright white spots after green filtering. This technique is mostly used according to the 2014 review, with appearance in 27 out of 40 published articles in the past three years.[34] In addition, green channel filtering can be used to detect center of optic disc in conjunction with double-windowing system.[37]
Non-uniform illumination correction is a technique that adjusts for non-uniform illumination in fundoscopic image. Non-uniform illumination can be a potential error in automated detection of diabetic retinopathy because of changes in statistical characteristics of image.[34] These changes can affect latter processing such as feature extraction and are not observable by humans. Correction of non-uniform illumination (f') can be achieved by modifying the pixel intensity using known original pixel intensity (f), and average intensities of local (λ) and desired pixels (μ) (see formula below).[39] Walter-Klein transformation is then applied to achieve the uniform illumination.[39] This technique is the least used pre-processing method in the review from 2014.

Morphological operations is the second least used pre-processing method in 2014 review.[34] The main objective of this method is to provide contrast enhancement, especially darker regions compared to background.
Feature Extractions and Classifications
After pre-processing of funduscopic image, the image will be further analyzed using different computational methods. However, the current literature agreed that some methods are used more often than others during vessel segmentation analyses. These methods are SVM, multi-scale, vessel-tracking, region growing approach, and model-based approaches.

Support vector machine is by far the most frequently used classifier in vessel segmentation, up to 90% of cases.[40] SVM is a supervised learning model that belongs to the broader category of pattern recognition technique. The algorithm works by creating a largest gap between distinct samples in the data. The goal is to create the largest gap between these components that minimize the potential error in classification.[41] In order to successfully segregate blood vessel information from the rest of the eye image, SVM algorithm creates support vectors that separate the blood vessel pixel from the rest of the image through a supervised environment. Detecting blood vessel from new images can be done through similar manner using support vectors. Combination with other pre-processing technique, such as green channel filtering, greatly improves the accuracy of detection of blood vessel abnormalities.[34] Some beneficial properties of SVM include[41]
- Flexibility -Highly flexible in terms of function
- Simplicity - Simple, especially with large datasets (only support vectors are needed to create separation between data)
Multi-scale approach is a multiple resolution approach in vessel segmentation. At low resolution, large-diameter vessels can first be extracted. By increasing resolution, smaller branches from the large vessels can be easily recognized. Therefore, one advantage of using this technique is the increased analytical speed.[32] Additionally, this approach can be used with 3D images. The surface representation is a surface normal to the curvature of the vessels, allowing the detection of abnormalities on vessel surface.[37]
Vessel tracking is the ability of the algorithm to detect “centerline” of vessels. These centerlines are maximal peak of vessel curvature. Centers of vessels can be found using directional information that is provided by Gaussian filter.[37] Similar approaches that utilize the concept of centerline are the skeleton-based and differential geometry-based.[32]
Region growing approach is a method of detecting neighboring pixels with similarities. A seed point is required for such method to start. Two elements are needed for this technique to work: similarity and spatial proximity. A neighboring pixel to the seed pixel with similar intensity is likely to be the same type and will be added to the growing region. One disadvantage of this technique is that it requires manual selection of seed point, which introduces bias and inconsistency in the algorithm.[32] This technique is also being used in optic disc identification[37].
Model-based approaches employ representation to extract vessels from images. Three broad categories of model-based are known: deformable, parametric, and template matching.[32] Deformable methods uses objects that will be deformed to fit the contours of the objects on the image. Parametric uses geometric parameters such as tubular, cylinder, or ellipsoid representation of blood vessels. Classical snake contour in combination with blood vessel topological information can also be used as a model-based approach.[42] Lastly, template matching is the usage of a template, fitted by stochastic deformation process using Hidden Markov Mode 1.
References
- ↑ Echegaray, Sebastian; Gevaert, Olivier; Shah, Rajesh; Kamaya, Aya; Louie, John; Kothary, Nishita; Napel, Sandy (18 November 2015). "Core samples for radiomics features that are insensitive to tumor segmentation: method and pilot study using CT images of hepatocellular carcinoma". Journal of Medical Imaging. 2 (4): 041011. doi:10.1117/1.JMI.2.4.041011.
- ↑ Wollenweber T.; Janke B.; Teichmann A.; Freund M. (2007). "Korrelation zwischen histologischem Befund und einem Computer-assistierten Detektionssystem (CAD) für die Mammografie.". Geburtsh Frauenheilk. 67: 135–141. doi:10.1055/s-2006-955983.
- ↑ Gilbert FJ, Astley SM, Gillan MG, Agbaje OF, Wallis MG, James J, Boggis CR, Duffy SW (2008). "Single Reading with Computer-Aided Detection for Screening Mammography" (PDF). The New England Journal of Medicine. 359: 1675–1684. doi:10.1056/NEJMoa0803545. PMID 18832239.
- ↑ Effect of Computer-Aided Detection on Independent Double Reading of Paired Screen-Film and Full-Field Digital Screening Mammograms Per Skaane, Ashwini Kshirsagar, Sandra Stapleton, Kari Young and Ronald A. Castellino
- ↑ Taylor P, Champness J, Given-Wilson R, Johnston K, Potts H (2005). "Impact of computer-aided detection prompts on the sensitivity and specificity of screening mammography". Health Technology Assessment. 9 (6): 1–70. doi:10.3310/hta9060.
- ↑ Fenton JJ, Taplin SH, Carney PA, Abraham L, Sickles EA, D'Orsi C, et al. (2007). "Influence of computer-aided detection on performance of screening mammography" (PDF). N Engl J Med. 356 (14): 1399–409. doi:10.1056/nejmoa066099.
- ↑ Taylor P, Potts HW (2008). "Computer aids and human second reading as interventions in screening mammography: Two systematic reviews to compare effects on cancer detection and recall rate". European Journal of Cancer. 44: 798–807. doi:10.1016/j.ejca.2008.02.016.
- ↑ https://web.archive.org/web/20070801000000*/http://www.cancer.org/downloads/cri/6976.00.pdf
- ↑ Wu N, Gamsu G, Czum J, Held B, Thakur R, Nicola G (Mar 2006). "Detection of small pulmonary nodules using direct digital radiography and picture archiving and communication systems.". J Thorac Imaging. 21 (1): 27–31. doi:10.1097/01.rti.0000203638.28511.9b. PMID 16538152.
- ↑ xLNA (x-Ray Lung Nodule Assessment)
- ↑ Petrick N, Haider M, Summers RM, Yeshwant SC, Brown L, Iuliano EM, Louie A, Choi JR, Pickhardt PJ (Jan 2008). "CT colonography with computer-aided detection as a second reader: observer performance study". Radiology. 246 (1): 148–56. doi:10.1148/radiol.2453062161. PMID 18096536. Erratum in: Radiology. 2008 Aug;248(2):704. doi:10.1148/radiol.2453062161 PMID 18096536
- ↑ Halligan S, Altman DG, Mallett S, Taylor SA, Burling D, Roddie M, Honeyfield L, McQuillan J, Amin H, Dehmeshki J (Dec 2006). "Computed tomographic colonography: assessment of radiologist performance with and without computer-aided detection". Gastroenterology. 131 (6): 1690–9. doi:10.1053/j.gastro.2006.09.051. PMID 17087934.
- ↑ Arnoldi E.; Gebregziabher M.; Schoepf U. J.; Goldenberg R.; Ramos-Duran L.; Zwerner P. L.; Nikolaou K.; Reiser M. F.; Costello P.; Thilo C. (2010). "Automated computer-aided stenosis detection at coronary CT angiography: initial experience". European Radiology. 20 (5): 1160–7. doi:10.1007/s00330-009-1644-7. PMID 19890640.
- ↑ Halpern E. J.; Halpern D. J. (2011). "Diagnosis of coronary stenosis with CT angiography: comparison of automated computer diagnosis with expert readings". Academic Radiology. 18 (3): 324–33. doi:10.1016/j.acra.2010.10.014. PMID 21215663.
- ↑ Kang KW, Chang HJ, Shim H, Kim YJ, Choi BW, Yang WI, Shim JY, Ha J, Chung N (2012). "Feasibility of an automatic computer-assisted algorithm for the detection of significant coronary artery disease in patients presenting with acute chest pain". Eur J Radiol. 81 (4): e640–6. doi:10.1016/j.ejrad.2012.01.017. PMID 22304980.
- ↑ Chaplot, S., L.M. Patnaik, and N.R. Jagannathan, Classification of magnetic resonance brain images using wavelets as input to support vector machine and neural network. Biomedical Signal Processing and Control, 2006. 1(1): p. 86-92.
- ↑ Maitra, M. and A. Chatterjee, A Slantlet transform based intelligent system for magnetic resonance brain image classification. Biomedical Signal Processing and Control, 2006. 1(4): p. 299-306.
- ↑ Wang, S.; Wu, W. (2010). "A Novel Method for Magnetic Resonance Brain Image Classification based on Adaptive Chaotic PSO". Progress in Electromagnetics Research. 109: 325–343.
- ↑ Zhang, Yudong; Wu, L. (2011). "Magnetic Resonance Brain Image Classification by an Improved Artificial Bee Colony Algorithm". Progress in Electromagnetics Research. 2011: 65–79.
- ↑ Saritha, M., K.P. Joseph, and A.T. Mathew, Classification of MRI brain images using combined wavelet entropy based spider web plots and probabilistic neural network. Pattern Recognition Letters, 2013. 34(16): p. 2151-2156.
- ↑ Zhang, Yudong; Dong, Zhengchao; Ji, Genlin (2015). "Effect of spider-web-plot in MR brain image classification". Pattern Recognition Letters. 62: 14–16. doi:10.1016/j.patrec.2015.04.016.
- ↑ Zhang, Y.; Wang, S.; Ji, G.; Dong, Z. (2013). "Genetic Pattern Search and its Application to Brain Image Classification". Mathematical Problems in Engineering. 2013: 1–8. doi:10.1155/2013/580876.
- ↑ Das S.; Chowdhury M.; Kundu M.K. (2013). "Brain MR Image Classification Using Multiscale Geometric Analysis of Ripplet". Progress in Electromagnetics Research-Pier. 137: 1–17. doi:10.2528/pier13010105.
- ↑ Zhang, Y.; Wang, S. (2013). "An MR Brain Images Classifier System via Particle Swarm Optimization and Kernel Support Vector Machine". The Scientific World Journal. 2013: 9. doi:10.1155/2013/130134.
- ↑ Kalbkhani H.; Shayesteh M.G.; Zali-Vargahan B. (2013). "Robust algorithm for brain magnetic resonance image (MRI) classification based on GARCH variances series". Biomedical Signal Processing and Control. 8 (6): 909–919. doi:10.1016/j.bspc.2013.09.001.
- ↑ El-Dahshan E.S.A.; Mohsen H.M.; Revett K.; et al. (2014). "Computer-aided diagnosis of human brain tumor through MRI: A survey and a new algorithm". Expert Systems with Applications. 41 (11): 5526–5545. doi:10.1016/j.eswa.2014.01.021.
- ↑ Zhou, Xing-Xing (2015). "Detection of Pathological Brain in MRI Scanning Based on Wavelet-Entropy and Naive Bayes Classifier". Bioinformatics and Biomedical Engineering: 201–209. doi:10.1007/978-3-319-16483-0_20.
- ↑ Padma, A. and R. Sukanesh, Segmentation and Classification of Brain CT Images Using Combined Wavelet Statistical Texture Features. Arabian Journal for Science and Engineering, 2014. 39(2): p. 767-776.
- ↑ Zhang, Yudong; Wang, Shuihua; Dong, Zhengchao (2014). "Classification of Alzheimer Disease Based on Structural Magnetic Resonance Imaging by Kernel Support Vector Machine Decision Tree". Progress in Electromagnetics Research - Pier. 144: 185–191.
- ↑ Dong, Z.C. (2015). "Detection of subjects and brain regions related to Alzheimer's disease using 3D MRI scans based on eigenbrain and machine learning". Frontiers in Computational Neuroscience. 66 (9): 1–15. doi:10.3389/fncom.2015.00066.
- ↑ EXINI Diagnostics
- 1 2 3 4 5 Kaur, M; Talwar, R (2014). "Review on: blood vessel extraction and eye retinopathy detection". International Journal of Computer Science and Information Technologies. 5 (6): 7513–7516.
- 1 2 Tufail, A; Rudisill, C; Egan, C; Kapetanakis, VV; Salas-Vega, S; Owen, CG; Lee, A; Louw, V; Anderson, J; Liew, G; Bolter, L; Srinivas, S; Nittala, M; Sadda, S; Taylor, P; Rudnicka, AR (n.d.). "Automated diabetic retinopathy image assessment software: diagnostic accuracy and cost-effectiveness compared to human graders". Ophthalmology. in press.
- 1 2 3 4 5 6 7 Ahmad, A.; Mansoor, A. B.; Mumtaz, R.; Khan, M.; Mirza, S. H. (2014-12-01). "Image processing and classification in diabetic retinopathy: A review". 2014 5th European Workshop on Visual Information Processing (EUVIP): 1–6. doi:10.1109/EUVIP.2014.7018362.
- ↑ Fraz, M. M.; Barman, S. A.; Remagnino, P.; Hoppe, A.; Basit, A.; Uyyanonvara, B.; Rudnicka, A. R.; Owen, C. G. (2012-11-01). "An Approach to Localize the Retinal Blood Vessels Using Bit Planes and Centerline Detection". Comput. Methods Prog. Biomed. 108 (2): 600–616. doi:10.1016/j.cmpb.2011.08.009. ISSN 0169-2607.
- ↑ Priya, R; Aruna, P (2011). "Review of automated diagnosis of diabetic retinopathy using the support vector machine". International Journal of Applied Engineering Research, Dindigul. 1 (4): 844–862.
- 1 2 3 4 5 Biradar, S; Jadhav, AS (2015). "A survey on blood vessel segmentation and optic disc segmentation of retinal images". International Journal of Advanced Research in Computer and Communication Engineering. 4 (5): 21–26.
- ↑ Saleh, Marwan D.; Eswaran, C. (2012-10-01). "An Automated Decision-support System for Non-proliferative Diabetic Retinopathy Disease Based on MAs and HAs Detection". Comput. Methods Prog. Biomed. 108 (1): 186–196. doi:10.1016/j.cmpb.2012.03.004. ISSN 0169-2607.
- 1 2 Antal, B.; Hajdu, A. (2012-06-01). "An Ensemble-Based System for Microaneurysm Detection and Diabetic Retinopathy Grading". IEEE Transactions on Biomedical Engineering. 59 (6): 1720–1726. doi:10.1109/TBME.2012.2193126. ISSN 0018-9294.
- ↑ Patwari, Manjiri; Manza, Ramesh; Rajput, Yogesh; Saswade, Manoj; Deshpande, Neha (2013-10-01). "Review on Detection and Classification of Diabetic Retinopathy Lesions Using Image Processing Techniques". ResearchGate. 2 (10).
- 1 2 Administrator (2015-05-20). "Review on: Detection of Diabetic Retinopathy using SVM and MDA". International Journal of Computer Applications. 117 (20).
- ↑ Espona, L.; Carreira, M. J.; Ortega, M.; Penedo, M. G. (2007-06-06). Martí, Joan; Benedí, José Miguel; Mendonça, Ana Maria; Serrat, Joan, eds. Pattern Recognition and Image Analysis. Lecture Notes in Computer Science. Springer Berlin Heidelberg. pp. 178–185. doi:10.1007/978-3-540-72849-8_23#page-1. ISBN 9783540728481.
External links
- Digital Retinal Images for Vessel Extraction (DRIVE)
- STructured Analysis of the REtina (STARE)
- High-Resolution Fundus (HRF) Image Database