Comparison of United States incarceration rate with other countries

The United States has the largest prison population in the world,[1][2][3] and the second-highest per-capita incarceration rate, behind Seychelles (which in 2014 had a total prison population of 735 out of a population of around 92,000).[1][4] In 2013 in the USA, there were 698 persons incarcerated per 100,000 population.[5][1]
While the United States represents about 4.4 percent of the world's population, it houses around 22 percent of the world's prisoners.[6][7]
Comparing other English-speaking developed countries,[1] the incarceration rate of Canada is 106 per 100,000 (as of 2014),[8] England and Wales is 148 per 100,000 (as of 2015),[9] and Australia is 151 per 100,000 (as of 2015).[10] Comparing other developed countries, the rate of Spain is 141 per 100,000 (as of 2015),[11] Greece is 120 per 100,000 (as of 2013),[12] Norway is 71 per 100,000 (as of 2015),[13] Netherlands is 75 per 100,000 (as of 2013),[14] and Japan is 49 per 100,000 (as of 2014).[15]
Comparing other countries with similar percentages of immigrants, Germany has a rate of 76 per 100,000 (as of 2014),[16] Italy is 85 per 100,000 (as of 2015),[17] and Saudi Arabia is 161 per 100,000 (as of 2013).[18] Comparing other countries with a zero tolerance policy for illegal drugs, the rate of Russia is 455 per 100,000 (as of 2015),[19] Kazakhstan is 275 per 100,000 (as of 2015),[20] Singapore is 220 per 100,000 (as of 2014),[21] and Sweden is 60 per 100,000 (as of 2014).[22]
The incarceration rate of the People's Republic of China varies depending on sources and measures. According to the International Centre for Prison Studies, the rate for only sentenced prisoners is 120 per 100,000 (as of 2009) and the rate for prisoners including those in administrative detention and pre-trial detainees is 186 per 100,000 (as of 2009).[1] Su Jiang assessed the incarceration rate for all forms of imprisonment in China at 218 prisoners per 100,000 population.[23] The total number of prisoners held, 1.6 million, is second to that of the United States despite its population being over four times larger. Harry Wu, a U.S.-based human rights activist and ex-Chinese labor camp prisoner, estimates that "in the last 60 years, more than 40–50 million people" were in Chinese labor camps.[24]
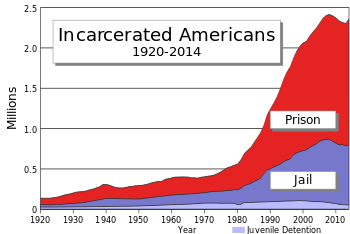
U.S. incarceration rate peaked in 2008

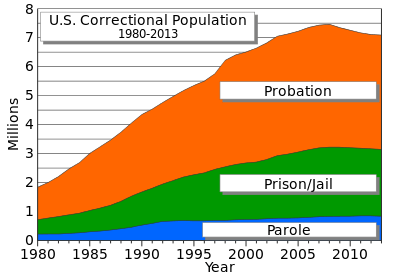
Total US incarceration (prisons and jails) peaked in 2008. On January 1, 2008 more than 1 in 100 adults in the United States were in prison or jail.[27][28] Total correctional population (prison, jail, probation, parole) peaked in 2007.[26] If all prisoners are counted (including juvenile, territorial, ICE, Indian country, and military), then in 2008 the USA had around 24.7% of the world's 9.8 million prisoners.[29][30][25]
A 2008 New York Times article,[31] said that "it is the length of sentences that truly distinguishes American prison policy. Indeed, the mere number of sentences imposed here would not place the United States at the top of the incarceration lists. If lists were compiled based on annual admissions to prison per capita, several European countries would outpace the United States. But American prison stays are much longer, so the total incarceration rate is higher."
More comparisons
In the United States, women make up more than one tenth of the whole prison population.[32] In most countries, the proportion of female inmates to the larger population is closer to one in twenty. Australia is the exception where the rate of female imprisonment increased from 9.2 percent in 1991 to 15.3 percent in 1999.[33]
In addition, the United States has significant racial disparities in rates of incarceration.[34] According to Michelle Alexander, the United States "imprisons a larger percentage of its black population than South Africa did at the height of apartheid".[35] The black imprisonment rate of South Africa could not have come close to today’s American rate simply due to limited room. Notably, there’s something of an international theme in countries comparing themselves to apartheid South Africa. There were instances where Australian journalists were drawing the same contrast relative to rates of imprisonment in their country.[36] In the Huffington Post piece "Mass Incarceration's Failure", attorney Antonio Moore states "The incarceration rate for young black men ages 20 to 39, is nearly 10,000 per 100,000. To give context, during the racial discrimination of apartheid in South Africa, the prison rate for black male South Africans, rose to 851 per 100,000."[37]
A major contributor to the high incarceration rates is the length of the prison sentences in the United States. One of the criticisms of the United States system is that it has much longer sentences than any other part of the world. The typical mandatory sentence for a first-time drug offense in federal court is five or ten years, compared to other developed countries around the world where a first time offense would warrant at most 6 months in jail. [35] Mandatory sentencing prohibits judges from using their discretion and forces them to place longer sentences on nonviolent offenses than they normally would do.
Even though there are other countries that have a higher rate of committing inmates to prison annually, the fact that the United States keeps their prisoners longer causes the total incarceration rate to become higher. To give an example, the average burglary sentence in the United States is 16 months, compared to 5 months in Canada and 7 months in England.[31]
The US incarceration rate peaked in 2008 when about 1 in 100 US adults was behind bars.[28] This incarceration rate exceeded the average incarceration levels in the Soviet Union during the existence of the infamous Gulag system, when the Soviet Union's population reached 168 million, and 1.2 to 1.5 million people were in the Gulag prison camps and colonies (i.e. about 0.8 imprisoned per 100 USSR residents, according to numbers from Anne Applebaum and Steven Rosefielde).[38][39] The Soviet Union's incarceration rates from 1934 to 1953 were historically the world's highest for a modern age country, according to The Gulag Archipelago book (1973) by Nobel Prize winner Aleksandr Solzhenitsyn.[40] In The New Yorker article The Caging of America (2012), Adam Gopnik writes: "Over all, there are now more people under 'correctional supervision' in America—more than six million—than were in the Gulag Archipelago under Stalin at its height."[41]
See also
- List of U.S. states by incarceration rate
- Incarceration in the United States
- Youth incarceration in the United States
- War on Drugs
References
- 1 2 3 4 5 Entire world – Prison Population Rates per 100,000 of the national population. Highest to Lowest Rates. For more details about the figures of any country, click on the name of that country. World Prison Brief. International Centre for Prison Studies. See this page for breakdowns by region, whole world, prison population total, prison population rate, percentage of pre-trial detainees / remand prisoners, percentage of female prisoners, percentage of foreign prisoners, and occupancy rate.
- ↑ Mahapatra, Lisa (19 March 2014). Incarcerated In America: Why Are So Many People In US Prisons? (CHARTS). International Business Times. Chart showing incarceration rates of 50 most populous countries. Another chart showing what the inmates in the USA are in for (does not indicate reasons for probation and parole violations. Those offenses, such as drug tests, etc. change the breakdown of what inmates are in for).
- ↑ National Research Council. The Growth of Incarceration in the United States: Exploring Causes and Consequences. Washington, DC: The National Academies Press, 2014. Retrieved May 10, 2014: "The U.S. penal population of 2.2 million adults is by far the largest in the world. Just under one-quarter of the world's prisoners are held in American prisons."
- ↑ Seychelles. International Centre for Prison Studies.
- ↑ United States of America. International Centre for Prison Studies.
- ↑ Population Clock. U.S. Census Bureau.
- ↑ Walmsley, Roy (21 Nov 2013). World Prison Population List (tenth edition). From World Prison Population Lists. By International Centre for Prison Studies. From page 1: "Most figures relate to dates between September 2011 and September 2013." And: "More than 10.2 million people are held in penal institutions throughout the world, mostly as pre-trial detainees/remand prisoners or as sentenced prisoners."
- ↑ Canada. International Centre for Prison Studies.
- ↑ United Kingdom: England & Wales. International Centre for Prison Studies.
- ↑ Australia. International Centre for Prison Studies.
- ↑ Spain. International Centre for Prison Studies.
- ↑ Greece. International Centre for Prison Studies.
- ↑ Norway. International Centre for Prison Studies.
- ↑ Netherlands. International Centre for Prison Studies.
- ↑ Japan. International Centre for Prison Studies.
- ↑ Germany. International Centre for Prison Studies.
- ↑ Italy. International Centre for Prison Studies.
- ↑ Saudi Arabia. International Centre for Prison Studies.
- ↑ Russia. International Centre for Prison Studies.
- ↑ Kazakhstan. International Centre for Prison Studies.
- ↑ Singapore. International Centre for Prison Studies.
- ↑ Sweden. International Centre for Prison Studies.
- ↑ Jiang, Su. "Measuring Prison Population in China: A Preliminary Observation" Paper presented at the annual meeting of The Law and Society Association, Montreal, Quebec, Canada, 27 May 2008
- ↑ Wu, Harry (1 March 2010). "One on One". Radio Prague (Interview: audio). Interview with Chris Johnstone. Prague, Czech Republic: Český rozhlas 7. Retrieved 2011-04-14.
- 1 2 Walmsley, Roy (30 Jan 2009). World Prison Population List (8th Edition). From World Prison Population Lists. By International Centre for Prison Studies. "The information is the latest available in early December 2008. … Most figures relate to dates between the beginning of 2006 and the end of November 2008." According to the summary on page one there were 2.29 million U.S. inmates and 9.8 million inmates worldwide. The U.S. held 23.4% of the world's inmates. The U.S. total in this report is for December 31, 2007 (see page 3), and does not include inmates in juvenile detention facilities.
- 1 2 Correctional Populations in the United States, 2013 (NCJ 248479). Published December 2014 by U.S. Bureau of Justice Statistics (BJS). By Lauren E. Glaze and Danielle Kaeble, BJS statisticians. See PDF. See page 1 "highlights" section for the "1 in ..." numbers. See table 1 on page 2 for adult numbers. See table 5 on page 6 for male and female numbers. See appendix table 5 on page 13, for "Estimated number of persons supervised by adult correctional systems, by correctional status, 2000–2013." See appendix table 2: "Inmates held in custody in state or federal prisons or in local jails, 2000 and 2012–2013".
- ↑ One in 100: Behind Bars in America 2008. February 28, 2008. The Pew Center on the States.
- 1 2 Liptak, Adam (28 Feb 2008). 1 in 100 U.S. Adults Behind Bars, New Study Says. New York Times.
- ↑ Prisoners in 2008. (NCJ 228417). December 2009 report from the U.S. Bureau of Justice Statistics (BJS). By William J. Sabol, Ph.D. and Heather C. West, Ph.D., BJS Statisticians. Also, Matthew Cooper, BJS Intern. See PDF. Table 9 on page 8 has the number of inmates in state or federal prison facilities, local jails, U.S. territories, military facilities, U.S. Immigration and Customs Enforcement (ICE) owned and contracted facilities, jails in Indian country, and juvenile facilities (2006 Census of Juveniles in Residential Placement). See 2007 juvenile total here. Table 8 on page 8 has the incarceration rates for 2000, 2007, and 2008.
- ↑ Sickmund, M., Sladky, T.J., Kang, W., & Puzzanchera, C.. "Easy Access to the Census of Juveniles in Residential Placement". Click "National Crosstabs" at the top, and then choose the census years. Click "Show table" to get the total number of juvenile inmates for those years. Or go here for all the years. Office of Juvenile Justice and Delinquency Prevention.
- 1 2 Liptak, Adam (23 Apr 2008). Inmate Count in US Dwarfs Other Nations'. . New York Times.
- ↑ Carlen, Pat (2004). Analysing Women's Imprisonment. Portland: Willan Publishing. p. 43.
- ↑ Carlen, Pat (2004). Analysing Women's Imprisonment. Portland: Willan Publishing. p. 42.
- ↑ Rehavi and Starr (2012) "Racial Disparity in Federal Criminal Charging and Its Sentencing Consequences" Working Paper Series, no. 12-002 (Univ. of Michigan Law & Economics, Empirical Legal Studies Center)
- 1 2 Alexander, Michelle (2010). The New Jim Crow: Mass Incarceration in the Age of Colorblindness. The New Press, New York. See pages 7 and 86. ISBN 978-1-59558-643-8. Look or search inside.
- ↑ Greenberg, Jon. Kristof: U.S. imprisons blacks at rates higher than South Africa during apartheid. Politifact.
- ↑ Moore, Antonio (4 Aug 2015). Mass Incarceration's Failure: America's Bias in Arrest, Conviction and Sentencing. Huffington Post.
- ↑ Rosefielde, Steven (2007). The Russian economy: from Lenin to Putin. By Steven Rosefielde. ISBN 978-1-4051-1337-3.
- ↑ Applebaum, Anne (2003). Gulag: a history. By Anne Applebaum. ISBN 978-0-7679-0056-0.
- ↑ Solzhenitsyn, Aleksandr (1973). The Gulag Archipelago. .
- ↑ Gopnik, Adam (30 January 2012). The Caging of America. The New Yorker.
This template pertains only to agencies that handle sentenced felons (with sentences over 1-2 years). In many states pre-trial, misdemeanor, and/or those sentenced under state law with sentences of fewer than one year are in county jails instead of state prisons. | |
| Federal Bureau of Prisons | |
| State correction agencies |
|
| Federal District | Felons: Federal Bureau of Prisons, Misdemeanants: District of Columbia DOC |
| Insular Areas | |
| US state prisons | |
| |
| Science | |||||||||||||||
|---|---|---|---|---|---|---|---|---|---|---|---|---|---|---|---|
| Prisoners | |||||||||||||||
| Prisons |
| ||||||||||||||
| Culture | |||||||||||||||
| Social issues |
| ||||||||||||||
| Organizations |
| ||||||||||||||
| Leaving prison | |||||||||||||||
| Lists | |||||||||||||||
| By country | |||||||||||||||
| |||||||||||||||