Color wheel graphs of complex functions
In mathematics, a complex function is a function with the complex numbers (see the imaginary numbers and the complex plane) as both its domain and codomain. The complex color wheel method assigns a color to each point of the complex plane.
Methods


The assignment of color to complex point could be diverse, but often one of the following two:

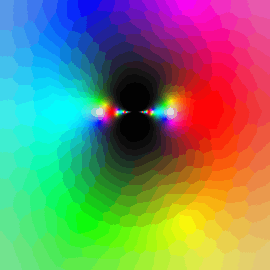
- the origin is white, 1 is red, −1 is cyan, and a point at infinity is black:

More precisely, the argument (angle) of the complex number defines the hue value while the modulus defines the light value of the color in the HLS (hue, lightness, saturation) color model; for a given (H,L) pair we choose the maximal saturation value. In both assignments, vivid colors of the rainbow are rotating in a continuous way on the complex unit circle, so the 6th roots of unity (counted from the 0th, the 1) are, according to the second definition: red, yellow, green, cyan, blue, and magenta. In addition, it is common in the assignments that the gradiations of colors belonging to two complex numbers close to each other are close to each other, and that colors of complex numbers of the same argument are gradiations of the same color – the one which has greater absolute value is lighter (according to the first definition) or darker (according to the second definition).
However, the HSL color space is not perceptually uniform, leading to streaks of perceived brightness at yellow, cyan, and magenta (even though their absolute values are the same as red, green, and blue) and a halo around L=0.5. Use of the Lab color space corrects this, making the images more accurate, but also makes them more drab/pastel.[1]
To make images comparable, it is highly recommended to use the standardised color schemes of the Digital Library of Mathematical Functions .[2]
History
The color wheel method was probably first used in publication in the late 1980s by Larry Crone and Hans Lundmark 1980s.[3]
See also
Other references
- Color wheel method
- Color Graphs of Complex Functions
- Real-Time Zooming Math Engine
- Phase Plots (MATLAB)
- Complex Function Explorer (MATLAB)
References
- ↑ example
- ↑ "Digital Library of Mathematical Functions: Continuous Phase Mapping". Retrieved 6 January 2016.
- ↑ Elias Wegert (2012). Visual Complex Functions: An Introduction with Phase Portraits. Springer Basel. p. 29. ISBN 9783034801799. Retrieved 6 January 2016.