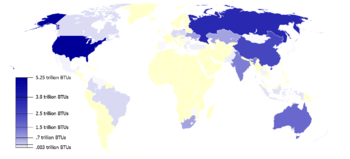
Coal by country


This article includes lists representing proven reserves and production of coal by country. All data is taken from British Petroleum.
The reserve list specifies different types of coal and includes countries with at least 0.1% share of estimated world coal reserves.
The production list includes countries with coal production close to or larger than 1 million tonnes.
By IEA the top 10 coal producers in 2011 were (Mt): China 3,576 (46%), United States 1,004 (13%), India 586 (8%), Australia 414 (5%), Indonesia 376 (5%), Russia 334 (4%), South Africa 253 (3%), Germany 189 (2%), Poland 139 (2%) and Kazakhstan 117 (2%). In 2011 total coal production was 7,783 Mt.[1]
Top coal producers in 2012 were (Mt): China 3,549, United States 935, India 595, Indonesia 443, Australia 421, Russia 354, South Africa 259, Germany 197, Poland 144 and Kazakhstan 126. In 2012 total coal production was 7,832 Mt. World coal production increased from year 2011 to 2012.[2]
Top coal producers in 2015 were (Mt): China 3,650, United States 916, India 668, Australia 491, Indonesia 471, Russia 334, South Africa 253, Germany 187, Poland 137 and Kazakhstan 115. In 2015 total coal production was 7,925 Mt.[3]
See also
See also separate lists:
- World energy consumption
- List of countries by coal proven reserves
- List of countries by coal production
- List of countries by coal exports
- List of countries by coal imports
| Proved recoverable coal reserves at end-2006 (million tonnes)[4] |
Coal production in 2007 (million tonnes)[5] | ||||||||||||||||||||||||||||||||||||||||||||||||||||||||||||||||||||||||||||||||||||||||||||||||||||||||||||||||||||||||||||||||||||||||||||||||||||||||||||||||||||||||||||||||||||||||||||||||||||||||||||||||||||||||||||||||||||||||||||||||||||||||||||||||||||||||||||||||||||||||||||||||||||||||||||||||||||||||||||||
|
|
References
- ↑ IEA Key energy statistics 2012
- ↑ Key world statistics 2013 IEA page 11 gas, page 13 oil, page 15 coal
- ↑ "Key World Energy Statistics" (PDF). iea.org. IEA. Retrieved 25 May 2016.
- ↑ "BP Statistical review of world energy June 2007". British Petroleum. June 2007. Archived from the original (XLS) on 2009-02-06. Retrieved 2007-10-22.
- ↑ "Statistical Review of World Energy 2008". British Petroleum. Archived from the original on 2008-07-27.
- ↑ Thar coal reserves can turn around Pakistani fortunes
- ↑ World coal statistics