Climate of Australia

Australia's climate is governed largely by its size and by the hot, sinking air of the subtropical high pressure belt. This moves north and south with the seasons, so that the rainfall pattern over Australia is highly seasonal. Australia's rainfall is the lowest of the seven continents (besides Antarctica). But it is variable, with frequent droughts lasting several seasons—thought to be caused in part by the El Niño-Southern Oscillation. The climate varies widely due to its large geographical size, but by far the largest part of Australia is desert or semi-arid. Only the south-east and south-west corners have a temperate climate and moderately fertile soil. The northern part of the country has a tropical climate, varied between tropical rainforests, grasslands, part desert.
Because Australia is a small continent, separated from polar regions by the Southern Ocean, it is not subject to the movements of frigid polar air that sweep over Northern Hemisphere continents during winter. Consequently, its winter is relatively mild, so that there isn't the great contrast between summer and winter temperatures there is in the northern continents. Yet in many parts of the country, seasonal highs and lows can be considerable: temperatures have ranged from above 50 °C (122 °F) to well below zero. Nonetheless, minimum temperatures are moderated.
The El Niño-Southern Oscillation is associated with seasonal abnormality in many areas in the world. Australia is one of the continents most affected and experiences extensive droughts alongside considerable wet periods. Occasionally a dust storm will blanket a region and there are reports of the occasional tornado. Tropical cyclones, heat waves, bushfires and frosts in the country are also associated with the Southern Oscillation. Rising levels of salinity and desertification in some areas is ravaging the landscape.
Climate change in Australia is a highly contentious issue. Temperatures in the country have risen following an increasing trend of global warming between the years of 1910 to 2004 by approximately 0.7 °C. Overnight minimum temperatures have warmed more rapidly than daytime maximum temperatures in recent years. The late-20th century warming has been largely attributed to the increased greenhouse effect.[1] According to the Bureau of Meteorology, 80% of the land has less than 600 mm (24 in) of rainfall per year and 50% has even less than 300 mm (12 in).[2] As a whole, Australia has a very low annual average rainfall of 419 mm (16 in).[3]
States and Territories
Australian Capital Territory

Because of its elevation (650 m (2,130 ft)) and distance from the coast, the Australian Capital Territory experiences a continental climate, unlike many other Australian cities whose climates are moderated by the sea.[4] Canberra is notorious for hot, dry summers, and cold winters with occasional fog and frequent frosts. Many of the higher mountains in the territory’s south-west are snow-covered for at least part of the winter. Thunderstorms can occur between October and March, and annual rainfall is 623 mm (25 in), with rainfall highest in spring and summer and lowest in winter
The highest maximum temperature recorded in the ACT was 42.8 °C (109.0 °F) at Acton on 11 January 1939. The lowest minimum temperature was −14.6 °C (5.7 °F) at Gudgenby on 11 July 1971.[5]
New South Wales
Over half of New South Wales has an arid or semi-arid climate. However, the eastern portion has a temperate climate, ranging from humid subtropical to the Central Coast and most of Sydney, and oceanic to the south coast. The Snowy Mountains region in the south-east falls in the alpine climate/highland climate zone, with cool to cold weather all year around and snowfalls in the winter. Further inland, the climate gets semi-arid and a desert climate towards the western part of the state.

The weather in the south of the state is generally hot in summer and cool in the winter as the seasons are well-defined in the south. The hottest New South Wales Climate region is the north-west part of the state, seasons are not well-defined in the north, where summers are hot and can be wet and winters are cooler and drier. The coldest region is the Snowy Mountains where the snow and frost continues for quite long durations during the winter months.
The highest maximum temperature recorded was 49.8 °C (121.6 °F) at Menindee in the state's west on 10 January 1939. The lowest minimum temperature was −23.0 °C (−9.4 °F) at Charlotte Pass on 29 June 1994 in the Snowy Mountains. This is also the lowest temperature recorded in the whole of Australia excluding Australian Antarctic Territory.[6]
Rainfall varies throughout the state. The far north-west receives the least, less than 180 mm (7 in) annually, while the east receives between 600 to 1,200 mm (24 to 47 in) of rain.
| City | Min. Temp | Max. Temp | No. Clear days | Rainfall |
|---|---|---|---|---|
| Broken Hill[7] | 12 °C (54 °F) | 24 °C (75 °F) | 137 | 245 mm (10 in) |
| Coffs Harbour[8] | 14 °C (57 °F) | 23 °C (73 °F) | 122 | 1,679 mm (66 in) |
| Sydney[9] | 14 °C (57 °F) | 22 °C (72 °F) | 104 | 1,222 mm (48 in) |
| Penrith[10] | 14 °C (57 °F) | 22 °C (72 °F) | 103 | 696 mm (27 in) |
| Wagga Wagga[11] | 9 °C (48 °F) | 22 °C (72 °F) | 124 | 566 mm (22 in) |
| Armidale[12] | 7 °C (45 °F) | 20 °C (68 °F) | 106 | 791 mm (31 in) |
Northern Territory
| Average monthly maximum temperature in Northern Territory | ||||
| Month | Darwin | Alice Springs | ||
|---|---|---|---|---|
| January | 31.8 °C (89.2 °F) | 36.4 °C (97.5 °F) | ||
| February | 31.4 °C (88.5 °F) | 35.1 °C (95.2 °F) | ||
| March | 31.9 °C (89.4 °F) | 32.7 °C (90.9 °F) | ||
| April | 32.7 °C (90.9 °F) | 28.2 °C (82.8 °F) | ||
| May | 32.0 °C (89.6 °F) | 23.0 °C (73.4 °F) | ||
| June | 30.6 °C (87.1 °F) | 19.8 °C (67.6 °F) | ||
| July | 30.5 °C (86.9 °F) | 19.7 °C (67.5 °F) | ||
| August | 31.3 °C (88.3 °F) | 22.5 °C (72.5 °F) | ||
| September | 32.5 °C (90.5 °F) | 27.2 °C (81.0 °F) | ||
| October | 33.2 °C (91.8 °F) | 31.0 °C (87.8 °F) | ||
| November | 33.3 °C (91.9 °F) | 33.6 °C (92.5 °F) | ||
| December | 32.6 °C (90.7 °F) | 35.4 °C (95.7 °F) | ||
| Source: Bureau of Meteorology[13][14] | ||||
The Northern Territory has two distinctive climate zones. The northern end, including Darwin, has a tropical savanna climate (Köppen Aw)[15] with high humidity and two seasons, the wet (November to April) and dry season (May to October). During the dry season nearly every day is warm and sunny, and afternoon humidity averages around 30%. There is very little rainfall between May and September. In the coolest months of June and July, the daily minimum temperature may dip as low as 14 °C (57 °F), but very rarely lower, and frost has never been recorded.
The wet season is associated with tropical cyclones and monsoon rains. The majority of rainfall occurs between December and March (the Southern Hemisphere summer), when thunderstorms are common and afternoon relative humidity averages over 70% during the wettest months. On average more than 1,570 mm (62 in) of rain falls in the north. Thunderstorms can produce spectacular lightning displays.
The central region is the desert centre of the country, which includes Alice Springs and Uluru, and is arid or semi-arid with little rain usually falling during the hottest months from October to March. Central Australia receives less than 250 mm (10 in) of rain per year.
The highest maximum temperature recorded in the territory was 48.3 °C (118.9 °F) at Finke on 1 and 2 January 1960. The lowest minimum temperature was −7.5 °C (18.5 °F) at Alice Springs on 12 July 1976.[6]
Queensland

Because of its size, there is significant variation in climate across the state. Low rainfall and hot summers are typical for the inland west, a monsoonal 'wet' season in the far north, and warm temperate conditions along the coastal strip. Inland and in southern ranges low minimum temperatures are experienced. The climate of the coastal strip is influenced by warm ocean waters, keeping the region free from extremes of temperature and providing moisture for rainfall.[16]
There are five predominant climatic zones in Queensland,[17] based on temperature and humidity:
- hot humid summer (far north and coastal)
- warm humid summer (coastal elevated hinterlands and coastal south-east)
- hot dry summer, mild winter (central west)
- hot dry summer, cold winter (southern west)
- temperate - warm summer, cold winter (inland south-east, e.g. Granite Belt)
However, most of the Queensland populace experience two weather seasons: a winter period of rather warm temperatures and minimal rainfall and a sultry summer period of hot, sticky temperatures and higher levels of rainfall.
The highest maximum temperature observed in the state is 49.5 °C (121.1 °F) at Birdsville on 24 December 1972. The temperature of 53.1 °C (127.6 °F) at Cloncurry on 16 January 1889 is not considered official; the figure quoted from Birdsville is the next highest, so that record is considered as being official.
The lowest minimum temperature is −10.6 °C (12.9 °F) at Stanthorpe on 23 June 1961 and at The Hermitage on 12 July 1965.[6]
| City | Min. Temp | Max. Temp | No. Clear days | Rainfall |
|---|---|---|---|---|
| Brisbane | 14 °C (57 °F) | 26 °C (79 °F) | 123 | 1,061 mm (42 in) |
| Mackay | 18 °C (64 °F) | 27 °C (81 °F) | 113 | 1,667 mm (66 in) |
| Cairns | 20 °C (68 °F) | 29 °C (84 °F) | 86 | 2,223 mm (88 in) |
| Townsville | 18 °C (64 °F) | 29 °C (84 °F) | n/a | 1,144 mm (45 in) |
South Australia

The majority of the state has the arid and semi-arid climates. The southern coastal parts of the state have a Mediterranean climate with mild wet winters and hot dry summers. The highest rainfall occurs along the southern coasts and the Mount Lofty Ranges (with an average annual rainfall of 1,200 millimetres (47 in) in the vicinity of Mount Lofty); the lowest rainfall occurs in the Lake Eyre basin where the average annual totals are less than 150 millimetres (6 in) and possibly even 100 millimetres (4 in). Most of the rain in the southern districts of the State fall during the winter months when the sub-tropical high-pressure belt is displaced to the north over the Australian continent.[18]
South Australia's mean temperature range is 29 °C (84 °F) in January and 15 °C (59 °F) in July. Daily temperatures in parts of the state in January and February can be up to 48 °C (118 °F). The highest maximum temperature was recorded as 50.7 °C (123.3 °F) at Oodnadatta on 2 January 1960, which is the highest official temperature recorded in Australia. The lowest minimum temperature was −8.0 °C (17.6 °F) at Yongala on 20 July 1976.[6]
Tasmania

Tasmania has a cool temperate climate with four distinct seasons. Summer lasts from December to February when the average maximum sea temperature is 21 °C (70 °F) and inland areas around Launceston reach 24 °C (75 °F). Other inland areas are much cooler with Liawenee, located on the Central Plateau, one of the coldest places in Australia with temperatures in February ranging between 4 to 17 °C (39 to 63 °F). Autumn lasts between March and May and experiences changeable weather, where summer weather patterns gradually take on the shape of winter patterns.[19]
The winter months are between June and July and are generally the wettest and coolest months in the state, with most high lying areas receiving considerable snowfall. Winter maximums are 12 °C (54 °F) on average along coastal areas and 3 °C (37 °F) on the Central Plateau, thanks to a series of cold fronts from the Southern Ocean.[20] Spring is a season of transition, where winter weather patterns begin to take the shape of summer patterns, with snowfall still common up until October. Spring is generally the windiest time of the year with afternoon sea breezes starting to take effect on the coast.
Rainfall in Tasmania follows a complicated pattern rather analogous to that found on large continents at the same latitude in the Northern Hemisphere. On the western side rainfall increases from around 1,458 mm (57 in) at Strahan on the coast up to 2,690 mm (106 in) at Cradle Valley in the highlands.[21]

There is a strong winter maximum in rainfall: January and February typically averages between 30-40% the rainfall of July and August, though even in the driest months rain usually falls on every second day and the number of rainy days per year is much greater than on any part of the Australian mainland. Further east in the Lake Country, annual rainfall declines to around 900 mm (35 in), whilst in the Midlands, annual rainfall is as low as 450 mm (18 in) at Ross and generally below 600 mm (24 in). The eastern part of Tasmania has more evenly distributed rainfall than in the west, and most months receive very similar averages.
The densely populated northern coast is much drier than the western side, with annual rainfall ranging from 666 mm (26 in) in Launceston to 955 mm (38 in) in Burnie in the north west and 993 mm (39 in) in Scottsdale located further to the east.[22][23] Most rain falls in winter, and in summer the average can be as low as 31 mm (1 in) per month in Launceston. The east coast is wetter than the Midlands, with an average annual rainfall ranging from 775 mm (31 in) in St. Helens to around 640 mm (25 in) in Swansea.[24][25] Here the rainfall is evenly distributed over the year but can be very erratic as heavy rainfalls from the warm Tasman Sea are quite frequent. Whereas a three-day fall of 125 mm (5 in) occurs only once every fifty years on the north coast, it occurs on average once every four or five years around Swansea and Bicheno, and on 7–8 June 1954, there were many falls as large as 230 mm (9 in) in two days in that area. The east coast is sometimes called the "sun coast" because of its sunny climate.[26]
Several sections of inland Tasmania, together with Flinders Island, were declared drought-affected areas by the state government in 2007.[27]
The highest recorded maximum temperature in Tasmania was 42.2 °C (108.0 °F) at Scamander on 30 January 2009, during the 2009 south-eastern Australia heat wave. Tasmania's lowest recorded minimum temperature was −13 °C (8.6 °F) on 30 June 1983, at Butlers Gorge, Shannon, and Tarraleah.[6]
| City | Min. Temp | Max. Temp | No. Clear days | Rainfall |
|---|---|---|---|---|
| Hobart[28] | 8.3 °C (46.9 °F) | 16.9 °C (62.4 °F) | 41 | 616 mm (24 in) |
| Launceston[29] | 7.2 °C (45.0 °F) | 18.4 °C (65.1 °F) | 50 | 666 mm (26 in) |
| Devonport[30] | 8.1 °C (46.6 °F) | 16.8 °C (62.2 °F) | 61 | 778 mm (31 in) |
| Strahan[31] | 7.9 °C (46.2 °F) | 16.5 °C (61.7 °F) | 41 | 1,458 mm (57 in) |
Victoria

| Average monthly maximum temperature in Victoria | ||||
| Month | Melbourne | Mildura | ||
|---|---|---|---|---|
| January | 25.8 °C (78.4 °F) | 32.8 °C (91.0 °F) | ||
| February | 25.8 °C (78.4 °F) | 32.7 °C (90.9 °F) | ||
| March | 23.8 °C (74.8 °F) | 29.3 °C (84.7 °F) | ||
| April | 20.2 °C (68.4 °F) | 24.1 °C (75.4 °F) | ||
| May | 16.6 °C (61.9 °F) | 19.6 °C (67.3 °F) | ||
| June | 14.0 °C (57.2 °F) | 16.0 °C (60.8 °F) | ||
| July | 13.4 °C (56.1 °F) | 15.4 °C (59.7 °F) | ||
| August | 14.9 °C (58.8 °F) | 17.7 °C (63.9 °F) | ||
| September | 17.2 °C (63.0 °F) | 21.1 °C (70.0 °F) | ||
| October | 19.6 °C (67.3 °F) | 25.0 °C (77.0 °F) | ||
| November | 21.8 °C (71.2 °F) | 29.0 °C (84.2 °F) | ||
| December | 24.1 °C (75.4 °F) | 31.7 °C (89.1 °F) | ||
| Source: Bureau of Meteorology | ||||
| Wikimedia Commons has media related to Climate diagrams of Victoria. |
Victoria has a varied climate despite its small size. It ranges from semi-arid and hot in the north-west, to temperate and cool along the coast. Victoria's main land feature, the Great Dividing Range, produces a cooler, mountain climate in the centre of the state.
Victoria's southernmost position on the Australian mainland means it is cooler and wetter than other mainland states and territories. The coastal plain south of the Great Dividing Range has Victoria's mildest climate. Air from the Southern Ocean helps reduce the heat of summer and the cold of winter. Melbourne and other large cities are located in this temperate region.
The Mallee and upper Wimmera are Victoria's warmest regions with hot winds blowing from nearby deserts. Average temperatures top 30 °C (86 °F) during summer and 15 °C (59 °F) in winter. Victoria's highest maximum temperature of 48.8 °C (119.8 °F) was recorded in Hopetoun on 7 February 2009, during the 2009 south-eastern Australia heat wave.[6] A screen temperature of 50.7 °C (123.3 °F) was recorded on 7 January 1906 in Mildura.[32][33]
The Victorian Alps in the north-east are the coldest part of Victoria. The Alps are part of the Great Dividing Range mountain system extending east-west through the centre of Victoria. Average temperatures are less than 9 °C (48 °F) in winter and below 0 °C (32 °F) in the highest parts of the ranges. The state's lowest minimum temperature of −11.7 °C (10.9 °F) was recorded at Omeo on 13 June 1965, and again at Falls Creek on 3 July 1970.[6]
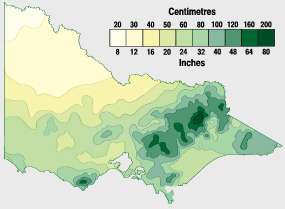
Victoria is the wettest Australian state after Tasmania. Rainfall in Victoria increases from north to south, with higher averages in areas of high altitude. Median annual rainfall exceeds 1,800 mm (71 in) in some parts of the north-east but is less than 250 millimetres (10 in) in the Mallee.
Rain is heaviest in the Otway Ranges and Gippsland in southern Victoria and in the mountainous north-east. Snow generally falls only in the mountains and hills in the centre of the state. Rain falls most frequently in winter, but summer precipitation is heavier. Rainfall is most reliable in Gippsland and the Western District, making them both leading farming areas. Victoria's highest recorded daily rainfall was 375 millimetres (14.8 in) at Tanybryn in the Otway Ranges on 22 March 1983.[6]
| Temperature and precipitation for Victoria. Source: Bureau of Meteorology, Department of Primary Industries, Australian Natural Resources Atlas | ||||||
|---|---|---|---|---|---|---|
|


Western Australia

The south-west corner of the state has a Mediterranean climate.[34] The area was originally heavily forested, including large stands of the karri, one of the tallest trees in the world. This agricultural region of Western Australia is in the top nine terrestrial habitats for terrestrial biodiversity, with a higher proportion of endemic species than most other equivalent regions. Due to the offshore Leeuwin Current, the area numbers in the top six regions for marine biodiversity, containing the most southerly coral reefs in the world.
Average annual rainfall varies from 300 mm (12 in) at the edge of the Wheatbelt region to 1,400 mm (55 in) in the wettest areas near Northcliffe, but in the months of November to March evaporation exceeds rainfall, and it is generally very dry. Plants must be adapted to this as well as the extreme poverty of all soils. A major reduction in rainfall has been observed, with a greater number of rainfall events in the summer months. The central four-fifths of the state is semi-arid or desert and is lightly inhabited with the only significant activity being mining. Annual rainfall averages about 200 to 250 mm (8 to 10 in), most of which occurs in sporadic torrential falls related to cyclone events in summer months.
An exception to this is the northern tropical regions. The Kimberley has an extremely hot monsoonal climate with average annual rainfall ranging from 500 to 1,500 mm (20 to 59 in), but there is a very long almost rainless season from April to November. Eighty-five percent of the state's runoff occurs in the Kimberley, but because it occurs in violent floods and because of the insurmountable poverty of the generally shallow soils, the only development has taken place along the Ord River.

Australia's tropical/subtropical location and cold waters off the western coast make most of Western Australia a hot desert with aridity a marked feature of a greater part of the continent. These cold waters produce precious little moisture needed on the mainland. A 2005 study by Australian and American researchers[35] investigated the desertification of the interior, and suggested that one explanation was related to human settlers who arrived about 50,000 years ago. Regular burning by these settlers could have prevented monsoons from reaching interior Australia.
Snowfall in the state is rare, and typically only in the Stirling Range near Albany, as it is the only mountain range far enough south and with sufficient elevation. More rarely, snow can fall on the nearby Porongurup Range. Snow outside these areas is a major event; it usually occurs in hilly areas of south-western Australia. The most widespread low-level snow occurred on 26 June 1956 when snow was reported in the Perth Hills, as far north as Wongan Hills and as far east as Salmon Gums. However, even in the Stirling Range, snowfalls rarely exceed 5 cm (2 in) and rarely settle for more than one day.[36]
The highest observed maximum temperature of 50.5 °C (122.9 °F) was recorded at Mardie Station on 19 February 1998. The lowest minimum temperature recorded was −7.2 °C (19.0 °F) at Eyre Bird Observatory on 17 August 2008.[6]
Precipitation

Rain
More than 80% of the continent has an annual rainfall of less than 600 mm (24 in); only Antarctica receives less rainfall than Australia.[37] A place inland near Lake Eyre (in South Australia) would only receive 81 mm (3 in) of rain annually.[38] Another place, Troudaninna Bore (29°11′44″S 138°59′28″E / 29.19556°S 138.99111°E, altitude : 46 m) in South Australia, from 1893 to 1936, received, in average, 104.9 mm (4.13 inches) of precipitation.[39] From one extreme to another, parts of the far North Queensland coast annually average over 4,000 mm (157 in), with the Australian annual record being 12,461 mm (491 in), set at the summit of Mount Bellenden Ker in 2000. There are four main factors that contribute to the dryness of the Australian landmass:
- Cold ocean currents off the west coast
- Low elevation of landforms
- Dominance of high-pressure systems
- Shape of the landmass
The average annual rainfall in the Australian desert is low, ranging from 81 to 250 mm (3 to 10 in) per year. Thunderstorms are relatively common in the region, with an average of 15 - 20 thunderstorms per annum.[40] Summer daytime temperatures range from 32 to 40 °C (90 to 104 °F). In winter, this falls to 18 to 23 °C (64 to 73 °F).
The southern parts of Australia get the usual westerly winds and rain-bearing cold fronts that come when the high pressure systems move towards northern Australia during winter. Cold snaps may bring frosts inland, though temperatures near the coast are mild or near mild all year round. Summers in southern Australia are generally dry and hot with coastal sea breezes. During a lengthy dry spell, hot and dry winds from the interior can cause bushfires in some southern and eastern states, though most commonly Victoria and New South Wales.
The tropical areas of northern Australia have a wet summer because of the monsoon. During "the wet", typically October to April, humid north-westerly winds bring showers and thunderstorms. Occasionally, tropical cyclones can bring heavy rainfall to tropical coastal regions, which is also likely to reach further inland. After the monsoonal season, the dry season comes ("winter"), which brings mostly clear skies and milder conditions.
Rainfall records tend to be concentrated along the east coast of Australia, particularly in tropical north Queensland. The highest 24‑hour rainfall on record in Australia was 907.0 millimetres (35.7 in) in Crohamhurst on the 3 February 1893.[41] The highest monthly rainfall on record was 5,387.0 millimetres (212.1 in) recorded at Mount Bellenden Ker, Queensland in January 1979.[41] The highest annual rainfall was 12,461.0 millimetres (490.6 in) recorded also at Mount Bellenden Ker in the year 2000.[41] Additionally, the location which receives the highest average annual rainfall in Australia is Babinda in Queensland with an annual average of 4,279.4 millimetres (168.5 in).[42]
Low rate of evaporation from this very cool body of water result in little evaporation occurring. Hence, rain clouds are sparsely formed and very rarely do they form long enough for a continuous period of rain to be recorded. Australia's arid/semi-arid zone extends to this region. The absence of any significant mountain range or area of substantial height above sea level, results in very little rainfall caused by orographic uplift. In the east the Great Dividing Range limits rain moving into inland Australia.
Australia has a compact shape, and no significant bodies of water penetrate very far inland. This is important inasmuch as moist winds are prevented from penetrating inland, so keeping rainfall low.[43]
Snow

In Australia, snow falls frequently on the highlands near the east coast, in the states of Victoria, New South Wales and Tasmania and in the Australian Capital Territory. There is a regular snow season in several areas which have seasonal ski tourism industries. Snow also falls with some regularity on the Great Dividing Range as far north as Stanthorpe, Queensland and in isolated parts of South Australia and Western Australia, but outside these areas, snow is an extremely rare occurrence. Snow has also fallen on Uluru and near Alice Springs on at least one occasion.
Snow at sea level is occasionally recorded on mainland Australia, but is more frequent in Tasmania where snowfalls at sea level can occur during the winter months. Snow has been recorded across most of Tasmania, though it is rare on the northern coast at sea level. Snow is rare in the southernmost capitals like Melbourne and Hobart, falling less than once every five years, and in the other capitals it is unknown (however snow has fallen in the hill suburbs of Perth and Adelaide). However, there are extensive, well-developed ski fields in the Great Dividing Range, a few hours' drive from Melbourne and Sydney.[44] Light snow generally falls every winter in Canberra, however, and other cities that may receive regular seasonal snowfalls include Orange, Lithgow and Katoomba in New South Wales.
The occasional cold snap, caused by cold air drifting north from Antarctica, can cause significant snowfall in rural areas, as well as major cities such as Hobart, Melbourne's outer mountain suburbs and Canberra. Such occasions are rare, but have occurred in 1958, 1965, 1986, 2005 and 2015, the 1965 event causing snow to fall as far north as Eungella, near Mackay in tropical Queensland.[45] Extreme snow events have also produced snow as far north-west as Longreach in Queensland and in the ranges near Alice Springs, and also in lowland towns such as Dubbo and Wagga Wagga in New South Wales. The frequency and intensity of such events has been decreasing significantly over the past 40 years and the most northerly occurrence of snow in this time frame has been the Bunya Mountains in southern Queensland.[46]
Temperatures

The tropical savannah zone of Northern Australia is warm to hot all year round. Summers are hot in most of the country with average January maximum temperatures exceeding 30°C over most areas of the mainland, except for those at high elevations though. Winters are warm in the north and cool in the south, with nightly frosts common in inland areas south of the Tropic of Capricorn. Only at the highly elevated areas do wintertime temperatures approach those found in much of Europe or North America, especially the southern parts.
Temperatures in Australia have followed an increasing trend between the years of 1910 to 2004 by approximately 0.7°C. Overnight minimum temperatures have warmed more rapidly than daytime maximum temperatures. The observed warming has hastened in recent years. The late-20th century warming has been largely attributed to the increased greenhouse effect.[47] Temperature differences between winter and summer are minor in the tropical region of Australia. However, they are greatest in the southern inland, with seasonal differences along the coast being moderated by the ocean’s proximity. In July, a more common latitudinal distribution of average maximums is apparent, ranging from 30°C near the north coast to below 3°C in the mountainous areas of the south-east.[48]
Average minimum temperatures in all seasons are highest in northern Australia and near the coastal areas, and are lowest in the elevated areas of the south-east. The highest average January minimum temperatures (near 27°C) are found near the north-west coast, while in winter they exceed 20°C at some coastal locations in northern Australia and on the Torres Strait and Tiwi Islands. In the mountains of New South Wales, it is not unusual to have average low minimum temperatures dipping below 5°C in January and -5°C in July. Comparatively, most inland (non-mountainous) areas south of the tropics have average July minimum between 0° and 6°C.
In the desert, the dry air and clear skies give rather large ranges in temperature between day and night. Ranges of 15°C being typical and 20°C not quite unusual. Light nighttime frosts in winter occur over much of the southern half of the arid zone, where mean July minimum temperatures are mostly in the 3-6°C range. Moving north, frosts become increasingly rare, with mean July minimum being around 10°C on the northern boundary.
The highest maximums in Australia are recorded in two regions, the Pilbara and Gascoyne regions of north-western Western Australia and the area extending from south-western Queensland across South Australia into south-eastern Western Australia. Many locations in this region have recorded temperatures exceeding 48°C. In January, average maximum temperatures exceed 35°C over a large area of the interior and exceed 40°C over areas in the north-west. The highest summer maximums in the Pilbara and Gascoyne average at around 41°C (in some years daily maximums consecutively exceed 40°C for several weeks at a time).
Extremes

The most powerful heatwave in the history of south-eastern Australia occurred in January 1939. Adelaide (46.1°C on the 12th), Melbourne (45.6°C on the 13th) and Sydney (45.3°C on the 14th) all had record high temperatures during this period, as did many other central district areas in New South Wales, Victoria and South Australia. The record number of consecutive days in Melbourne over 40°C is five, with Brisbane and Sydney each having two. Heatwaves usually bring by oppressively warm nights, with Oodnadatta, SA recording an Australian record of nine nights above 30°C in February 2004.[49] Another extreme event was a prolonged period of extensive heatwaves known as the Angry Summer in early 2013.
Marble Bar achieved 160 consecutive days above 37.8°C (100° Fahrenheit) in 1923-24. Nyang had an average maximum of 44.8°C for the months of February 1998 and January 2005, an Australian record. At the other extreme, average January maximums are near 15°C on the highest peaks of the south-east ranges and near 20°C in much of Tasmania. In most of the desert region during summer, cool days are rare and usually associated with major rain events - a rather exceptional example occurred in February 1949, when many areas failed to reach 20°C on one or more days, and the maximum at Boulia, western Queensland was at 14.4°C, which was 23°C below normal.
Many other locations in Australia, except those above 500 metres, have extreme maximums between 43° and 48°C. Most Tasmanian sites away from the north coast have had extreme maximums between 35° and 40°C. The lowest extreme maximums are found along the north coast of Tasmania (e.g. 29.5°C at Low Head) and at high elevations (27.0°C at Thredbo). While extreme high temperatures are more common inland than they are near the coast, notable extreme maximum have been observed near the coast; 50.5°C at Mardie, 49.1°C at Roebourne, Western Australia, 49.4°C at Whyalla and 47.9°C at Ceduna, South Australia.
At lower elevations, most inland places south of the tropics have extreme minimum between -3°C and -7°C, and these low temperatures have also occurred in locations within a few kilometres of southern and eastern coasts, such as Sale, Victoria (-5.6°C), Bega, New South Wales (-8.1°C), Grove, Tasmania (-7.5°C) and Taree, New South Wales (-5.0°C). Many locations in this region have recorded -10°C or lower, including Gudgenby in the Australian Capital Territory (-14.6°C) and Woolbrook, New South Wales (-14.5°C). In the desert, the lowest extreme minimum occur at high elevations, especially around Alice Springs, where the temperature has fallen as low as -7.5°C.
In the tropics, extreme minimum near or below 0°C have occurred at many places distant from the coast, as far north as Herberton, Queensland (-5.0°C). Some locations near tropical coasts, such as Mackay (-0.8°C), Townsville (0.1°C) and Kalumburu, Western Australia (0.3°C) have also recorded temperatures near 0°C. In contrast, some coastal locations, such as Darwin, have never fallen below 10°C, and Thursday Island, in the Torres Strait, has an extreme minimum of 16.1°C. The lowest maximum temperature on record in Australia was −6.9 °C (19.6 °F), recorded on 9 July 1978 at Thredbo Ski Resort in New South Wales.[50] The highest minimum temperature on record was 35.5 °C (95.9 °F), recorded on 24 January 1982 in Arkaroola, South Australia and again on 21 January 2003 in Wittenoom, Western Australia.[51]
A list of extremes can be found in the tables below:
| Absolute temperature ranges | ||||||
|---|---|---|---|---|---|---|
| Month | Maximum temperatures | Minimum temperatures | ||||
| °C | °F | location and date | °C | °F | location and date | |
| January | 50.7 | 123.3 |
Oodnadatta, South Australia (2 January 1960)[52] |
−7.7 | 18.1 |
Thredbo Ski Resort, New South Wales (24 January 2000)[53] |
| February | 50.5 | 122.9 | −7.0 | 19.4 |
Perisher Ski Resort, New South Wales (17 February 1979)[55] | |
| March | 47.8 | 118.0 |
Carnarvon, Western Australia (6 March 2007)/Roebourne, Western Australia (4 March 1998)[56] |
−7.2 | 19.0 |
Kiandra, New South Wales (25 March 1964)/Bullocks Flat, New South Wales (31 March 1988)[57] |
| April | 45.0 | 113.0 |
Port Hedland, Western Australia (1 April 1948)/Marble Bar, Western Australia (2 April 1928)[58] |
−13.0 | 8.6 |
Charlotte Pass, New South Wales (29 April 2009)[55] |
| May | 40.6 | 105.1 |
Bidyadanga, Western Australia (6 May 1990)[59] |
−13.4 | 7.9 |
Charlotte Pass, New South Wales (24 May 2008)[60] |
| June | 37.8 | 100.0 | −23.0 | −9.4 |
Charlotte Pass, New South Wales (29 June 1994)[62] | |
| July | 37.6 | 99.7 |
Wyndham, Western Australia (19 July 1996)[63] |
−19.6 | −3.3 |
Charlotte Pass, New South Wales (20 July 2010)[64] |
| August | 40.0 | 104.0 | −20.6 | −5.1 |
Charlotte Pass, New South Wales (14 August 1968)[66] | |
| September | 43.1 | 109.6 |
Roebuck Bay, Western Australia (27 September 2003)[65] |
−16.7 | 1.9 |
Charlotte Pass, New South Wales (20 September 1967)[67] |
| October | 46.9 | 116.4 |
Port Hedland, Western Australia (22 October 2002)[68] |
−12.0 | 10.4 |
Charlotte Pass, New South Wales (29 October 2006)[69] |
| November | 48.7 | 119.7 |
Birdsville, Queensland (17 November 1990)[70] |
−9.4 | 15.1 |
Charlotte Pass, New South Wales (26 November 1968)[71] |
| December | 49.5 | 121.1 |
Birdsville, Queensland (24 December 1972)[72] |
−9.0 | 15.8 |
Thredbo Ski Resort, New South Wales (13 December 1976)[73] |
Natural hazards and disasters
Bushfires
Climatic factors contribute to Australia's high incidence of bushfires, particularly during the summer months. Low relative humidity, wind and lack of rain can cause a small fire, either man-made or caused naturally by lightning strikes, to spread rapidly over large distances. Low humidity, the heat of the sun and lack of water cause vegetation to dry out becoming a perfect fuel for the fire. High winds fan the flames, increasing their intensity and the speed and distance at which they can travel.[74]
Many of the worst bushfires in eastern Australia, such as the 1983 Ash Wednesday fires, accompany El Niño-Southern Oscillation events which tend to cause a warm, dry and windy climate.[75] The worst bushfires in Australian history occurred on Black Saturday in February 2009. The human death toll of the disaster was 173, and over 2000 homes were lost.[76]
Flooding
Though Australia is generally dry and arid, a large portion of the country is in the tropics. Rainfall in these areas is extremely heavy. With some are areas recording world record breaking rain, such as the mountains which lie to the south west of Cairns. Through La Niña years the eastern seaboard of Australia records above average rainfall usually creating damaging floods.
The 2010–2011 La Nina system has broken many rainfall records in Australia, particularly in the states of Queensland and New South Wales, which have seen extensive flooding which has caused major damage to infrastructure and crops. The central east area of Queensland, an area the size of Germany and France combined, was under water in 2010–2011. The estimated damage bill could reach into the billions.
Some places that see heavy monthly (or yearly) rainfall include: Darwin, Cairns, Townsville, Rockhampton, Innisfail, Strahan, Queenstown, Thursday Island and Mount Read (Tasmania).
Global warming

According to climate scientists, climate change is predicted by the Commonwealth Scientific and Industrial Research Organisation (CSIRO)[77] to have significant effects on the climate of and extreme weather events in Australia, increasing temperatures and the likelihood of heat waves. According to the Bureau of Meteorology, Australia’s annual mean temperature for 2009 was 0.90 °C (1.62 °F) above the 1961-90 average, making it the nation’s second warmest year since high-quality records began in 1910.[78] Summer in both 2013 and 2014 continued this trend of record-breaking heat–2014 was Australia's third hottest year on record and 2013 broke national records.[79]
In January 2013, the Bureau of Meteorology altered its weather forecasting chart's temperature scale to include a range, coloured purple, between 52° and 54 °C.[80][81]
Coastal communities face risks from sea level rise, albeit over a long period of time based on current estimates of the IPCC Fourth Assessment Report. The Gold Coast, being built on sand and with many canal developments, could be considered particularly at risk. Suburbs of Sydney like Drummoyne and Concord on rivers like the Parramatta River face risks of inundation of low-lying areas such as parks (such as Timbrell Park and Majors Bay Reserve) reclaimed from mudflats at the heads of bays, or massive expenses in rebuilding seawalls to higher levels.
Currently, there are several environmental movements and campaigners advocating for action on climate change. One such campaign is "The Big Switch", Australia's largest community climate change campaign.[82]
New projections for Australia's changing climate includes:[83]
- droughts are likely to become more frequent, particularly in the south-west
- evaporation rates are likely to increase, particularly in the north and east
- high-fire-danger weather is likely to increase in the south-east
- sea levels will continue to rise
Drought

Drought in Australia is defined by rainfall over a three-month period being in the lowest ten percent of amounts having been recorded for that region in the past.[84] This definition takes into account that low rainfall is a relative term and rainfall deficiencies need to be compared to typical rainfall patterns including seasonal variations. Specifically drought in Australia is defined in relation to a rainfall deficiency of pastoral leases and is determined by decile analysis applied to a certain area.[85]
Historical climatic records are now sufficiently reliable to profile climate variability taking into account expectations for regions.[86] State Governments are responsible for declaring a region drought affected and the declaration will take into account factors other than rainfall.[84]
Cyclones

Australia is affected by tropical cyclones which primarily occur between December and April but have developed in November and May, as well.[87] Cyclones over mainland Australia occur on average five to six times each year.[37] The region between Broome and Exmouth are most prone to cyclones.[88] Tropical cyclones are known to bring destructive winds, heavy rain with flooding creating storm surges along the coast, causing inundation in low-lying areas. The strongest Australian region cyclone was Cyclone Monica in 2006 which had wind gusts in excess of 350 km/h (220 mph). Cyclones can also move inland, decaying to a rain depression, which dump heavy rain in these areas and causing flooding.[89]
The worst cyclones of Australia have caused billions of dollars of damage and many deaths. Cyclone Tracy crossed directly over Darwin in 1974, 71 people were killed. Adjusted for inflation it was Australia's most damaging cyclone.[90] Cyclone Mahina in 1899 brought a storm surge to Far North Queensland reaching 13 m (43 ft) high, causing 400 deaths and making it the worst natural disaster to befall Australia.[91] Cyclone Larry struck North Queensland and passed over Innisfail in 2006 causing damages estimated at A$1.5 billion but no lives were lost. Cyclone Yasi caused severe flooding and had a total estimated cost of A$3.5 billion making it the second most costliest cyclone to strike Australia.[90]
Blizzards
Blizzards are not common in mainland Australia, but occur frequently in the Snowy Mountains in New South Wales and Victoria. When blizzards do occur, they can affect the Tasmanian Highlands and, particularly, Mount Wellington, which towers over the Tasmanian capital Hobart. Blizzards do not affect any major towns or cities, because there are no populated areas located in the mountains except for the ski resort towns of New South Wales and Victoria.
Dust storms
A dust storm or sandstorm, a meteorological phenomenon common in arid and semi-arid regions, arises when a gust front passes or when the wind force exceeds the threshold value where loose sand and dust are removed from the dry surface. Particles are transported by saltation and suspension, causing soil erosion from one place and deposition in another.
The term sandstorm is used most often in the context of desert sandstorms, especially in the Sahara, when, in addition to fine particles obscuring visibility, a considerable amount of larger sand particles moves closer to the surface. The term dust storm is more likely to be used when finer particles are blown long distances, especially when the dust storm affects urban areas.
See also
| Wikimedia Commons has media related to Climate of Australia. |
References
- ↑ http://www.abs.gov.au/Ausstats/abs@.nsf/94713ad445ff1425ca25682000192af2/bbd307d0202ca25bca2570de00032610!OpenDocument#CLIMATE%20CHANGE
- ↑ Climate of Australia
- ↑ "Precipitation in Australia". Climates and Weather of Australia. Routledge. 1997. Retrieved 2012-05-07.
- ↑ "Climate of Canberra Area". Bureau of Meteorology. Retrieved 27 July 2013.
- ↑ Australian Bureau of Statistics, 2002 Yearbook of Australia. Retrieved 22 July 2007.
- 1 2 3 4 5 6 7 8 9 "Rainfall and Temperature Records: National" (PDF). Bureau of Meteorology. Retrieved 17 November 2009.
- ↑ "Broken Hill Airport Climate Statistics". Australian Government Bureau of Meteorology. Retrieved 2009-04-16.
- ↑ "Coffs Harbour Climate Statistics". Australian Government Bureau of Meteorology. Retrieved 2009-04-16.
- ↑ "Sydney (Observatory Hill) Climate Statistics". Australian Government Bureau of Meteorology. Retrieved 2009-04-16.
- ↑ "Penrith Lakes". Australian Government Bureau of Meteorology. Retrieved 2009-04-16.
- ↑ "Wagga Wagga Climate Statistics". Australian Government Bureau of Meteorology. Retrieved 2009-04-16.
- ↑ "Armidale Climate Statistics". Australian Government Bureau of Meteorology. Retrieved 2009-04-16.
- ↑ "Summary statistics Darwin Airport". Bureau of Meteorology. 2009-07-15. Retrieved 2009-07-26.
- ↑ "Summary statistics Alice Springs Airport". Bureau of Meteorology. 2009-07-16. Retrieved 2009-07-26.
- ↑ "CHAPTER 7: Introduction to the Atmosphere". physicalgeography.net. Retrieved 2008-07-15.
- ↑ Australian Government, Bureau of Meteorology - Climate of Queensland
- ↑ Australian Government, Bureau of Meteorology - Australian climatic zones
- ↑ http://www.atlas.sa.gov.au/go/resources/atlas-of-south-australia-1986/environment-resources/climate-and-weather
- ↑ "Climate of Launceston". Australian BOM. Retrieved 2009-01-01.
- ↑ "Tasmania Climate". World 66. Retrieved 2009-01-01.
- ↑ "Cradle Valley Climate". Australian Government Bureau of Meteorology. Retrieved 2009-01-01.
- ↑ "Burnie Climate". Australian Government Bureau of Meteorology. Retrieved 2009-01-01.
- ↑ "Scottsdale Climate". Australian Government Bureau of Meteorology. Retrieved 2009-01-01.
- ↑ "St Helens Climate". Australian Government Bureau of Meteorology. Retrieved 2009-01-01.
- ↑ "Swansea Climate". Australian Government Bureau of Meteorology. Retrieved 2009-01-01.
- ↑ "Climate of Tasmania". T Change. Retrieved 2009-01-01.
- ↑ "Midlands Drought area" (PDF). Tasmanian Government. Retrieved 2009-01-01.
- ↑ "Hobart Climate Statistics". Australian Government Bureau of Meteorology. Retrieved 2009-01-01.
- ↑ "Launceston Climate Statistics". Australian Government Bureau of Meteorology. Retrieved 2009-01-01.
- ↑ "Devonport Climate Statistics". Australian Government Bureau of Meteorology. Retrieved 2009-01-01.
- ↑ "Strahan Climate Statistics". Australian Government Bureau of Meteorology. Retrieved 2009-01-01.
- ↑ Hopetoun sizzles as Mildura sweats
- ↑ "City swelters, records tumble in heat". The Age. Melbourne. 7 February 2009.
- ↑ "Climate of Western Australia". Bureau of Meteorology. Archived from the original on 17 March 2009. Retrieved 6 December 2009.
- ↑ Miller G, Mangan J, Pollard D, Thompson S, Felzer B, et al. (2005) Sensitivity of the Australian Monsoon to insolation and vegetation: Implications for human impact on continental moisture balance. Geology: Vol. 33, No. 1 pp. 65–68
- ↑ Snow in Western Australia: About Snow in WA. Retrieved 4 February 2007.
- 1 2 Loffler, Ernst; Anneliese Loffler; A. J. Rose; Denis Warner (1983). Australia: Portrait of a continent. Richmond, Victoria: Hutchinson Group (Australia). pp. 37—39. ISBN 0-09-130460-1.
- ↑ "Rain". Climates and Weather of Australia. Routledge. 1997. Retrieved 2012-05-07.
- ↑ Official Year Book of the Commonwealth of Australia No.50-1964, page 48, https://books.google.com/books?id=gHgz-VKdykkC&pg=PA48
- ↑ Kuleshow, Y; de Hoedt, G; Wright, W; Brewster, A (2002). "Thunderstorm distribution and frequency in Australia" (PDF). Australian Meteorological Magazine. 51 (3): 148. ISSN 0004-9743. Retrieved 23 November 2010.
- 1 2 3 "Rainfall and Temperature Records". Climate Extremes. Bureau of Meteorology. 28 February 2013. Retrieved 26 March 2014.
- ↑ "Climate Statistics for Babinda, QL". Retrieved 26 March 2014.
- ↑ Australia - Climate of Our Continent
- ↑ https://web.archive.org/web/20100815101407/http://goanna.cs.rmit.edu.au/~jz/travel/aus/climate.html. Archived from the original on 15 August 2010. Retrieved 25 February 2011. Missing or empty
|title=(help) - ↑ Heavy snow in southern Australia, BBC News, 10 August 2005.
- ↑ , 5 June 2014
- ↑ http://www.abs.gov.au/Ausstats/abs@.nsf/94713ad445ff1425ca25682000192af2/bbd307d0202ca25bca2570de00032610!OpenDocument#CLIMATE%20CHANGE
- ↑ http://www.abs.gov.au/Ausstats/abs@.nsf/46d1bc47ac9d0c7bca256c470025ff87/BBD307D0202CA25BCA2570DE00032610?opendocument
- ↑ http://www.bom.gov.au/lam/climate/levelthree/c20thc/temp1.htm
- ↑ "Official records for Australia in July". Daily Extremes. Bureau of Meteorology. 31 July 2013. Retrieved 25 March 2013.
- ↑ "Official records for Australia in January". Daily Extremes. Bureau of Meteorology. 31 July 2013. Retrieved 25 March 2013.
- ↑ "Official records for Australia in January". Daily Extremes. Bureau of Meteorology. 31 July 2013. Retrieved 12 March 2013.
- ↑ "Official records for Australia in January". Daily Extremes. Bureau of Meteorology. 31 July 2013. Retrieved 12 March 2013.
- ↑ "Official records for Australia in January". Daily Extremes. Bureau of Meteorology. 31 July 2013. Retrieved 12 March 2013.
- 1 2 "Official records for Australia in January". Daily Extremes. Bureau of Meteorology. 31 July 2013. Retrieved 12 March 2013.
- ↑ "Official records for Australia in January". Daily Extremes. Bureau of Meteorology. 31 July 2013. Retrieved 12 March 2013.
- ↑ "Official records for Australia in January". Daily Extremes. Bureau of Meteorology. 31 July 2013. Retrieved 12 March 2013.
- ↑ "Official records for Australia in January". Daily Extremes. Bureau of Meteorology. 31 July 2013. Retrieved 12 March 2013.
- ↑ "Official records for Australia in January". Daily Extremes. Bureau of Meteorology. 31 July 2013. Retrieved 12 March 2013.
- ↑ "Official records for Australia in January". Daily Extremes. Bureau of Meteorology. 31 July 2013. Retrieved 12 March 2013.
- ↑ "Official records for Australia in January". Daily Extremes. Bureau of Meteorology. 31 July 2013. Retrieved 12 March 2013.
- ↑ "Official records for Australia in January". Daily Extremes. Bureau of Meteorology. 31 July 2013. Retrieved 12 March 2013.
- ↑ "Official records for Australia in January". Daily Extremes. Bureau of Meteorology. 31 July 2013. Retrieved 12 March 2013.
- ↑ "Official records for Australia in January". Daily Extremes. Bureau of Meteorology. 31 July 2013. Retrieved 12 March 2013.
- 1 2 "Official records for Australia in January". Daily Extremes. Bureau of Meteorology. 31 July 2013. Retrieved 12 March 2013.
- ↑ "Official records for Australia in January". Daily Extremes. Bureau of Meteorology. 31 July 2013. Retrieved 12 March 2013.
- ↑ "Official records for Australia in January". Daily Extremes. Bureau of Meteorology. 31 July 2013. Retrieved 12 March 2013.
- ↑ "Official records for Australia in January". Daily Extremes. Bureau of Meteorology. 31 July 2013. Retrieved 12 March 2013.
- ↑ "Official records for Australia in January". Daily Extremes. Bureau of Meteorology. 31 July 2013. Retrieved 12 March 2013.
- ↑ "Official records for Australia in January". Daily Extremes. Bureau of Meteorology. 31 July 2013. Retrieved 12 March 2013.
- ↑ "Official records for Australia in January". Daily Extremes. Bureau of Meteorology. 31 July 2013. Retrieved 12 March 2013.
- ↑ "Official records for Australia in January". Daily Extremes. Bureau of Meteorology. 31 July 2013. Retrieved 12 March 2013.
- ↑ "Official records for Australia in January". Daily Extremes. Bureau of Meteorology. 31 July 2013. Retrieved 12 March 2013.
- ↑ Weather and Fire, Bureau of Meteorology. Retrieved 2007-05-02.
- ↑ Australian Climate Extremes - Fire, Bureau of Meteorology. Retrieved 2007-05-02.
- ↑ "Police: Australian fires create 'a holocaust' - CNN.com". CNN. 9 February 2009. Retrieved 30 April 2010.
- ↑ CSIRO's "Climate Change Impacts on Australia and the Benefits of Early Action to Reduce Global Greenhouse Gas Emissions"
- ↑ "Annual Australian Climate Statement 2009". Australian Bureau of Meteorology. 2010-01-05. Retrieved 2010-12-22.
- ↑ "2014 was Australia's third-warmest year: BoM". ABC Online. 21 January 2015. Retrieved 31 May 2016.
- ↑ Ben Knight (8 January 2013). "Heat wave creates new Australian records". 7:30. Australian Broadcasting Corporation. Retrieved 25 April 2013.
- ↑ Peter Hannam (8 January 2013). "Temperatures off the charts as Australia turns deep purple". The Sydney Morning Herald. Fairfax Media. Retrieved 25 April 2013.
- ↑ The Big Switch, Australia's largest community climate change campaign
- ↑ New Projections For Australia's Changing Climate
- 1 2 "Drought". Climate Glossary. Bureau of Meteorology. 2006. Retrieved 2006-11-13.
- ↑ Tapper, Nigel. & Hurry, Lynn. (1993) Australia's Weather Patterns: An Introductory Guide. Pages 51—57. Dellasta. ISBN 1-875627-14-6
- ↑ "Our Natural Resources at a Glance - Climate". Department of Agriculture, Fisheries and Forestry (Australia). 2006. Archived from the original on 2006-09-19. Retrieved 2006-11-13.
- ↑ "When is the cyclone season?". Bureau of Meteorology. 2007. Retrieved 2007-05-10.
- ↑ "What is the most cyclone-prone region in Australia?". Bureau of Meteorology. 2007. Retrieved 2007-05-10.
- ↑ "Bureau-Bureau of Meteorology - Surviving Cyclones". Bureau of Meteorology. 2007. Retrieved 2007-05-10.
- 1 2 "Cyclone Yasi to cost insurers $3.5 bln - forecaster". Thomson Reuters. 3 February 2011. Retrieved 30 July 2011.
- ↑ "Australia's worst natural disasters". SBS World News Australia. Retrieved 30 July 2011.
External links
- Australian Bureau of Meteorology - Climate Information
- Interactive: 100 years of temperatures in Australia - ABC News (Australian Broadcasting Corporation)