Chesterfield County, South Carolina
| Chesterfield County, South Carolina | |||
|---|---|---|---|
| |||
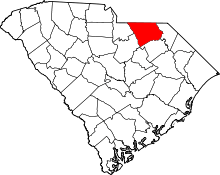 Location in the U.S. state of South Carolina | |||
 South Carolina's location in the U.S. | |||
| Founded | 1785 | ||
| Seat | Chesterfield | ||
| Largest town | Cheraw | ||
| Area | |||
| • Total | 806 sq mi (2,088 km2) | ||
| • Land | 799 sq mi (2,069 km2) | ||
| • Water | 6.7 sq mi (17 km2), 0.8% | ||
| Population (est.) | |||
| • (2015) | 46,017 | ||
| • Density | 58/sq mi (22/km²) | ||
| Congressional district | 7th | ||
| Time zone | Eastern: UTC-5/-4 | ||
| Website |
www | ||


Chesterfield County is a county located in the U.S. state of South Carolina. As of the 2010 census, its population was 46,734.[1] Its county seat is Chesterfield.[2] The county was formed in 1785, but was part of the Cheraws District until 1800, at which time Chesterfield became a district. Under the 1867 state constitution passed during the Reconstruction era, South Carolina districts became counties with home rule. It is located north of the Midlands, on its border with North Carolina.
Geography
According to the U.S. Census Bureau, the county has a total area of 806 square miles (2,090 km2), of which 799 square miles (2,070 km2) is land and 6.7 square miles (17 km2) (0.8%) is water.[3]
Adjacent counties
- Anson County, North Carolina - north
- Richmond County, North Carolina - northeast
- Marlboro County - east
- Darlington County - southeast
- Kershaw County - southwest
- Lancaster County - west
- Union County, North Carolina - northwest
National protected area
Major highways
Demographics
| Historical population | |||
|---|---|---|---|
| Census | Pop. | %± | |
| 1800 | 5,216 | — | |
| 1810 | 5,564 | 6.7% | |
| 1820 | 6,645 | 19.4% | |
| 1830 | 8,472 | 27.5% | |
| 1840 | 8,574 | 1.2% | |
| 1850 | 10,790 | 25.8% | |
| 1860 | 11,834 | 9.7% | |
| 1870 | 10,584 | −10.6% | |
| 1880 | 16,345 | 54.4% | |
| 1890 | 18,468 | 13.0% | |
| 1900 | 20,401 | 10.5% | |
| 1910 | 26,301 | 28.9% | |
| 1920 | 31,969 | 21.6% | |
| 1930 | 34,334 | 7.4% | |
| 1940 | 35,963 | 4.7% | |
| 1950 | 36,236 | 0.8% | |
| 1960 | 33,717 | −7.0% | |
| 1970 | 33,667 | −0.1% | |
| 1980 | 38,161 | 13.3% | |
| 1990 | 38,577 | 1.1% | |
| 2000 | 42,768 | 10.9% | |
| 2010 | 46,734 | 9.3% | |
| Est. 2015 | 46,017 | [4] | −1.5% |
| U.S. Decennial Census[5] 1790-1960[6] 1900-1990[7] 1990-2000[8] 2010-2014[1] | |||
2000 census
As of the census[9] of 2000, there were 42,768 people, 16,557 households, and 11,705 families residing in the county. The population density was 54 people per square mile (21/km²). There were 18,818 housing units at an average density of 24 per square mile (9/km²). The racial makeup of the county was 64.34% White, 33.22% Black or African American, 0.34% Native American, 0.30% Asian, 0.02% Pacific Islander, 1.04% from other races, and 0.75% from two or more races. 2.27% of the population were Hispanic or Latino of any race.
There were 16,557 households out of which 33.40% had children under the age of 18 living with them, 49.60% were married couples living together, 16.30% had a female householder with no husband present, and 29.30% were non-families. 25.90% of all households were made up of individuals and 10.00% had someone living alone who was 65 years of age or older. The average household size was 2.54 and the average family size was 3.05.
In the county, the population was spread out with 26.60% under the age of 18, 8.50% from 18 to 24, 29.00% from 25 to 44, 23.90% from 45 to 64, and 12.00% who were 65 years of age or older. The median age was 36 years. For every 100 females there were 93.20 males. For every 100 females age 18 and over, there were 90.00 males.
The median income for a household in the county was $29,483, and the median income for a family was $36,200. Males had a median income of $30,205 versus $20,955 for females. The per capita income for the county was $14,233. About 16.70% of families and 20.30% of the population were below the poverty line, including 24.70% of those under age 18 and 24.20% of those age 65 or over.
2010 census
As of the 2010 United States Census, there were 46,734 people, 18,173 households, and 12,494 families residing in the county.[10] The population density was 58.5 inhabitants per square mile (22.6/km2). There were 21,482 housing units at an average density of 26.9 per square mile (10.4/km2).[11] The racial makeup of the county was 62.8% white, 32.6% black or African American, 0.5% American Indian, 0.4% Asian, 2.0% from other races, and 1.6% from two or more races. Those of Hispanic or Latino origin made up 3.6% of the population.[10] In terms of ancestry, 16.3% were American, 6.8% were English, 6.0% were German, and 5.9% were Irish.[12]
Of the 18,173 households, 34.7% had children under the age of 18 living with them, 44.6% were married couples living together, 18.3% had a female householder with no husband present, 31.2% were non-families, and 27.4% of all households were made up of individuals. The average household size was 2.52 and the average family size was 3.05. The median age was 39.3 years.[10]
The median income for a household in the county was $32,979 and the median income for a family was $41,225. Males had a median income of $35,965 versus $26,881 for females. The per capita income for the county was $17,162. About 17.6% of families and 22.7% of the population were below the poverty line, including 33.6% of those under age 18 and 18.0% of those age 65 or over.[13]
Politics
In the South Carolina House of Representatives, Chesterfield County is located in South Carolina's 53rd House district and is represented by Democrat Ted Vick. In the South Carolina Senate, Chesterfield is located in Senate district 27 and represented by Democrat, and former 2010 candidate for governor, Vincent Sheheen.[14][15]
In the US House of Representatives, Chesterfield County is entirely located in South Carolina's 7th Congressional District. As of the 2012 House elections, it is represented by Republican Tom Rice, who comes from Horry County. Chesterfield County was formerly located in South Carolina's 5th Congressional District which was one of the seats that the Democrats lost to the Republicans during the 2010 election; before the 2010 election, congressman John M. Spratt had represented the district since 1983 but was defeated 55% to 45% by Republican Mick Mulvaney in 2010.
| Year | Democrat | Republican | Other |
|---|---|---|---|
| 2016[16] | 41.6% 7,125 | 55.9% 9,576 | 2.5% 427 |
| 2012 | 48.0% 7,958 | 51.2% 8,490 | 0.9% 146 |
| 2008 | 47.9% 7,842 | 50.9% 8,325 | 1.2% 192 |
| 2004 | 47.9% 6,729 | 51.6% 7,252 | 0.5% 68 |
| 2000 | 48.8% 6,111 | 50.0% 6,266 | 1.2% 149 |
| 1996 | 54.3% 5,734 | 38.1% 4,028 | 7.6% 807 |
| 1992 | 50.8% 5,691 | 37.3% 4,183 | 11.9% 1,338 |
| 1988 | 48.3% 4,699 | 51.4% 4,999 | 0.4% 37 |
| 1984 | 45.6% 4,593 | 54.1% 5,451 | 0.2% 23 |
| 1980 | 64.1% 6,393 | 34.9% 3,478 | 1.0% 101 |
| 1976 | 75.0% 7,687 | 24.8% 2,537 | 0.2% 20 |
| 1972 | 35.7% 2,938 | 63.6% 5,230 | 0.7% 61 |
| 1968 | 31.6% 3,180 | 25.5% 2,564 | 42.9% 4,324 |
| 1964 | 65.4% 4,634 | 34.6% 2,449 | 0% 0 |
| 1960 | 76.4% 4,450 | 23.6% 1,372 | 0% 0 |
Education
The county's youth are provided with an education through the Chesterfield County School District. The South Point Christian School is a private school located in Pageland and offers Kindergarten through 12th grade.
Northeastern Technical College has branches in Pageland and Cheraw.
High schools
- Central High School, Pageland
- Cheraw High School, Cheraw
- Chesterfield High School, Chesterfield
- McBee High School, McBee
Middle schools
- Chesterfield/Ruby Middle School, Chesterfield/Ruby
- Long Middle School, Cheraw
- New Heights Middle School, Jefferson
Elementary schools
- Cheraw Intermediate School, Cheraw
- Edwards Elementary School, Chesterfield
- Jefferson Elementary School, Jefferson
- McBee Elementary School, McBee
- Pageland Elementary School, Pageland
- Plainview Elementary School, Plainview
- Ruby Elementary School, Ruby
Primary schools
- Cheraw Primary School, Cheraw
- Petersburg Primary School, Pageland
Recreation
Chesterfield County features many different types of recreation. Although each town varies in its offerings, facilities such as baseball and softball fields, walking tracks, parks, and other outdoor areas are common throughout the area. Golf is extremely popular and many local courses are frequented by visitors from throughout the region. There is a lot of hunting and fishing in the swamps of the Black Creek and Lake Robinson.
Culture
Chesterfield County supports several fine arts organizations ranging from High School Marching Bands to community theatres to municipal arts commissions.
- The Central High Sound of Central
- The Cheraw Tribe Marching Band
- The Chesterfield Marching Pride
- The Spirit of McBee High Marching Band
- The Cheraw Arts Commission
- The Chesterfield Arts Commission
Communities
Towns
- Cheraw
- Chesterfield (county seat)
- Jefferson
- McBee
- Mount Croghan
- Pageland
- Patrick
- Ruby
Unincorporated communities
- Angelus
- Cash
- Middendorf
- Minden
See also
- National Register of Historic Places listings in Chesterfield County, South Carolina
- USS Chesterfield County (LST-551)
- List of counties in South Carolina
References
- 1 2 "State & County QuickFacts". United States Census Bureau. Retrieved November 22, 2013.
- ↑ "Find a County". National Association of Counties. Archived from the original on 2015-05-10. Retrieved 2011-06-07.
- ↑ "2010 Census Gazetteer Files". United States Census Bureau. August 22, 2012. Retrieved March 16, 2015.
- ↑ "County Totals Dataset: Population, Population Change and Estimated Components of Population Change: April 1, 2010 to July 1, 2015". Retrieved July 2, 2016.
- ↑ "U.S. Decennial Census". United States Census Bureau. Archived from the original on May 11, 2015. Retrieved March 16, 2015.
- ↑ "Historical Census Browser". University of Virginia Library. Retrieved March 16, 2015.
- ↑ Forstall, Richard L., ed. (March 27, 1995). "Population of Counties by Decennial Census: 1900 to 1990". United States Census Bureau. Retrieved March 16, 2015.
- ↑ "Census 2000 PHC-T-4. Ranking Tables for Counties: 1990 and 2000" (PDF). United States Census Bureau. April 2, 2001. Retrieved March 16, 2015.
- ↑ "American FactFinder". United States Census Bureau. Archived from the original on 2013-09-11. Retrieved 2011-05-14.
- 1 2 3 "DP-1 Profile of General Population and Housing Characteristics: 2010 Demographic Profile Data". United States Census Bureau. Retrieved 2016-03-09.
- ↑ "Population, Housing Units, Area, and Density: 2010 - County". United States Census Bureau. Retrieved 2016-03-09.
- ↑ "DP02 SELECTED SOCIAL CHARACTERISTICS IN THE UNITED STATES – 2006-2010 American Community Survey 5-Year Estimates". United States Census Bureau. Retrieved 2016-03-09.
- ↑ "DP03 SELECTED ECONOMIC CHARACTERISTICS – 2006-2010 American Community Survey 5-Year Estimates". United States Census Bureau. Retrieved 2016-03-09.
- ↑ http://www.scstatehouse.gov/member.php?code=1875567957
- ↑ http://www.scstatehouse.gov/member.php?code=1665908891
- ↑ http://www.politico.com/2016-election/results/map/president/south-carolina
- ↑ http://uselectionatlas.org/RESULTS/
External links
- Fact Sheet on Chesterfield County from SC State Government
- Chesterfield County Website
- 1905 Reprint of Bishop Gregg's History of the Old Cheraws with additional material as an appendix. (Google Book pdf)
 |
Union County | Anson County | Richmond County | |
| Lancaster County | |
Marlboro County | ||
| ||||
| | ||||
| Kershaw County | Darlington County |
Municipalities and communities of Chesterfield County, South Carolina, United States | ||
|---|---|---|
| Towns | | |
| Unincorporated communities | ||
| Ghost towns | ||
| Footnotes | ‡This populated place also has portions in an adjacent county or counties | |
Coordinates: 34°38′N 80°10′W / 34.64°N 80.16°W