Causes of unemployment in the United States
Causes of Unemployment in the United States discusses the causes of U.S. unemployment and strategies for reducing it. Job creation and unemployment are affected by factors such as economic conditions, global competition, education, automation, and demographics. These factors can affect the number of workers, the duration of unemployment, and wage levels.
Overview
There are a variety of domestic, foreign, market and government factors that impact unemployment in the United States. These may be characterized as cyclical (related to the business cycle) or structural (related to underlying economic characteristics) and include, among others:
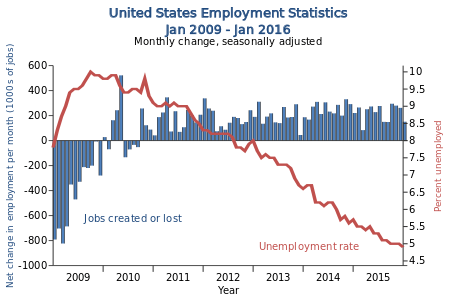
- Economic conditions: The U.S. faced the subprime mortgage crisis and resulting recession of 2007-2009, which significantly increased the unemployment rate to a peak of 10% in October 2009. The unemployment rate fell steadily thereafter, returning to 5% by December 2015 as economic conditions improved.
- Demographic trends: The U.S. has an aging population, which is moving more persons out of the labor force relative to the civilian population. This has resulted in a long-term downward trend in the labor force participation rate that began around 2000, as the Baby Boomer generation began to retire.
- Technology trends, with automation replacing workers in many industries while creating jobs in others.
- Globalization and sourcing trends, with employers creating jobs in overseas markets to reduce labor costs or avoid regulations.
- International trade policy, which has resulted in a sizable trade deficit (imports greater than exports) since the early 2000s, which reduces GDP and employment relative to a trade surplus.
- Immigration policy, which affects the nature and number of workers entering the country.
- Monetary policy: The Federal Reserve conducts monetary policy, adjusting interest rates to move the economy towards a full employment target of around a 5% unemployment rate and 2% inflation rate. The Federal Reserve has maintained near-zero interest rates since the 2007-2009 recession, in efforts to boost employment. It also injected a sizable amount of money into the economy via quantitative easing to boost the economy. In December 2015, it raised interest rates for the first time moderately, with guidance that it intended to continue doing if economic conditions were favorable.
- Fiscal policy: The Federal government has reduced its budget deficit significantly since the 2007-2009 recession, which resulted from a combination of improving economic conditions and recent steps to reduce spending and raise taxes on higher income taxpayers. Reducing the budget deficit means the government is doing less to support employment, other things equal.
- Unionization: The ratio of persons represented by unions has fallen consistently since the 1960s, weakening the power of labor (workers) relative to capital (owners). This is due to a combination of economic trends and policy choices.[3]
Domestic factors
There are many domestic factors affecting the U.S. labor force and employment levels. These include: economic growth; cyclical and structural factors; demographics; education and training; innovation; labor unions; and industry consolidation. Ben Bernanke discussed several factors during a March 2012 speech.[4]
Economist Laura D'Andrea Tyson wrote in July 2011: "Like many economists, I believe that the immediate crisis facing the United States economy is the jobs deficit, not the budget deficit. The magnitude of the jobs crisis is clearly illustrated by the jobs gap—currently around 12.3 million jobs. That is how many jobs the economy must add to return to its peak employment level before the 2008-9 recession and to absorb the 125,000 people who enter the labor force each month. At the current pace of recovery, the gap will be not closed until 2020 or later." She explained further that job growth between 2000 and 2007 was only half what it had been in the preceding three decades, pointing to several studies by other economists indicating globalization and technology change had highly negative effects on certain sectors of the U.S. workforce and overall wage levels.[5]
Cyclical vs. structural unemployment
There is ongoing debate among economists regarding the extent to which unemployment is cyclical (i.e., temporary and related to economic cycles, and therefore responsive to stimulus measures that spur demand) or structural (i.e., longer-term and independent of the economic cycle, and therefore requiring process reforms and re-allocation of workers among industries and geographies).[6]
For example, a general reduction in employment across multiple industries would likely be cyclical, while a skills or geographic mismatch for available jobs would be structural. Ben Bernanke stated in November 2012: "[T]he slow pace of employment growth has been widespread across industries and regions of the country. That pattern suggests a broad-based shortfall in demand rather than a substantial increase in mismatch between available jobs and workers, because greater mismatch would imply that the demand for workers would be strong in some regions and industries, not weak almost across the board. Likewise, if a mismatch of jobs and workers is the predominant problem, we would expect to see wage pressures developing in those regions and industries where labor demand is strong; in fact, wage gains have been quite subdued in most industries and parts of the country."[7]
The Congressional Research Service summarized a variety of studies that indicated changes in unemployment between 2007 and 2010 were 65-80% cyclical, thus mainly due to reduced aggregate demand for goods and services. Labor mobility was not a key issue due to the widespread nature of job losses across geographies and industries. Cyclically sensitive industries such as manufacturing and construction had the most significant job losses. One study referenced in the CRS research indicated that long-term unemployment can convert cyclical to structural unemployment through loss of skills.[8]
Mohamed El-Erian wrote in May 2011: "Unemployment must be seen as much more than a cyclical problem; it's a structural one that requires concurrent progress on job retraining, housing reform, education, social safety nets and private-sector competitiveness...America's political parties must jointly agree [to make] progress on the structural-reform agenda..."[9][10] Several tools, such as the Beveridge curve are used to help analyze the extent of structural unemployment.[11]
The term frictional unemployment refers to the period when workers are searching for a job or changing jobs. It is sometimes called search unemployment and can be voluntary based on the circumstances of the unemployed individual. Frictional unemployment is always present in an economy, so the level of involuntary unemployment is properly the unemployment rate minus the rate of frictional unemployment.
The Natural rate of unemployment refers to the rate of unemployment due to structural or supply-side factors alone. Cyclical factors, such as government stimulus or austerity policies, cause the actual unemployment rate to vary around the natural rate. Economists debate the natural rate of unemployment. During February 2011, Federal Reserve economists estimated it may have increased from the historical rate of around 5% to as high as 6.7%. CBO estimated the rate of a closely related measure called NAIRU at 5.2%, up from 4.8%.[12][13]
Demographics and labor force participation rate


Demographics have a significant impact on the labor force and therefore employment statistics. The U.S. population is aging and the Baby Boomers are moving into retirement, so a greater share of the population is either leaving the labor force (retired) or moving into an age bracket with a lower typical labor force participation (LFP) rate.[14][15][16]
There are two primary measures of labor force participation:
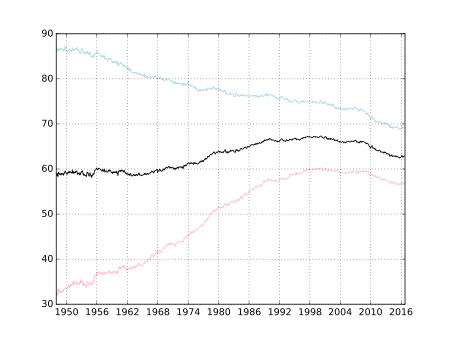
- Labor force relative to civilian population: This measure peaked in 2000 and has declined steadily for the most part since, flattening during the housing bubble (2004-2007) then falling since the 2007-2009 recession. The gradual decline is indicative of a primary demographic effect, with a secondary effect of the 2007-2009 recession on the trend.
- Employment relative to civilian population: This measure also peaked in 2000 and fell during the 2001 recession, recovered during the housing bubble, then fell dramatically during the 2007-2009 recession and has stabilized thereafter. It has fallen significantly in each of the past three recessions. This trend is indicative of a primary effect from the recession and secondary effect of demographics.
Reasons for the decline in labor force participation vary. One Federal Reserve economist estimated that demographics accounted for two-thirds of the decline since 2000. Other Federal Reserve studies place the blame primarily on the recession of 2008-2009.[17][18]
For example, a Federal Reserve study reported in October 2013 that: "The BLS lists the following factors as primary drivers of the decline in the LFP rate since 2000: (1) the aging of the baby boomer cohort; (2) the decline in the participation rate of those 16-24 years old; (3) the declining LFP rate of women (since its peak in 1999), and (4) the continuous decline of the LFP rate of men (since the 1940s). The main factors that keep the aggregate LFP rate from falling further are the increase of the LFP rate of those 55 and older and the strong attachment to the labor force of Hispanic and Asian people, who constitute the main share of the immigrant population."[19]
A 2014 White House Council of Economic Advisers report concluded that for the 3.1 percentage point reduction in the labor force to population ratio from 2007-2013, 1.6 points was due to retirements, 0.5 points was due to the recession, and the remainder was not clearly determined and may be the result of several factors, such as more students staying in school rather than entering the workforce.[20][21]
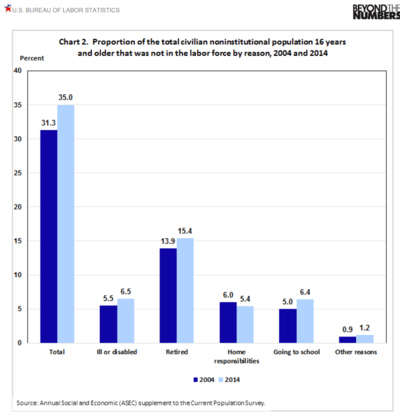
The U.S. Bureau of Labor Statistics reported in December 2015 the reasons given by persons surveyed for not working. There was a higher percentage of the civilian workforce in the age 55-64 and 65+ age groups in 2014 versus 2004, which historically have lower labor force participation as these persons are often retired. Overall, a greater percentage of persons in 2014 versus 2004 were ill or disabled, retired, or going to school. For example, the percentage of those going to school had increased by 13.4% in the age 16-19 year group, and by 6.2% in the age 20-24 year group.[22]
Economists at the Federal Reserve Bank of Atlanta reported in April 2016 that changes in the labor force participation rate reflect both aging (demographic) and behavioral aspects. They estimated the demographic effect was responsible for about half the 3.4 percentage point decline between 2007-2015. However, the behaviors contributing to the remainder changed when measuring components of the 1.9 percentage point decline from 2007-2011 and the 1.5 percentage point decline from 2011-2015. Those persons wanting a job (who were still considered outside the workforce due to not actively searching for employment) contributed 0.7 percentage points to the decline 2007-2011, but actually offset the decline from 2011-2015, indicating improving labor market conditions. From 2007-2015, later retirement was another factor offsetting the decline, while disability, more youth in school, and prime age workers not wanting a job contributed to the decline.[23]
Analyzing the 25-54 prime working age range can help correct for the effects of aging Boomers leaving the workforce. The jobs created since the end of the recession (2009) have not been sufficient to show a significant improvement in employment for the 25-54 age range.[24] In the 16-64 age range, from mid-2008 to March 2013 the ratios of employed men and women have declined by approximately 6 and 3 percentage points, respectively.[25]
The Hamilton Project reported in March 2012 that: "As the Baby Boomers retire, immigration flows change, and the number of young people entering the labor force declines, the number of new jobs needed to maintain pre-recession employment norms will decline...One result of this aging of the population is that overall labor force participation rates (and therefore the number of new jobs required to keep up with the labor force) are expected to decline."[26][27]
The Bureau of Labor Statistics provides a monthly employment situation summary. For June 2014: "Among the major worker groups, the unemployment rates for adult women (5.3 percent) and blacks (10.7 percent) declined in June, and the rate increased for teenagers (21.0 percent). The rates for adult men (5.7 percent), whites (5.3 percent), and Hispanics (7.8 percent) showed little change. The jobless rate for Asians was 5.1 percent (not seasonally adjusted), little changed from a year earlier. The number of long-term unemployed (those jobless for 27 weeks or more) declined by 293,000 in June to 3.1 million; these individuals accounted for 32.8 percent of the unemployed. Over the past 12 months, the number of long-term unemployed has decreased by 1.2 million."[28]
Education and training
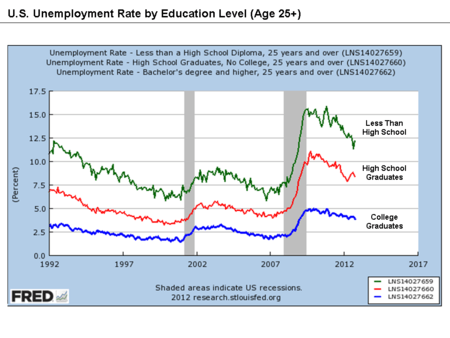

Workers with higher levels of education face considerably lower rates of unemployment. As of September 2012, for workers of age 25 or older, unemployment was approximately: 12% for those with less than a high school diploma; 9% for high school graduates; 6% for those with some college or an associate degree; and 4% for those with a bachelor's degree or higher.[30]
The Pew Research Center estimated in 2012 that the average college graduate earns as much as $650,000 more than the average high school graduate over the course of a 40-year career, roughly $1.4 million versus $770,000. Factoring in the cost of college and foregone investment income, the average college graduate still ends up an estimated $550,000 ahead. This difference depends significantly on the type of major and type of employment.[31]
The American Enterprise Institute reported in September 2011 that: "...the evidence that the quality of a nation's education system is a key determinant of the future growth of its economy is increasingly strong." In 2010, America's high-school graduation rate trailed the average for European Union countries and ranked no better than eighteenth among the 26 OECD countries for which comparable data was available. President Obama often has stated that education is a key driver of international competitiveness and employment.[32]
U.S. companies cut employee training programs approximately 11% in 2008 and again in 2009 in an effort to cut costs during the 2008-2009 recession, but increased their training costs thereafter.[33] According to 2012 Society for Human Resource Management (SHRM) industry survey, 63% of employees learn the skills required to do their job while on the job. Approximately 38% of companies said they cross-train employees to develop skills not directly related to their job, down from 43% in 2011 and 55% in 2008. Some companies believe that with high unemployment, they can find the skills necessary should job openings arise.[34]
A variety of experts have proposed education reforms to improve U.S. competitiveness. Ideas relate to better qualified and incentivized teachers, less reliance on standardized testing, better feedback systems to help struggling teachers and students, more investment, paying for performance, employing data systems that track how much a child learns from a teacher, measuring teacher quality, giving local administrators the ability to manage staff and finances, and comparing results to the best education systems in the world.[35]
The rapid pace of technology change and global competition are rewarding those who continuously improve their skills and education. Futurist Alvin Toffler wrote: "The illiterate of the future are not those that cannot read or write. They are those that cannot learn, unlearn, relearn."[36]
Thomas L. Friedman wrote: "How [can workers] adapt? It will require more individual initiative. We know that it will be vital to have more of the 'right' education than less, that you will need to develop skills that are complementary to technology rather than ones that can be easily replaced by it and that we need everyone to be innovating new products and services to employ the people who are being liberated from routine work by automation and software. The winners won't just be those with more I.Q. It will also be those with more P.Q. (passion quotient) and C.Q. (curiosity quotient) to leverage all the new digital tools to not just find a job, but to invent one or reinvent one, and to not just learn but to relearn for a lifetime."[37]
Skills gap
A "skills gap" would exist if employers were demanding skills that the workforce did not provide. The hypothesis of such a gap in the USA recently grew stronger, in part due to the poor results of the country at OECD adult skills survey.[38] However, there was limited evidence post-2008 crisis that the U.S. was really facing a skill gap. Unemployment remained higher for workers at all education levels. Further, workers with the "right" skills would theoretically receive significant raises if there were skills shortages, which was not occurring. Paul Krugman wrote in March 2014: "Meanwhile, multiple careful studies have found no support for claims that inadequate worker skills explain high unemployment." He continued that a U.S. skills gap was a "zombie idea...an idea that should have been killed by evidence, but refuses to die."[39]
Long-term unemployment
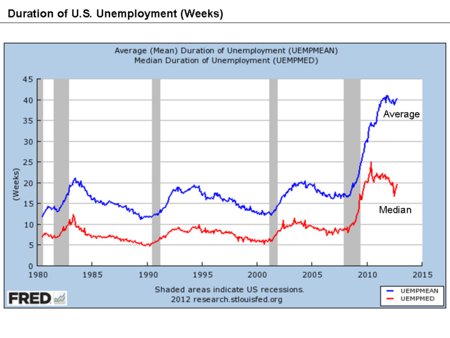
Long-term unemployment is defined by the International Labor Organization (ILO) as referring to people who have been unemployed for 27 weeks or longer and are actively seeking employment. Other measurements have been used by different Bureaus and Agencies worldwide. The U.S. Bureau of Labor Statistics classifies unemployment based on various aspects into six groups (U1-U6), with U3 referring to the most widely recognized, ILO definition.
The ratio of long-term unemployed (27 weeks or longer) to unemployed rose from 17.3% in December 2007 (pre-recession) to a peak of 48.1% during April 2010. It has steadily fallen to a still elevated 30.4% as of June 2014.[40][41] This is well above the 1980-2007 average of approximately 16% and the approximately 20-25% level typical in previous recessions since 1980.[42][43]
Economists believe that long-term unemployment can be transformed into structural unemployment, meaning that a large group of workers may no longer match employers' needs or are no longer considered employable. Skills may become obsolete, business contact lists become outdated, and current industry information is lost. As of September 2012, about 800,000 workers wanted a job but had given up looking, and so are no longer even counted as unemployed.[44]
About 1.7 million people joined the disability rolls since the recession began at the end of 2007, an increase of 24%, as workers use the disability program as a backdoor safety net when their unemployment insurance runs out. After searching for a new position for a year, a worker trying to regain employment finds that their chance to do so in the coming month falls below 10%. Job training programs and incentives for companies to hire the long-term unemployed are among the solutions available, but gathering the political will to address an isolated group is difficult. The long-term unemployed are less likely to vote.[44]
CBO reported several options for addressing long-term unemployment during February 2012. Two short-term options included policies to: 1) Reduce the marginal cost to businesses of adding employees; and 2) Tax policies targeted towards people most likely to spend the additional income, mainly those with lower income. Over the long-run, structural reforms such as programs to facilitate re-training workers or education assistance would be helpful.[45]
Labor unions

Economist Paul Krugman wrote that historically, worker participation in labor unions gave workers more power in negotiating how corporate profits were split up with shareholders and management. Organized labor acted to limit layoffs. Strong labor unions were a check on executive pay, keeping top executive pay at considerably lower ratios relative to the average worker during the 1950s than during the 2000s. Unions were also a factor in income equality, helping ensure that middle class worker pay rose along with the pay of the higher income brackets.[46]
However, labor union participation rates have declined steadily in the United States. According to the Bureau of Labor Statistics annual Union Members Summary: "In 2012, the union membership rate--the percent of wage and salary workers who were members of a union--was 11.3 percent, down from 11.8 percent in 2011. The number of wage and salary workers belonging to unions, at 14.4 million, also declined over the year. In 1983, the first year for which comparable union data are available, the union membership rate was 20.1 percent, and there were 17.7 million union workers."[47] In 1973, the participation rate was 26.7% against a comparable 2011 rate of 13.1%.[48]
Differences in labor law and public policy are a key reason for this decline. For example, Canada has gone through many of the same economic and social changes as the U.S. since the middle of the 20th century, but it hasn't seen the same substantial decline in unionization. The unionization rate in the U.S. and Canada followed fairly similar paths from 1920 to the mid-1960s, at which point they began to diverge drastically, with Canada remaining around 30% while the U.S. fell to around 11%.[49]
Industry consolidation
Industry consolidation or concentration refers to fewer, larger firms driving competition in an industry versus more, smaller firms. Job creation by small businesses can be restricted when larger, more productive firms displace them. For example, the share of customer deposits held by the top 10 largest U.S. banks rose from 15% in 1993, to 44% in 2006, and to 49% by 2009. The number of commercial banks fell from over 14,000 in 1984 to approximately 7,000 by 2010.[50]
Economists Barry Lynn and Phillip Longman at the New America Foundation wrote in March 2010:
- "It is now widely accepted among scholars that small businesses are responsible for most of the net job creation in the United States. It is also widely agreed that small businesses tend to be more inventive, producing more patents per employee, for example, than do larger firms. Less well established is what role concentration plays in suppressing new business formation and the expansion of existing businesses, along with the jobs and innovation that go with such growth. Evidence is growing, however, that the radical, wide-ranging consolidation of recent years has reduced job creation at both big and small firms simultaneously."
- "In nearly every sector of our economy, far fewer firms control far greater shares of their markets than they did a generation ago. Indeed, in the years after officials in the Reagan administration radically altered how our government enforces our anti-monopoly laws, the American economy underwent a truly revolutionary restructuring. Four great waves of mergers and acquisitions—in the mid-1980s, early '90s, late '90s, and between 2003 and 2007—transformed America's industrial landscape at least as much as globalization."
- "Over the same two decades, meanwhile, the spread of mega-retailers like Wal-Mart and Home Depot and agricultural behemoths like Smithfield and Tyson's resulted in a more piecemeal approach to consolidation, through the destruction or displacement of countless independent family-owned businesses."[51][52]
Income and wealth inequality
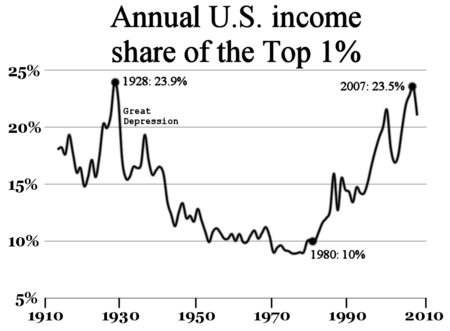
Since the 1980s, wealthier households in the United States have earned a larger and larger share of overall income. As of 2010, the top 1% of households by income earned about one-sixth of all income and the top 10% earned about half of it. In other words, the rising tide of economic growth does not lift all boats equally. Wealth is also skewed, with the top 1% owning more wealth than the bottom 90% of households. Several prominent economists and financial entities have reported that income inequality hurts economic growth and can be economically destabilizing.[54][55]
Economist Joseph Stiglitz wrote in 2012 that moving money from the bottom to the top of the income spectrum through income inequality lowers consumption, and therefore economic growth and job creation. Higher-income individuals consume a smaller proportion of their income than do lower-income individuals; those at the top save 15-25% of their income, while those at the bottom spend all of their income.[56][57]
Further, as income skews to the top, middle-class families may go deeper into debt than they would otherwise, which restricts consumption once they begin to repay it. Evidence suggests that income inequality has been the driving factor in the growing household debt[58][59] as middle income earners go deeper into debt trying to maintain what once was a middle class lifestyle. Between 1983 and 2007, the top 5 percent saw their debt fall from 80 cents for every dollar of income to 65 cents, while the bottom 95 percent saw their debt rise from 60 cents for every dollar of income to $1.40.[58] Economist Paul Krugman has found a strong correlation between inequality and household debt in America over the last hundred years.[60]
Government hiring trends
Most states have balanced budget rules, which forced them to cut spending when tax revenues fell due to the 2008-2009 recession and its aftermath. Over 500,000 jobs were cut by states and municipalities between 2008-2012. This was different from other recent U.S. recessions, where government employment continued to climb. This trend is expected to reverse in 2013, with states and municipalities adding workers for the first time in five years. State and local government spending accounted for 12% GDP in 2011.[61]
Fed Chair Ben Bernanke testified in May 2013 that: "Notably, over the past four years, state and local governments have cut civilian government employment by roughly 700,000 jobs, and total government employment has fallen by more than 800,000 jobs over the same period. For comparison, over the four years following the trough of the 2001 recession, total government employment rose by more than 500,000 jobs."[62]
Government spending employs private sector workers in several industries, such as ship and boat building, facilities services, aerospace, etc. The 2013 sequester has significantly impacting hiring in these industries, which are lagging employment growth in other industries. The New York Times reported in June 2013 that: "Across the five industries that are most sensitive to changes in military spending, employment fell at an annual rate of 2.5 percent in March and stayed flat in April, the latest month for which seasonally adjusted data are available. In all other sectors, by contrast, employment grew at annualized rates of about 1.6 percent in March and 1.7 percent in April. Before the start of the sequester on March 1, employment at private companies heavily dependent on military spending had been more closely tracking employment in the rest of the economy, though the numbers were somewhat uneven. Military payrolls have been declining almost every month since November 2011 in response to the drawdown in American wars abroad."[63]
Policies regarding full employment

Jared Bernstein wrote in May 2013 that the U.S. used to focus on full employment as a policy priority, but this focus has waned since 1980. Full employment refers to having an available job for everyone who wants one. Specific laws were passed to help achieve this goal, such as the Employment Act of 1946 and the Humphrey-Hawkins Full Employment Act of 1978. From 1945-1979, the U.S. was at full employment two-thirds of the time. Conservatives and business interests pushed back however, as tight labor markets meant more worker bargaining power, higher wages and less profitability. Since 1980, full employment ("defined as an unemployment rate below 5 percent") has been maintained one-third of the time.[64]
Bernstein argued there are several possible reasons for the reduction in frequency of full employment:
- As labor unions weakened, politicians focused less on the working class and more on issues related to the wealthy, such as inflation, budget deficits and tax policy;
- Capital investment may have become more "labor saving," with productivity improving and automation accelerating;
- Large and persistent trade deficits have exported significant demand. Trade deficits averaged 5% GDP during the 2000s, versus 1% GDP in the 1990s, representing the loss of millions of jobs; and
- Growing income inequality has reduced the ability of the middle class to demand as many goods and services as it otherwise would be, affecting many middle-class jobs.[64]
Unemployment among younger workers
The employment situation from 2009 to 2013 was particularly difficult for younger workers. The Economic Policy Institute reported in April 2013 that:
- The March 2013 unemployment rate of 16.2% for workers under age 25 was slightly over twice the national average.
- Weak demand for goods and services is the primary driver of this unemployment, not a skills mismatch.
- Graduating in a bad economy has long-lasting economic consequences. For the next 10 to 15 years, those in the Class of 2013 will likely earn less than if they had graduated when the economy were at its potential.
- For young high school graduates, the unemployment rate is 29.9% (compared with 17.5% in 2007) and the underemployment rate is 51.5% (compared with 29.4% in 2007).
- For young college graduates, the unemployment rate is 8.8% (vs. 5.7% in 2007) and the underemployment rate is 18.3% (vs. 9.9% in 2007).[65]
Job openings relative to unemployed
The ratio of job seekers to job openings is another indicator used to analyze unemployment trends. The number of unemployed persons per job opening rose from 2.9 in 2003 to 6.7 at its peak in July 2009, before falling to 3.1 in April 2013. EPI reported in June 2013 that: "In today's economy, unemployed workers far outnumber job openings in every sector...This demonstrates that the main problem in the labor market is a broad-based lack of demand for workers—and not, as is often claimed, available workers lacking the skills needed for the sectors with job openings."[66][67] However, recent trends have shown a slow decline in unemployment due to changes in the environment; financing is essential from promoting sustainable development according to the UN.[68]
Trends in alternative (part-time) work arrangements
There is a trend towards more workers in alternative (part-time or contract) work arrangements rather than full-time; the percentage of workers in such arrangements rose from 10.1% in 2005 to 15.8% in late 2015.[69] Economists Lawrence F. Katz and Alan B. Krueger wrote in March 2016 that this implies all of the net employment growth in the U.S. economy (9.1 million jobs between 2005 and 2015) occurred in alternative work arrangements, while the number in traditional jobs slightly declined. Katz and Krueger defined alternative work arrangements as "temporary help agency workers, on-call workers, contract company workers, and independent contractors or free-lancers."[70]
The share of workers in full-time positions fell from 83.1% in December 2007 to 79.9% in January 2010, due to a combination of the subprime mortgage crisis and other factors. It has steadily recovered towards 81.6% as of April 2016, but still remains below the pre-crisis level.[71]
Global factors
Offshoring of employment
Offshoring has become an increasingly common practice of locating jobs in low-cost labor countries. The practice is expanding in both manufacturing and service jobs. Motivation varies; labor cost savings or "labor arbitrage", productivity and regulatory avoidance are potential reasons. Studies have shown that offshoring is a source of significant uncertainty in the labor force. There is significant debate regarding the extent to which this is affecting U.S. job creation. The Congressional Research Service reported a summary of several studies on offshoring in January 2011:[72]
- Forrester Research projected in 2004 that a total of 3.4 million service sector jobs might move abroad by 2015. Forrester projected that a total of 1.2 million services jobs might be relocated offshore between 2003 and 2008.
- Economists Bardhan and Kroll estimated in 2003 that more than 14 million jobs, representing about 11% of U.S. employment in 2001, have attributes that could allow them to be sent overseas (e.g., no in-person customer servicing required; an IT-enabled work process that can be accomplished via telecommuting; jobs that can be routinized; a fairly wide gap between a job's pay in the United States compared to in a destination country; and a destination country having few language, institutional, and cultural barriers.)
- Economists Jensen and Kletzer estimated in 2005 that about 9.4% of total U.S. employment in 2000 was in offshorable industries. Approximately 14% of employment in professional services industries might be vulnerable to offshoring compared to 12.4% of employment in manufacturing industries.
- The Brookings Institution estimated in 2007 that offshoring may impact 2.2% of the jobs in 246 metro areas.
- The Bureau of Labor statistics estimated that one-fifth of U.S. workers were in industries subject to offshoring. The 33 service-providing occupations found to be most susceptible to offshoring experienced below average employment and wage growth during the 2001-2007 period. The skills and education of this most vulnerable group range widely.
- Economist Alan Blinder estimated in 2009 that up to 30 million jobs may be offshorable.[72]
An estimated 750,000 call center jobs were off-shored by U.S. firms to India and the Philippines as of November 2011.[73] The New York Times reported in January 2012 that: "Apple employs 43,000 people in the United States and 20,000 overseas...Many more people work for Apple's contractors: an additional 700,000 people engineer, build and assemble iPads, iPhones and Apple's other products. But almost none of them work in the United States."[74] An estimated 300,000 furniture jobs were offshored to Asia during the 2000s. Across all industries, 63,300 American factories were closed between 2001 and 2012.[75]
Princeton economist Alan Blinder said in 2007 that the number of jobs at risk of being shipped out of the country could reach 40 million over the next 10 to 20 years, which represents one out of every three service sector jobs.[76]
The Economist reported in January 2013 that: "High levels of unemployment in Western countries after the 2007-2008 financial crisis have made the public in many countries so hostile towards off-shoring that many companies are now reluctant to engage in it." Further, The Economist reported that off-shoring trends are evolving for several other reasons:
- Wages in China and India have been increasing for 10-20% a year for the past decade while U.S. wages have been relatively stagnant, reducing the cost advantage of off-shoring.
- Shipping costs are rising and long shipping lead times can affect customer service in certain industries.
- Separating production and research & development functions has adversely impacted innovation.
- Multinational corporations are moving production closer to their target customers, which in some cases means back to the U.S.[77]
The Department of Labor's Employment and Training Administration (ETA) prepares an annual report on those petitioning for trade adjustment assistance, due to jobs lost from international trade. This represents a fraction of jobs actually off-shored and does not include jobs that are placed overseas initially or the collateral impact on surrounding businesses when, for example, a manufacturing plant moves overseas. During 2014, there were approximately 68,000 workers covered by petitions filed with ETA.[78] During 2011, there were 98,379 workers covered by petitions filed with ETA.[79] The figure was 280,873 in 2010,[80] 201,053 in 2009 and 126,633 in 2008.[81]
Comparative international wage levels

One of the reasons for off-shoring jobs or sourcing goods overseas has been considerably lower wages in developing or Asian countries. The NY Times reported in December 2012 that: "American wages are [not] anywhere close to those in countries in East Asia or other places where American imports come from. As of 2010 (the latest year available), hourly compensation costs for manufacturing in the United States were about four times those in Taiwan, and 20 times those in the Philippines, according to the Labor Department." However, foreign wages have been rising since 2000, while those in the U.S. have been stagnant.[83]
During 2011, entry level call center workers in the U.S. earned about $20,000 per year, about six times as much as similar jobs in India.[73] According to the Congressional Research Service, during 2006, compensation for the average American production worker was $24.59 per hour, compared to $16.02 in South Korea, $2.92 in Mexico, and $0.81 in China.[84]
CEO's are under pressure from their boards to maximize profits and are paid bonuses accordingly; one method of doing so is offshoring jobs or sourcing inputs in the lowest wage countries possible. Firms in low-cost labor countries actively lobby U.S. and European companies to offshore a variety of jobs or locate new jobs and facilities overseas.[85]
Trade deficits and currency valuation

Trade deficit
Net exports are a major component of GDP. In the U.S., net exports are negative due to a trade deficit that is much larger than historical average. There is significant debate regarding the impact of the trade deficit on the economy and employment, and therefore the budget deficit. For example, The Economist wrote in July 2012 that the inflow of investment dollars required to fund the trade deficit was a major cause of the housing bubble and financial crisis: "The trade deficit, less than 1% of GDP in the early 1990s, hit 6% in 2006. That deficit was financed by inflows of foreign savings, in particular from East Asia and the Middle East. Much of that money went into dodgy mortgages to buy overvalued houses, and the financial crisis was the result."[86]
NPR explained in their Peabody Award-winning article "The Giant Pool of Money" that a vast inflow of savings from developing nations flowed into the mortgage market, driving the U.S. housing bubble. This pool of fixed income savings increased from around $35 trillion in 2000 to about $70 trillion by 2008. NPR explained this money came from various sources, "[b]ut the main headline is that all sorts of poor countries became kind of rich, making things like TVs and selling us oil. China, India, Abu Dhabi, Saudi Arabia made a lot of money and banked it."[87] During 2008, then U.S. Comptroller General David M. Walker argued that the U.S. faced four deficits that posed significant risk to its fiscal future: Budget, balance of payments, savings and leadership.[88]
A February 2013 paper from four economists concluded that a trade deficit is a factor in whether a country will pay higher interest rates as its public debt level rises, which increases the risk of fiscal crisis. Both the U.S. and Eurozone countries (excluding Germany) had significant trade deficits leading up to the crisis.[89][90] A rebuttal to their paper indicated that the trade deficit (which requires private borrowing to fund) may be a bigger factor than public debt in causing a rise in interest rates.[91]
Economists David Autor, David Dorn and Gordon Hanson wrote in 2013 that: "Rising imports cause higher unemployment, lower labor force participation, and reduced wages in local labor markets that house import-competing manufacturing industries. In our main specification, import competition explains one-quarter of the contemporaneous aggregate decline in US manufacturing employment. Transfer benefits payments for unemployment, disability, retirement, and healthcare also rise sharply in more trade-exposed labor markets."[92]
Currency policy
Policies that affect the value of the U.S. dollar relative to other currencies also affect employment levels. Economist Christina Romer wrote in May 2011: "A weaker dollar means that our goods are cheaper relative to foreign goods. That stimulates our exports and reduces our imports. Higher net exports raise domestic production and employment. Foreign goods are more expensive, but more Americans are working. Given the desperate need for jobs, on net we are almost surely better off with a weaker dollar for a while."[93] Economist Paul Krugman wrote in May 2011: "First, what's driving the turnaround in our manufacturing trade? The main answer is that the U.S. dollar has fallen against other currencies, helping give U.S.-based manufacturing a cost advantage. A weaker dollar, it turns out, was just what U.S. industry needed."[94]
Economists C. Fred Bergsten and Joseph E. Gagnon wrote in September 2012: "The most overlooked cause of the economic weakness in the United States and Europe is what we call the 'global currency wars.' If all currency intervention were to cease, we estimate that the US trade deficit would fall by $150 billion to $300 billion, or 1 to 2 percent of gross domestic product. Between 1 million and 2 million jobs would be created. The euro area would gain by a lesser but still substantial amount. Countries that were engaged in intervention could offset the impact on their economies by expanding domestic demand."[95]
Tradable and non-tradable sectors
Economist Michael Spence analyzed U.S. employment trends from 1990 to 2008, separating workforce components into two major sectors:
- Non-tradeable sector, meaning those jobs that must be done locally, such as healthcare, government and construction. Of the 27.3 million jobs added during the period, 26.7 million were in the non-tradeable sector. From 1990 to 2008, the jobs in this sector increased from 88 million to 115 million.
- Internationally tradeable sector, meaning jobs related to goods that can be produced in one country and consumed in another, such as manufacturing, agriculture and energy, or consumed by people from another country, such as tourism. Lower- and middle- value added jobs have been moved abroad as part of globalized supply chains, resulting in less than one million jobs created during the period in this sector. During 1990, there were 34 million jobs in this sector; these grew slowly for about a decade then returned to their starting point by 2008.
Spence advocates structural reforms to help grow the tradeable sector jobs. Further, value-added per employee has been growing slowly in the non-tradeable sector. These trends are correlated with increasing income inequality and indicate significant structural issues face the U.S. labor market.[96]
Globalization commentary
Economist Paul Krugman wrote: "By contrast, trade between countries at very different levels of economic development tends to create large classes of losers as well as winners. Although the outsourcing of some high-tech jobs to India has made headlines, on balance, highly educated workers in the United States benefit from higher wages and expanded job opportunities because of trade...But workers with less formal education either see their jobs shipped overseas or find their wages driven down by the ripple effect as other workers with similar qualifications crowd into their industries and look for employment to replace the jobs they lost to foreign competition. And lower prices at Wal-Mart aren't sufficient compensation."[97]
Fareed Zakaria described the factors slowing growth in developed countries like the U.S., writing in November 2011: "The fact is that Western economies—with high wages, generous middle-class subsidies and complex regulations and taxes—have become sclerotic. Now they face pressures from three fronts: demography (an aging population), technology (which has allowed companies to do much more with fewer people) and globalization (which has allowed manufacturing and services to locate across the world)."[98]
Former Fed chair Paul Volcker argued in February 2010 that the U.S. should make more of the goods it consumes domestically: "We need to do more manufacturing again. We're never going to be the major world manufacturer as we were some years ago, but we could do more than we're doing and be more competitive. And we've got to close that big gap. You know, consumption is running about 5 percent above normal. That 5 percent is reflected just about equally to what we're importing in excess of what we're exporting. And we've got to bring that back into closer balance."[99]
Economist Peter Navarro wrote in June 2011: "The American economy has been in trouble for more than a decade, and no amount of right-wing tax cuts or left-wing fiscal stimuli will solve the primary structural problem underpinning our slow growth and high unemployment. That problem is a massive, persistent trade deficit—most of it with China—that cuts the number of jobs created by nearly the number we need to keep America fully employed."[100] Economist Peter Morici wrote in May 2012: "Cutting the trade deficit in half, through domestic energy development and conservation, and offsetting Chinese exchange rate subsidies would increase GDP by about $525 billion a year and create at least 5 million jobs."[101]
Economist Michael Spence explained in August 2011 that over the 1990-2008 period, job creation was almost entirely in the "non-tradable" sector (which produces goods and services that must be consumed domestically, like healthcare) with few jobs created in the "tradable" sector (which produces goods that can be sold internationally, like manufacturing). He stated that job creation in both sectors is necessary and that various factors, such as the housing bubble, hid the lack of job creation in the tradable sector. He stated: "We're going to have to try to fix the ineffective parts of our educational system...We're under-investing in things like infrastructure...we've just been living on consumption and we need to live a little bit more on investment, including public-sector investment." He also advocated tax policy changes to encourage hiring of U.S. workers.[102]
Automation and technology change
Overview
In addition to off-shoring, technological change and automation of labor have impacted job growth in certain industries. A technology revolution is fast replacing human beings with machines in virtually every sector and industry in the global economy. While the historical perspective was that automation created more jobs than it eliminated, as computers and robots become more capable some economists have begun to doubt this historical view.[103]
Historical perspective
The view of economists historically has been that automation increases the number of jobs, although it displaces some workers in favor of others. Journalist Henry Hazlitt explained in the 1979 edition of his book Economics in One Lesson why automation tends to create as many or more jobs overall than it destroys:
- It requires labor and capital to build the machines that replace the workers whose jobs have been automated away, which creates jobs partially or fully offsetting the initial loss;
- After the machines have produced sufficient economies to offset their cost, the owners can expect increased profits, which can be spent in the same or different industry, also creating jobs;
- If competitors also adopt the machines, prices in the industry will begin to drop. This may increase the quantity of the goods demanded. This also allows savings to be passed along to consumers, who can use the difference to spend in the same or different industry, also creating jobs.
Hazlitt wrote that these three offsets tend to increase jobs overall. Further, automation increases production, productivity and real wages over the long-run. He explained that over the course of human history, the number of persons employed tends to jump along with advances in technology. While jobs are destroyed in one activity, more jobs are typically created in others.[104]
While automation has displaced millions of workers in various cycles (e.g., agriculture in the U.S. in the early 1900s) other industries have typically taken their place.[105][106]
Recent perspectives
However, MIT economists Brynjolfsson and McAfee estimated in January 2013 that technology is potentially destroying more jobs than it is creating: "Technology is always creating jobs. It's always destroying jobs. But right now the pace of destroying them is accelerating...So as a consequence, we are not creating jobs at the same pace that we need to." Routine, middle-skill jobs are being eliminated by advances in business processes and technology, for example: self-service applications such as internet ordering in retail, grocery self-checkout, and ATM machines; manufacturing assembly robots; logistics such as warehouse robots that can move goods from storage to shipping; and healthcare, where robots are moving meals and medical waste in hospitals. McAfee sees this trend of technology eliminating jobs continuing for some time: "When I see what computers and robots can do right now, I project that forward for two, three more generations, I think we're going to find ourselves in a world where the work as we currently think about it, is largely done by machines."[107][108]
Matt Miller wrote in January 2013 that this automation may have profound policy implications. If robots replace a vast number of workers, wage income may not be sufficient to support the middle class. More and more wealth will be concentrated in the hands of capital (e.g., those who make and own the robots doing the work). This could require significant changes in tax and redistribution policies on a massive scale.[109] During August 2011, Taiwan manufacturing company Foxconn announced that it would be using up to one million robots to replace human laborers.[110]
Economist Paul Krugman discussed this automation in December 2012: "This is an old concern in economics; it's 'capital-biased technological change', which tends to shift the distribution of income away from workers to the owners of capital...Twenty years ago, when I was writing about globalization and inequality, capital bias didn't look like a big issue; the major changes in income distribution had been among workers...rather than between labor and capital. So the academic literature focused almost exclusively on 'skill bias," supposedly explaining the rising college premium. But the college premium hasn't risen for a while. What has happened, on the other hand, is a notable shift in income away from labor...I think we'd better start paying attention to those implications." Krugman used a chart to show how the share of compensation income as a % GDP had fallen consistently from 60% in 1970 to 55% in 2011.[52][111]
One possible consequence is that as developing country wages rise, U.S. companies may decide to automate the jobs but return the activity to the U.S., a phenomenon some refer to as "re-shoring" (as opposed to "off-shoring").[83]
Although U.S. manufacturing employment declined from 17 million workers to 12 million from 2000 to 2011, production has returned to 2000 levels.[112][113] In other words, productivity, supported by significant automation or process improvements, may be a significant driver of job losses in that industry, along with off-shoring.
Economist Tyler Cowen wrote in 2011 that recent major innovations such as the internet create fewer jobs relative to previous innovations such as the automobile. For example, the internet represents a significant amount of consumer activity but relatively little revenue for companies to support job creation. The "revenue-intensive" sectors of the economy have slowed down, while "revenue deficient" sectors have expanded. Information technology innovation also requires fewer, high skilled workers relative to previous innovations, which created more lower skilled jobs per dollar of revenue.[114]
The "Access" or "On Demand" economy
An emerging trend in the labor market is the access economy, also referred to as the "on demand" or "gig-based" economy, in which customers use technology platforms (often web-based or mobile phone apps) to connect to suppliers directly without intermediation, reducing costs. Companies such as Uber (transportation) and Airbnb (room rental) are examples of this trend.[115]
The impacts of the access economy in terms of costs, wages and employment are not easily measured and appear to be growing.[116] Various estimates indicate that 30-40% of the U.S. workforce is self-employed, part-time, temporary or freelancers. However, the exact percentage of those performing short-term tasks or projects via these platforms was not effectively measured as of 2015 by government sources.[115] One private industry survey placed the number of "full-time independent workers" at 17.8 million in 2015, roughly the same as 2014. Another survey estimated the number of workers who do at least some freelance work at 53.7 million in 2015, roughly 34% of the workforce and up slightly from 2014.[117]
At the individual transaction level, the removal of a higher overhead business intermediary (say a taxi company) with a lower cost technology platform helps reduce the cost of the transaction for the customer while also providing an opportunity for additional suppliers to compete for the business, further reducing costs.[115] Consumers can then spend more on other goods and services, stimulating demand and production in other parts of the economy. Classical economics argues that innovation that lowers the cost of goods and services represents a net economic benefit overall. However, like many new technologies and business innovations, this trend is disruptive to existing business models and presents challenges for governments and regulators.[104]
For example, should the companies providing the technology platform be liable for the actions of the suppliers in their network? If consumers tend to be higher income persons while the suppliers are lower-income persons, will the lower cost of the services (and therefore lower compensation of the suppliers) worsen income inequality? These are among the many questions the on-demand economy presents.[115][116]
Immigration
Effects on wages and income inequality
Economist Paul Krugman summarized his views of the literature on the economic impact of immigrants on the U.S. economy as follows in March 2006:
- Net benefits to the U.S. economy from immigration are small overall, with an estimated less than 1% added to the total income of native-born Americans, even though the immigrants may benefit significantly.
- Poorer native-born Americans are hurt by immigration, particularly from Mexico. The additional supply of lower-educated immigrants from Mexico may have subtracted up to 8% from the wages of native-born American high school dropouts.
- Lower income immigrants place additional strain on the social safety net, particularly in certain states.
- Immigrants have a limited impact on income inequality.
Krugman recommended that the U.S. should "reduce the inflow of low-skill immigrants" mainly via "better controls on illegal immigration."[118][119]
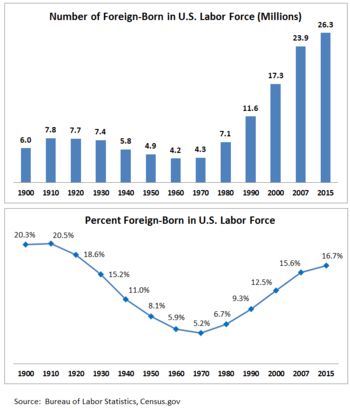
Effects on employment levels
The BLS analyzes the labor force in terms of native-born vs. foreign-born. The BLS defines the terms as follows: "The foreign born are persons who reside in the United States but who were born outside the country or one of its outlying areas to parents who were not U.S. citizens. The foreign born include legally-admitted immigrants, refugees, temporary residents such as students and temporary workers, and undocumented immigrants."
BLS statistics indicate foreign-born workers have filled jobs disproportionally to their share in the population. From 2000 to 2015, foreign-born represented 33% of the aged 16+ population increase, but represented 53% of the labor force increase and 59% of the employment increase. In addition, they have had a slower decline in labor force participation since 2000. Comparing BLS workforce data (in 000's) between 2000[120] and 2015[121] indicates that:
- The number of employed native-born rose from 118,254 to 123,817 (5.6 million or 5%), while foreign-born rose from 16,954 to 24,963 (8.0 million or 47%). This indicates both groups saw a substantial increase in employment, although the foreign-born had a much larger increase relative to 2000.
- In the labor force, the number of native-born rose from 123,158 to 130,872 (7.7 million or 6%) while foreign-born rose from 17,705 to 26,258 (8.5 million or 48%).
- In the civilian population (those age 16+), the number of native-born rose from 183,173 to 210,544 (27.3 million or 15%) while the foreign-born rose from 26,527 to 40,257 (13.7 million or 52%).
- Labor force participation rates (i.e., number in labor force divided by civilian population) were approximately the same in 2000 for native- and foreign-born, at 67%. Comparing 2000 with 2015, participation rates fell more for native-born (5 percentage points, to 62%) than foreign-born (2 percentage points, to 65%).
- Employment to population ratios (i.e., number employed divided by civilian population) were roughly equal at 65% and 64%, respectively in 2000, but fell more for native-born (6 percentage points, to 59%) than foreign-born (2 percentage points, to 62%).
Journalist Roger Lowenstein wrote in 2006 that immigrants create demand as well as adding supply to the labor force: "After all, 21 million immigrants, about 15 percent of the labor force, hold jobs in the U.S., but the country has nothing close to that many unemployed. (The actual number is only seven million.) So the majority of immigrants can't literally have "taken" jobs; they must be doing jobs that wouldn't have existed had the immigrants not been here."[122]
Other commentary
The Center for Immigration Studies reported in June 2014 that:
- Net employment growth 2000-2014 went entirely to immigrants (legal and illegal). Immigrants held 5.7 million more jobs in the first quarter of 2014 versus 2000, while jobs held by native-born Americans had a small decline. (Note that this conclusion differs materially from the BLS comparison above.)
- The number of working age (16 to 65) native-born workers had increased by 17 million from 2000 to 2014, but these additions were mainly outside the labor force.
- Native-born Americans and immigrants compete for the same jobs; it is false that immigrants do jobs that Americans will not do.
- The extent to which immigrants displace native-born in the labor market is debated, but the data since 2000 is indicative of a significant level of displacement.
- The large number of working-aged persons outside the labor force would indicate a large influx of immigrants is not needed purely based on numbers, unless there is a skills shortage.[123]
Other studies indicate that immigrants have little impact on employment levels or wages of native-born Americans. For example, lower-skill immigrants allow native born workers to focus on higher productivity roles. Immigrants also consume goods and services, creating opportunities for native born employers. To the extent immigrants accept lower pay than native born workers, they lower prices, allowing consumers to spend more on other goods and services.[124][125]
Trade deals
NAFTA
The job effects of the 1994 North American Free Trade Agreement (NAFTA) are controversial. In a 2015 report, the Congressional Research Service summarized multiple studies as follows:
In reality, NAFTA did not cause the huge job losses feared by the critics or the large economic gains predicted by supporters. The net overall effect of NAFTA on the U.S. economy appears to have been relatively modest, primarily because trade with Canada and Mexico accounts for a small percentage of U.S. GDP. However, there were worker and firm adjustment costs as the three countries adjusted to more open trade and investment among their economies."[126]
Critics attribute much of the displacement caused in the US labor market to the United States' growing trade deficits with Mexico and Canada. According to the Economic Policy Institute, rise in the trade deficit with Mexico alone since NAFTA was enacted led to the net displacement of 682,900 U.S. jobs by 2010.[127][128]
Fifteen percent of employers in manufacturing, communication, and wholesale/distribution shut down or relocated plants due to union organizing drives since NAFTA's implementation.[129] The weakening of rights for the American labor force is one example of the "race to the bottom" theory advocated by most opponents that will result from these trade policies.[128] Ultimately, workers are faced with the dilemma of settling for fewer worker's rights because the firm will always have the ability to relocate to another country, notably Mexico, where they can attain cheaper labor and will face less resistance from workers.[128] However, it is now common that these incentives are enough to cost American laborers their jobs regardless of the status of the labor unions.[128]
Other factors
Innovation
Relatively new, smaller firms are the primary job creators. A 2009 study by the Kauffman Foundation using U.S. Census data indicated that:
- "From 1980-2005, nearly all net job creation in the United States occurred in firms less than five years old...without startups, net job creation for the American economy would be negative in all but a handful of years."
- "If one excludes startups, an analysis of the 2007 Census data shows that young firms (defined as one to five years old) still account for roughly two-thirds of job creation, averaging nearly four new jobs per firm per year."
- "Of the overall 12 million new jobs added in 2007, young firms were responsible for the creation of nearly 8 million of those jobs." (Note: This is a gross number not reduced by jobs lost; the economy generally creates and destroys millions of jobs in any given year.)
- "Given this information, it is clear that new and young companies and the entrepreneurs that create them are the engines of job creation and eventual economic recovery. The distinction of firm age, not necessarily size, as the driver of job creation has many implications, particularly for policymakers who are focusing on small business as the answer to a dire employment situation."[130]
In the globalized free market, innovation does not necessarily mean the jobs will be created domestically. A popular product, the Apple iPod, offers an interesting perspective on globalization and employment. This product was developed by a U.S. corporation. In 2006, it was produced by about 14,000 workers in the U.S. and 27,000 overseas. Further, the salaries attributed to this product were overwhelmingly distributed to highly skilled U.S. professionals, as opposed to lower skilled U.S. retail employees or overseas manufacturing labor. Increasingly, globalization is shifting incomes to those with the highest educational backgrounds and professional skills. One interpretation of this result is that U.S. innovation can create more jobs overseas than domestically.[74][131] During 2011, Apple employed 43,000 U.S. workers and 20,000 overseas. However, nearly 700,000 workers overseas working for other companies made nearly all of its iPhone, iPad and other products.[74]
Andrew Grove wrote in July 2010 that key technology innovations are increasingly "scaled" or mass-produced in Asia, with a 10-1 ratio of overseas to domestic workers. He wrote that Asian countries "seem to understand that job creation must be the No. 1 objective of economic policy." He recommended a tax on products made off-shore, to be used to fund companies that will scale their U.S. operations.[132]
Industry-specific factors

Industries may have long-term and short-term factors that drive trends in employment. Manufacturing and construction are two major industry groups that illustrate such factors.
The Economist reported in March 2011 that U.S. manufacturing employment declined steadily from approximately 17 million in 2000 to under 12 million in 2010.[133] Comparing January 2008, the U.S. overall peak employment month across all industries pre-crisis, with October 2012, manufacturing employment was down 1.76 million.[134] This is due to a combination of growing competition from lower-wage countries, automation/productivity improvements, off-shoring, etc.
For example, China's share of global manufacturing increased from approximately 5% in 1996 to 12% in 2008. China represents roughly one-third of the U.S. trade deficit, nearly $295 billion in 2011.[135] The Economic Policy Institute (EPI) estimated that from 2001-2011, 2.7 million jobs were lost to China.[136] USA Today reported in 2007 that an estimated one in six factory jobs (3.2 million) have disappeared from the U.S. since 2000, due to automation or off-shoring to countries like Mexico and China, where labor is cheaper.[137]
U.S. construction employment is heavily reliant on the housing market and new home construction. Measured from January 2008, construction employment was down 1.94 million as of October 2012. This follows a peak in construction employment due to the U.S. housing bubble throughout the mid-2000s, with a recent peak of approximately 7 million sustained during the 2005-2008 period.[138]
The total of the job losses in these two industries from January 2008 to October 2012 was 3.7 million. For scale, the U.S. overall employment decline from January 2008 to October 2012 was a net 4.3 million, with 8.8 million jobs lost from 1/08 to 2/10 and 4.5 million jobs added back thereafter.[139]
According to an American Bar Association report, After the JD, for the 2000 graduating class of law students 24% of the surveyed lawyers were not practicing law in 2012, compared, to the same group, about 9%, who weren't practicing law in 2003.[140][141]
Unemployment benefits
There is debate regarding the extent to which safety net programs such as unemployment insurance extend periods of unemployment by reducing the incentive to find work. The Heritage Foundation estimated in September 2011 that extending unemployment insurance increases the unemployment rate between 0.5 and 1.5 percentage points, advocating that such payouts be offset by other spending cuts.[142] Economist Paul Krugman argued in July 2010 that with five job seekers for every job opening, "cutting off benefits to the unemployed will make them even more desperate for work—but they can't take jobs that aren't there." He also cited CBO reports indicating unemployment insurance is a highly effective form of stimulus, which he advocated in an economic downturn.[143]
Unemployment benefits are determined on the state level, using a number of different methods to establish a worker's weekly compensation:
- High quarter method: benefits determined by quarter with highest wages
- Annual wage method: benefits determined by percentage of annual wages
- Multi-quarter method: benefits determined by average wages in one or more quarters
- Average weekly wage method: benefits determined by average weekly wages
In general, southern states have the lowest level of unemployment benefits (with Mississippi at $235.00), and Northeastern states have the highest benefit levels (with Massachusetts at $939.00).[144]
The Congressional Budget Office provides periodic reports on unemployment insurance programs. The unemployment insurance (UI) program provides a weekly benefit to qualified workers who lose their job and are actively seeking work. The amount of that benefit is based in part on a workers past earnings. In particular, the periods for which eligible workers can receive UI benefits have been repeatedly extended during the 2008-2009 recession and its aftermath. Regular UI benefits generally last up to 26 weeks, but extensions were legislated extending this period significantly. From 2008-2012, these programs provided approximately $520 billion in benefits to recipients, which allowed households to better maintain their consumption. Far more workers were laid off in 2008 and 2009 than in 2006 and 2007. The number of workers who lost their job and started receiving UI benefits peaked at 14.4 million in 2009, whereas an average of roughly 8 million laid-off workers started receiving benefits in each fiscal year from 2004 to 2007.[145]
Outlays for UI benefits totaled $120 billion in fiscal year 2009, a substantial increase over the amount two years earlier, which was $33 billion. Spending on UI benefits in fiscal year 2010 was even higher than in fiscal year 2009, totaling nearly $160 billion. CBO projected in November 2010 that spending in fiscal year 2011 would be $93 billion.[146]
In January 2014, the United States Senate began debating the Emergency Unemployment Compensation Extension Act (S. 1845; 113th Congress) on the Senate floor.[147] The Emergency Unemployment Compensation Extension Act would extend federal emergency unemployment benefits for another three months, at a cost of $6.4 billion.[148]
Employment of part-time workers versus full-time

U.S. employers have shifted the composition of the workforce to more part-time workers versus full-time. The percentage of the workforce that is part-time has risen from approximately 17.0% in January 2000 to 19.2% in May 2013. Employers do not have to pay some costly benefits to part-time workers and can vary payroll costs more easily to reflect economic conditions.[149]
Statistics regarding the number of full-time and part-time workers (in thousands) since 2000 highlight this trend:
- From the November 2007 pre-crisis peak total employment month to December 2009 trough or low point, the U.S. lost 11,306 full-time jobs but added 2,704 part-time jobs, a net loss of 8,602 jobs total.
- From the December 2009 crisis total employment trough to May 2013, the U.S. added 5,669 full-time jobs and added 237 part-time jobs, a total of 5,906 jobs.
- From the November 2007 pre-crisis peak total employment month to May 2013, the U.S. lost 5,637 full-time jobs and added 2,941 part-time jobs, a net loss of 2,696 jobs total.[150]
Job quality trends
The Economic Policy Institute (EPI) defined a "good job" in 2010 as one "that pays at least $37,000 per year ($18.50 per hour, the male median wage in 1979 adjusted for inflation), has employer-provided health insurance, and an employer-sponsored retirement plan (e.g., pension or 401k plan). Using this definition, the Center for Economic and Policy Research (CEPR) reported in July 2012 that the share of workers with a good job fell from 27.4% in 1979 to 24.6% in 2010. Adjusting for an older, more educated workforce than in the past (which theoretically should have increased the quality of job commensurate with the additional capabilities), CEPR estimated that relative to 1979 the economy had lost about one-third (28-38%) of its capacity to generate good jobs.[151] EPI reported in its The State of Working America report (12th edition) that from 1979 to 2010, the proportion of "good jobs" held by men dropped from 37% to 28%, while the proportion of good jobs held by women increased from 12% to 21% by 2000 and remained around that level through 2010. These trends occurred despite a 48% increase in productivity, measured by output per worker, which increased from approximately $70,000 to $104,000 over the 1979-2010 period.[152]
See also
- Bureau of Labor Statistics
- Economy of the United States
- Income inequality in the United States
- Job Creation Index
- Jobs created during U.S. presidential terms
- Unemployment benefits in the United States
References
- ↑ "Unemployment Rate". Bureau of Labor Statistics. Retrieved October 6, 2012.
- ↑ "Unemployment Rate". Bureau of Labor Statistics. Retrieved October 6, 2012.
- ↑ Bittle, Scott; Johnson, Jean (2012). Where did the jobs go and how do we get them back?. Harper Collins. ISBN 978-0-06-171566-2.
- ↑ Ben Bernanke (March 2012). "Recent Developments in the Labor Market" (PDF).
- ↑ Laura D'Andrea Tyson (July 2011). "Jobs Deficit, Investment Deficit, Budget Deficit". Economix. NYT.
- ↑ Ben Bernake (March 26, 2012). "Recent Developments in the Labor Market".
- ↑ Ben Bernanke Speech. The Economic Recovery and Economic Policy (Speech). Federal Reserve.
- ↑ "Congressional Research Service-The Increase in Unemployment Since 2007: Is it Structural or Cyclical?-April 2011" (PDF).
- ↑ "Time El-Erian Time to Fix the Economy-April 2011". TIME.com. 4 May 2011.
- ↑ "Project Syndicate El-Erian Sleepwalking Through America's Unemployment Crisis-April 2011". Project Syndicate.
- ↑ Catherine Rampell (March 2013). "An Odd Shift in an Unemployment Curve". NYT. Retrieved March 2013. Check date values in:
|access-date=(help) - ↑ "FRB-What Is the New Normal Unemployment Rate?-February 2011". 14 February 2011.
- ↑ "FRED Database-CBO Estimates of Natural Unemployment Rate". Retrieved November 23, 2012.
- ↑ "Calculated Risk-Employment: A decline in the participation rate was expected due to the aging population".
- ↑ Paul Krugman (October 6, 2012). "Constant Demography Employment". NYT.
- ↑ Calculated Risk-Decline in Labor Force Participation-December 7, 2014
- ↑ Binyamin Appelbaum (January 10, 2014). "Debating Why the Workforce is Shrinking". NYT.
- ↑ Bloomberg-Discouraged Workers-December 2014
- ↑ "A Closer Look at the Decline in the Labor Force Participation Rate". stlouisfed.org.
- ↑ NPR-Marilyn Geewax-Latest Wrinkle in the Jobs Debate: Blame the Boomers-July 21, 2014
- ↑ White House Council of Economic Advisers-The Labor Force Participation Rate Since 2007-Causes and Policy Implications-July 2014
- ↑ Bureau of Labor Statistics-People who are not in the workforce-Why Aren't They Working?-December 2015
- ↑ FRB Atlanta-Macroblog-Labor Force Participation: Aging is only half the story-April 2016
- ↑ Matthew C. Klein. "Bloomberg-Matthew Klein-Why Aging Baby Boomers Don't Explain Jobs Numbers-April 2013". BloombergView.com.
- ↑ "Federal Reserve Database-EMRATIO for Men and Women Aged 16-64".
- ↑ "The Hamilton Project-Understanding the Jobs Gap and What it Says About America's Evolving Workforce-March 2012". The Hamilton Project.
- ↑ David Leonhardt (August 2013). "The Age Equation in Employment Numbers". The New York Times.
- ↑ "Bureau of Labor Statistics-Employment Situation Summary-June 2014".
- ↑ White House Council of Economic Advisors-The Long-Term Decline in Prime-Age Male Labor Force Participation-June 2016-Page 13
- ↑ "Calculated Risk-Employment Graphs". Retrieved October 27, 2012.
- ↑ "Pew Research Center-The Monetary Value of a College Education-March 7, 2012". Pew Research Center. 7 March 2012.
- ↑ "Education and Global Competitiveness: Lessons for the U.S. from International Evidence" (PDF). AEI.
- ↑ Josh Bersin (4 February 2014). "Forbes-The Recovery Arrives as Corporate Training Spend Skyrockets-February 2014". Forbes.
- ↑ "USA Today-Companies' training cuts add to jobless woes-August 9, 2012". USATODAY.COM.
- ↑ "Council on Foreign Relations-Education Reform and U.S. Competitiveness-September, 2011". Council on Foreign Relations.
- ↑ "Alvin Toffler-Quotes-Retrieved November 11, 2015". Retrieved 20 October 2014.
- ↑ Thomas Friedman (January 2013). "Its the CQ and the PQ as much as the IQ". The New York Times.
- ↑ "Stubborn Skills Gap in America's Work Force". NYT. 8 April 2013.
- ↑ NYT-Paul Krugman-Jobs and Skills and Zombies-March 30, 2014
- ↑ "FRED-Ratio of Long-Term Unemployed". Retrieved July 2014. Check date values in:
|access-date=(help) - ↑ NYT-Catherine Rampbell-The Forgotten Long-Term Unemployed-November 1, 2012
- ↑ "Calculated Risk-Employment Graphs-Retrieved October 28, 2012".
- ↑ "FRED Database-LNS13025703 Data Series". Retrieved October 28, 2012.
- 1 2 Annie Lowrey and Catherine Rampbell (November 1, 2012). "Little Federal Help for the Long-term Unemployed". The New York Times.
- ↑ "CBO-Understanding and Responding to Persistently High Unemployment-February 2012". Congressional Budget Office.
- ↑ Krugman, Paul (2007). The Conscience of a Liberal. W.W. Norton Company Limited. ISBN 978-0-393-06069-0.
- ↑ "U.S. Bureau of Labor Statistics-Union Members Summary-January 23, 2013".
- ↑ "The Atlantic-A Giant Statistical Roundup of the Income Inequality Crisis in 16 Charts-December 2012". The Atlantic. 12 December 2012.
- ↑ Kris Warner. "Bloomberg-The Real Reason for the Decline of Unions-Kris Warner-January 23, 2013". BloombergView.com.
- ↑ Banking Industry Consolidation and Market Structure: Impact of the Financial Crisis and Recession-November 2011
- ↑ "Washington Monthly-Who Broke America's Jobs Machine?-March 2010".
- 1 2 NYT-Paul Krugman-Robots and Robber Barons-December 2012
- ↑ Chart was made using data initially published as Thomas Piketty and Emmanuel Saez (2003), Quarterly Journal of Economics, 118(1), 2003, 1-39. Data (and updates) shown at http://inequality.org/income-inequality
- ↑ NYT-Annie Lowrie-Income Inequality May Take Toll on Growth-October 2012
- ↑ "Wealth, Income, and Power-G. William Domhoff-University of California Santa Cruz-Retrieved December 2012".
- ↑ Stiglitz, Joseph E. (2012-06-04). The Price of Inequality: How Today's Divided Society Endangers Our Future (p. 85). Norton. Kindle Edition. See also: Karen E. Dynan, Jonathan Skinner, and Stephen P. Zeldes, "Do the Rich Save More?," Journal of Political Economy 112, no. 2 (2004): 397– 444.
- ↑ NYT-Joseph Stiglitz-Inequality is holding back the recovery-January 2013
- 1 2 Conservative Inequality Denialism| Timothy Noah| tnr.com| October 25, 2012
- ↑ The Way Forward| By Daniel Alpert, Westwood Capital; Robert Hockett, Professor of Law, Cornell University; and Nouriel Roubini, Professor of Economics, New York University| New America Foundation| October 10, 2011
- ↑ Inequality and crises: coincidence or causation? Paul Krugman
- ↑ "Bloomberg-U.S. Set for Biggest State-Local Jobs Boost Since 2007-January 2013". Bloomberg. 8 January 2013.
- ↑ Chairman Ben S. Bernanke-The Economic Outlook Before the Joint Economic Committee-May 22, 2013
- ↑ NYT-Catherine Rampell-Mandatory Federal Cuts Hurt Private Sector, Too-June 26, 2013
- 1 2 Jared Bernstein (May 2013). "Where Have All the Jobs Gone?". NYT. Retrieved May 2013. Check date values in:
|access-date=(help) - ↑ "Economic Policy Institute- -Shierholz, Sabadish, and Finio-The Class of 2013". Economic Policy Institute. Retrieved May 27, 2013.
- ↑ "EPI-Unemployed Workers Outnumber Job Openings in Every Sector-April 2013". Economic Policy Institute.
- ↑ "Bureau of Labor Statistics-Jobs Openings and Labor Turnover Summary-September 10, 2013".
- ↑ http://www.un.org/en/development/desa/policy/wesp/wesp_current/wesp2014.pdf
- ↑ Bloomberg-Stilwell and McGregor- Gigonomics The Dismal Science Behind Today's On-Demand Jobs-June 2, 2016
- ↑ Katz & Kruger-Princeton-The Rise and Nature of Alternative Work Arrangements in the United States 1995-2015-Retrieved June 2, 2016
- ↑ Full Time Share of Employed-Retrieved June 2, 2016
- 1 2 Levine, Linda (January 21, 2011). "CRS-Offshoring (or Offshore Outsourcing) and Job Loss Among U.S. Workers" (PDF). Congressional Research Service. Retrieved November 21, 2012.
- 1 2 NYT-A New Capital of Call Centers-November 2011
- 1 2 3 Charles DuHigg and Keith Bradsher (January 2012). "How the U.S. Lost Out on iPhone work". The New York Times.
- ↑ NYT-Beth Macy-Who's Speaking Up for the American Worker?-June 25, 2015
- ↑ "USA Today-Factory Jobs: 3 Million Lost Since 2000-April 2007".
- ↑ "The Economist-Here, there and everywhere-January 2013". The Economist.
- ↑ ETA Annual Report 2014-Retrieved August 14, 2015
- ↑ DOL-Employment and Training Administration-Trade Adjustment Assistance for Workers Fiscal Year 2011 Report to the Committee on Finance of the Senate and Committee on Ways and Means of the House of Representatives-Page 4-2011
- ↑ DOL-Employment and Training Administration-Trade Adjustment Assistance for Workers Fiscal Year 2010 Report to the Committee on Finance of the Senate and Committee on Ways and Means of the House of Representatives-Page 4-2010
- ↑ Employment and Training Administration. "Trade Adjustment Assistance for Workers Fiscal Year 2009 Report to the Committee on Finance of the Senate and Committee on Ways and Means of the House of Representatives" (PDF). DOL. p. 5.
- ↑ http://krugman.blogs.nytimes.com/2014/11/12/on-income-stagnation/?comments#permid=13314433 NYT-Paul Krugman-On Income Stagnation-November 12, 2014
- 1 2 NYT-Catherine Rampell-When Cheap Foreign Labor Gets Less Cheap-December 2012
- ↑ Congressional Research Service-Globalized Supply Chains and U.S. Policy-Page 24-January 27, 2010
- ↑ "Networkworld-CEOs defend moving jobs offshore at tech summit-October 2003". Network World. 9 October 2003.
- ↑ "The Economist-Points of Light-July 14, 2012". The Economist.
- ↑ "NPR-This American Life-The Giant Pool of Money-May 2008".
- ↑ GAO-U.S. Financial Condition and Fiscal Future Briefing-January 2008
- ↑ NYT-Binyamin Appelbaum-Predicting a Crisis, Repeatedly-February 22, 2013
- ↑ "Greenlaw, Hamilton, Hooper, Mishkin Crunch Time: Fiscal Crises and the Role of Monetary Policy-February 2013".
- ↑ Matthew O'Brien (7 March 2013). "The Atlantic-No, the United States Will Never, Ever Turn Into Greece-Mathew O'Brien-March 7, 2013". The Atlantic.
- ↑ Autor, Dorn and Hanson-The China Syndrome-2013
- ↑ NYT-Christina Romer-Needed: Plain Talk About the Dollar-May 2011
- ↑ Krugman, Paul. Making Things in America. The New York Times. May 20, 2011.
- ↑ "Peterson Institute for International Economics-Time for a Fightback in the Currency Wars-September 2012".
- ↑ "Council on Foreign Relations-Spence and Hlatshwayo-The Evolving Structure of the American Economy and the Employment Challenge-March 2011". Council on Foreign Relations.
- ↑ Paul Krugman-The Trouble With Trade-December 2007
- ↑ "CNN Fareed Zakaria GPS-November 10, 2011".
- ↑ "Fareed Zakaria GPS-Paul Volcker Interview-February 2010".
- ↑ "LA Times-Peter Navarro-How China Unfairly Bests the U.S.-June 21, 2011". Los Angeles Times.
- ↑ Peter Morici-Globalpolitician.com – Retrieved November 16, 2012
- ↑ McKinsey Quarterly-Michael Spence-August 2011
- ↑ NYT-Claire Cain Miller-As Robots Grow Smarter, American Workers Struggle to Keep Up-December 15, 2014
- 1 2 Hazlitt, Henry (1979). Economics in One Lesson. Three Rivers Press. ISBN 0-517-54823-2.
- ↑ NYT-Catherine Rampbell-Raging (Again) Against the Robots-February 2, 2013
- ↑ "Wired-Kevin Kelly-Better Than Human: Why Robots Will — And Must — Take Our Jobs December 2012". WIRED.
- ↑ "60 Minutes-Robots on the Rise in the Workplace-January 13, 2013". 11 January 2013.
- ↑ Brynjolfsson, Erik, McAfee, Andrew (2011). Race Against the Machine. Digital Frontier Press. ISBN 978-0984725113.
- ↑ "Washington Post-Matt Miller-The Robots are Coming-January 2013". Washington Post.
- ↑ "Reuters-Foxconn to rely more on robots; could use 1 million in 3 years-August 2011". Reuters.
- ↑ NYT-Paul Krugman-Rise of the Robots-December 2012
- ↑ "FRED Database-Manufacturing Output Index-Retrieved February 2013".
- ↑ "FRED Database-Manufacturing Employment". Retrieved February 2013. Check date values in:
|access-date=(help) - ↑ Cowen, Tyler (2011). The Great Stagnation. Dutton. ISBN 978-0-525-95271-8.
- 1 2 3 4 "Gig Economy Hasn't Taken Over". Bloomberg.com. Retrieved August 28, 2015.
- 1 2 "The Gig Economy: Implications of the Growth of Contingent Work". Federalreserve.gov. Retrieved November 27, 2016.
- ↑ Bloomberg-Justin Fox-Gig Economy is Growing, But Not Growing Up-October 2, 2015
- ↑ NYT-Paul Krugman-North of the Border-March 27, 2006
- ↑ NYT-Paul Krugman-Notes on Immigration-March 27, 2006
- ↑ BLS-The Role of Foreign Born Workers-May 2002
- ↑ BLS-News Release-Foreign Born Workers: Labor Force Characteristics 2015-See Table 1
- ↑ NYT-Roger Lowenstein-The Immigration Equation-July 9, 2006
- ↑ Center for Immigration Studies-Zeigler and Camarota-All Employment Growth Since 2000 Went to Immigrants-June 2014
- ↑ The Hamilton Project-Grenstone and Looney-What Immigration Means for U.S. Employment and Wages-May 2012
- ↑ David Card-Is the New Immigration Really So Bad?-January 2005
- ↑ CRS-Villarreal and Fergusson-The North American Free Trade Agreement-April 16, 2015
- ↑ Scott, Robert E. Economic Policy Institute. 3 May 2011. Retrieved 10 Nov. 2011 Heading South: U.S.-Mexico trade and job displacement after NAFTA.
- 1 2 3 4 Scott, Robert E. Economic Policy Institute. 17 Nov. 2003. Retrieved 22 Apr. 2008 The High Price of Free Trade.
- ↑ Woodhead, Greg. AFL-CIO. 2000. AFL-CIO Policy Department. 28 Apr. 2008 NAFTA's Seven-Year Itch: Promised Benefits Not Delivered to Workers.
- ↑ Kauffman Foundation-Where will the jobs come from?-November 2009
- ↑ "Reuters-Freeland-Winners and Losers in the Apple Economy-July 2011". Reuters.
- ↑ "Andy Grove-How America Can Create Jobs". Businessweek.com.
- ↑ "The Economist-Rustbelt Recovery-March 2011". The Economist.
- ↑ "FRED Database-Manufacturing Employment-Retrieved November 2012".
- ↑ Zandi, Mark (2009). Financial Shock. FT Press. ISBN 978-0-13-701663-1.
- ↑ "EPI-The China Toll-August 2012". Economic Policy Institute.
- ↑ "USA Today-Factory Jobs 3 Million Lost Since 2000-April 2007".
- ↑ "FRED Database-Construction Employment". Retrieved November 2012. Check date values in:
|access-date=(help) - ↑ "FRED Database – U.S. Non-Farm Employees".
- ↑ Weiss, Debra Cassens (8 February 2014). "24 percent of JDs who passed the bar in 2000 aren't practicing law, survey finds". American Bar Association Journal. Retrieved 18 February 2014.
- ↑ "After the JD". American Bar Association. Retrieved 18 February 2014.
- ↑ "Heritage Foundation-Extended UI Payments Do Not Benefit the Economy-James Sherk-September 2011". The Heritage Foundation.
- ↑ NYT-Paul Krugman-Punishing the Jobless-July 2010
- ↑ Aneel, Navi. "How States Differ in Unemployment Benefits". AboutUnemployment.org. Retrieved 8 November 2015.
- ↑ "Unemployment Insurance in the Wake of the Recent Recession-November 2012". Congressional Budget Office.
- ↑ "CBO-Unemployment Insurance Benefits and Family Income of the Unemployed-November 2010". Congressional Budget Office.
- ↑ "S. 1845 - All Actions". United States Congress. Retrieved 8 January 2014.
- ↑ Vicki Needham; Ramsey Cox (7 January 2014). "Jobless benefits pass Senate hurdle". The Hill. Retrieved 8 January 2014.
- ↑ NYT-Catherine Rampell-The Rise of Part Time Work-March 2013
- ↑ "FRED Database-Full Time and Part Time Workers-Retrieved June 2013".
- ↑ Center for Economic and Policy Research-John Schmidt and Janelle Jones-Where Have All the Good Jobs Gone?-July 2012
- ↑ Economic Policy Institute-State of Working America-Jobs/Job Quality-Retrieved December 2014
External links
- Graphs and data
- Bloomberg-Fed Chair Janet Yellen's Employment Dashboard-August 2015
- Bureau of Labor Statistics
- US Unemployment Data – Current and historical unemployment data by various demographics
- Historical US Unemployment Rate Chart – interactive chart for U.S. unemployment rate data – 1948 to present including subcategories
- BLS-Job Openings and Labor Turnover Survey-October 2013
- FRB Atlanta-Labor Force Participation Dynamics-Interactive Data
- Other resources
- Summers, Lawrence H. (2008). "Unemployment". In David R. Henderson (ed.). Concise Encyclopedia of Economics (2nd ed.). Library of Economics and Liberty. ISBN 978-0865976658. OCLC 237794267.
- Unemployment Benefits Comparison By State
- Looking for Work: A History of Unemployment – an hour-long history public radio program exploring U.S. unemployment over more than three centuries
- Ben Bernanke-Recent Developments in the Labor Market-March 2012
- NYT Graphic-Pay and Productivity Trends 1947 to Present
- Monthly Labor Review-The Compensation-Productivity Gap: A Visual Essay-January 2011
- Demos-Why is Washington Reducing the Deficit Instead of Creating Jobs? – December 2012
- Economic Policy Institute-State of Working America 12th Edition-2012
- BLS Economists Moncarz and Wolf: Service-providing occupations, offshoring and the labor market-Monthly Labor Review-December 2008
- Wells Fargo Economics-2013 Economics Outlook-December 2013
- Center on Budget and Policy Priorities-December 2012 Jobs Report
- President's Council on Jobs and Competitiveness-Interim Report-October 2011
- Economic Report of the President – Chapter 4 – Jobs, Workers and Skills
- McKinsey Global Institute-An Economy that Works, Job Creation and America's Future-June 2011
- Congressional Research Service - The Increase in Unemployment Since 2007 - Is it Cyclical or Structural?-April 2011