List of countries by carbon dioxide emissions
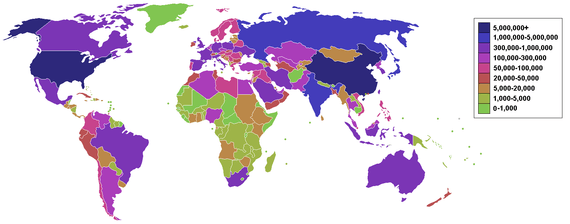
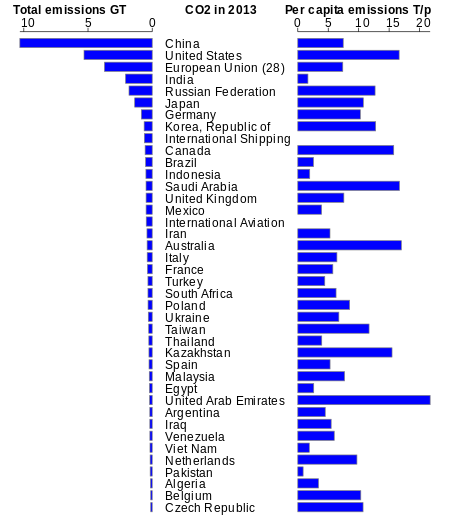


This is a list of sovereign states and territories by carbon dioxide emissions due to certain forms of human activity, based on the EDGAR database created by European Commission and Netherlands Environmental Assessment Agency released in 2014. The following table lists the 2014 annual CO2 emissions estimates (in thousands of CO2 tonnes) along with a list of emissions per capita (in tonnes of CO2 per year) from same source. The data only considers carbon dioxide emissions from the burning of fossil fuels and cement manufacture, but not emissions from land use, land-use change and forestry. Emissions from international shipping or bunker fuels are also not included in national figures,[1] which can make a huge difference for small countries with important ports. The top 10 largest emitter countries account for 68.2% of the world total. Other powerful, more potent greenhouse gases are not included in this data, including methane.
| Country | CO2 emissions (kt) in 2014[2] | % CO2 emissions by country | Emission per capita (t) in 2014[3] |
|---|---|---|---|
| World | 35,669,000 | 100% | 5.0 |
| | 10,540,000 | 29.55% | 7.6 |
| | 5,334,000 | 14.95% | 16.5 |
| | 3,415,000 | 9.57% | 6.7 |
| | 2,341,000 | 6.56% | 1.8 |
| | 1,766,000 | 4.95% | 12.4 |
| | 1,278,000 | 3.58% | 10.1 |
| | 767,000 | 2.15% | 9.3 |
| International Shipping | 624,000 | 1.74% | — |
| | 618,000 | 1.73% | 7.9 |
| | 610,000 | 1.71% | 12.3 |
| | 565,000 | 1.58% | 15.9 |
| | 501,000 | 1.40% | 2.5 |
| | 494,000 | 1.38% | 16.8 |
| International Aviation | 492,000 | 1.38% | — |
| | 456,000 | 1.28% | 3.7 |
| | 452,000 | 1.27% | 1.8 |
| | 415,000 | 1.16% | 6.5 |
| | 409,000 | 1.15% | 17.3 |
| | 392,000 | 1.10% | 7.4 |
| | 353,000 | 0.99% | 4.7 |
| | 337,000 | 0.94% | 5.5 |
| | 323,000 | 0.91% | 5.0 |
| | 298,000 | 0.84% | 7.8 |
| | 277,000 | 0.78% | 11.8 |
| | 272,000 | 0.76% | 4.0 |
| | 249,000 | 0.70% | 5.5 |
| | 242,000 | 0.68% | 5.1 |
| | 236,000 | 0.66% | 14.2 |
| | 227,000 | 0.64% | 7.5 |
| | 225,000 | 0.63% | 2.7 |
| | 201,000 | 0.56% | 21.3 |
| | 199,000 | 0.56% | 4.8 |
| | 195,000 | 0.55% | 6.3 |
| | 190,000 | 0.53% | 2.1 |
| | 158,000 | 0.44% | 0.9 |
| | 158,000 | 0.44% | 9.4 |
| | 141,000 | 0.40% | 3.5 |
| | 139,000 | 0.39% | 4.0 |
| | 123,000 | 0.34% | 4.2 |
| | 112,000 | 0.31% | 10.4 |
| | 99,000 | 0.28% | 28.33 |
| | 97,000 | 0.27% | 8.7 |
| | 97,000 | 0.27% | 1.0 |
| | 94,000 | 0.26% | 0.5 |
| | 89,000 | 0.25% | 39.13 |
| | 79,000 | 0.22% | 4.4 |
| | 78,000 | 0.22% | 3.6 |
| | 74,000 | 0.21% | 18.92 |
See also
- List of countries by carbon dioxide emissions per capita
- List of countries by carbon intensity
- List of countries by electricity production from renewable sources
- List of countries by greenhouse gas emissions
- List of countries by greenhouse gas emissions per capita
- List of countries by ratio of GDP to carbon dioxide emissions
General:
Notes and references
- ↑ Schrooten, L; De Vlieger, Ina; Int Panis, Luc; Styns, R. Torfs, K; Torfs, R (2008). "Inventory and forecasting of maritime emissions in the Belgian sea territory, an activity based emission model". Atmospheric Environment. 42: 667–676. doi:10.1016/j.atmosenv.2007.09.071.
- ↑ "CO2 time series 1990-2014 per region/country". Netherlands Environmental Assessment Agency. Retrieved 2015-11-30.
- ↑ "CO2 time series 1990-2014 per capita for world countries". Netherlands Environmental Assessment Agency. Retrieved 2015-11-30.
External links
The contents of this article comes from the latest figures from the millennium indicators as of 2009-07-14:
- United Nation Statistics Division
- GHG data from UNFCCC - United Nations Framework Convention on Climate Change GHG emissions data
- Breathing Earth - A visual real-time simulation that uses this CO2 emissions data
- Google - public data "CO2 emissions (kt)"
- Google - public data "CO2 emissions (tonne per capita)"
- World CO2 Emissions | Tableau Public