Candlestick pattern
In technical analysis, a candlestick pattern is a movement in prices shown graphically on a candlestick chart that some believe can predict a particular market movement. The recognition of the pattern is subjective and programs that are used for charting have to rely on predefined rules to match the pattern. There are 42 recognised patterns that can be split into simple and complex patterns.
History
Some of the earliest technical trading analysis was used to track prices of rice in the 17th century. Much of the credit for candlestick charting goes to Munehisa Homma (1724–1803), a rice merchant from Sakata, Japan who traded in the Ojima Rice market in Osaka during the Tokugawa Shogunate. According to Steve Nison, however, candlestick charting came later, probably beginning after 1850.[1]
Formation of candlestick

Candlesticks are graphical representations of price movements for a given period of time. They are commonly formed by the opening, high, low, and closing prices of a financial instrument.
If the opening price is above the closing price then a filled (normally red or black) candlestick is drawn.
If the closing price is above the opening price, then normally a green or a hollow candlestick (white with black outline) is shown.
The filled or hollow portion of the candle is known as the body or real body, and can be long, normal, or short depending on its proportion to the lines above or below it.
The lines above and below, known as shadows, tails, or wicks represent the high and low price ranges within a specified time period. However, not all candlesticks have shadows.
Simple patterns
 | Big Black Candle Has an unusually long black body with a wide range between high and low. Prices open near the high and close near the low. Considered a bearish pattern. |  | Big White Candle Has an unusually long white body with a wide range between high and low of the day. Prices open near the low and close near the high. Considered a bullish pattern. |
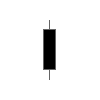 | Black Body Formed when the opening price is higher than the closing price. Considered to be a bearish signal. |  | Doji Formed when opening and closing prices are virtually the same. The lengths of shadows can vary. |
 | Dragonfly Doji Formed when the opening and the closing prices are at the highest of the day. If it has a longer lower shadow it signals a more bullish trend. When appearing at market bottoms it is considered to be a reversal signal. | 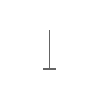 | Gravestone Doji Formed when the opening and closing prices are at the lowest of the day. If it has a longer upper shadow it signals a bearish trend. When it appears at market top it is considered a reversal signal. |
 | Long-Legged Doji Consists of a Doji with very long upper and lower shadows. Indicates strong forces balanced in opposition. |  | Hanging Man A black or a white candlestick that consists of a small body near the high with a little or no upper shadow and a long lower tail. The lower tail should be two or three times the height of the body. Considered a bearish pattern during an uptrend. |
 | Hammer A black or a white candlestick that consists of a small body near the high with a little or no upper shadow and a long lower tail. Considered a bullish pattern during a downtrend. | 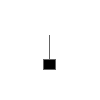 | Inverted Black Hammer A black body in an upside-down hammer position. Usually considered a bottom reversal signal. |
 | Inverted Hammer A black or a white candlestick in an upside-down hammer position. |  | Long Lower Shadow A black or a white candlestick is formed with a lower tail that has a length of 2/3 or more of the total range of the candlestick. Normally considered a bullish signal when it appears around price support levels. |
 | Long Upper Shadow A black or a white candlestick with an upper shadow that has a length of 2/3 or more of the total range of the candlestick. Normally considered a bearish signal when it appears around price resistance levels. |  | Marubozu A long or a normal candlestick (black or white) with no shadow or tail. The high and the lows represent the opening and the closing prices. Considered a continuation pattern. |
 | Shooting Star A black or a white candlestick that has a small body, a long upper shadow and a little or no lower tail. Considered a bearish pattern in an uptrend. |  | Spinning Top A black or a white candlestick with a small body. The size of shadows can vary. Interpreted as a neutral pattern but gains importance when it is part of other formations. |
 | White Body Formed when the closing price is higher than the opening price and considered a bullish signal. |  | Shaven Bottom A black or a white candlestick with no lower tail. [Compare with Inverted Hammer.] |
 | Shaven Head A black or a white candlestick with no upper shadow. [Compared with hammer.] |
Complex patterns
 | Bearish Harami Consists of an unusually large white body followed by a small black body (contained within large white body). It is considered as a bearish pattern when preceded by an uptrend. |  | Bearish Harami Cross A large white body followed by a Doji. Considered as a reversal signal when it appears at the top. |
 | Bearish 3-Method Formation A long black body followed by three small bodies (normally white) and a long black body. The three white bodies are contained within the range of first black body. This is considered as a bearish continuation pattern. |  | Bullish 3-Method Formation Consists of a long white body followed by three small bodies (normally black) and a long white body. The three black bodies are contained within the range of first white body. This is considered as a bullish continuation pattern. |
| ₨† | |||
 | Bullish Harami Consists of an unusually large black body followed by a small white body (contained within large black body). It is considered as a bullish pattern when preceded by a downtrend. |  | Bullish Harami Cross A large black body followed by a Doji. It is considered as a reversal signal when it appears at the bottom. |
 | Dark Cloud Cover Consists of a long white candlestick followed by a black candlestick that opens above the high of the white candlestick and closes well into the body of the white candlestick. It is considered as a bearish reversal signal during an uptrend. |  | Engulfing Bearish Line Consists of a small white body that is contained within the followed large black candlestick. When it appears at top it is considered as a major reversal signal. |
 | Engulfing Bullish Consists of a small black body that is contained within the followed large white candlestick. When it appears at bottom it is interpreted as a major reversal signal. |  | Evening Doji Star Consists of three candlesticks. First is a large white body candlestick followed by a Doji that gap above the white body. The third candlestick is a black body that closes well into the white body. When it appears at the top it is considered as a reversal signal. It signals more bearish trend than the evening star pattern because of the doji that has appeared between the two bodies. |
 | Evening Star Consists of a large white body candlestick followed by a small body candlestick (black or white) that gaps above the previous. The third is a black body candlestick that closes well within the large white body. It is considered as a reversal signal when it appears at top level. | 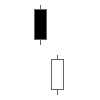 | Falling Window A window (gap) is created when the high of the second candlestick is below the low of the preceding candlestick. It is considered that the window should be filled with a probable resistance. |
 | Morning Doji Star Consists of a large black body candlestick followed by a Doji that occurred below the preceding candlestick. On the following day, a third white body candlestick is formed that closed well into the black body candlestick which appeared before the Doji. It is considered as a major reversal signal that is more bullish than the regular morning star pattern because of the existence of the Doji. |  | Morning Star Consists of a large black body candlestick followed by a small body (black or white) that occurred below the large black body candlestick. On the following day, a third white body candlestick is formed that closed well into the black body candlestick. It is considered as a major reversal signal when it appears at bottom. |
 | On Neckline In a downtrend, Consists of a black candlestick followed by a small body white candlestick with its close near the low of the preceding black candlestick. It is considered as a bearish pattern when the low of the white candlestick is penetrated. |  | Three Black Crows Consists of three long black candlesticks with consecutively lower closes. The closing prices are near to or at their lows. When it appears at top it is considered as a top reversal signal. |
 | Three White Soldiers Consists of three long white candlesticks with consecutively higher closes. The closing prices are near to or at their highs. When it appears at bottom it is interpreted as a bottom reversal signal. |  | Tweezer Bottoms Consists of two or more candlesticks with matching bottoms. The candlesticks may or may not be consecutive and the sizes or the colours can vary. It is considered as a minor reversal signal that becomes more important when the candlesticks form another pattern. |
 | Tweezer Tops Consists of two or more candlesticks with matching tops. The candlesticks may or may not be consecutive and the sizes or the colours can vary. It is considered as a minor reversal signal that becomes more important when the candlesticks form another pattern. |  | Doji Star Consists of a black or a white candlestick followed by a Doji that gap above or below these. It is considered as a reversal signal with confirmation during the next trading day. |
 | Piercing Line Consists of a black candlestick followed by a white candlestick that opens lower than the low of preceding but closes more than halfway into black body candlestick. It is considered as reversal signal when it appears at bottom. | 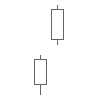 | Rising Window A window (gap) is created when the low of the second candlestick is above the high of the preceding candlestick. It is considered that the window should provide support to the selling pressure. |
See also
Further reading
- Lebeau, Charles (1991). Technical Traders Guide to Computer Analysis of the Futures Markets.
References
- ↑ "Introduction to Candlesticks". StockCharts. Stockcharts.com. Retrieved 29 June 2016.
External links
- Bulkowski's Stock Market Patterns. On line, includes research, statistical validation, and follow-on results.
- HotCandlestick.com Glossary of Patterns. Daily and Weekly results of common candlestick patterns, flashcard game.