California's 39th State Senate district
| California's 39th State Senate district | ||
|---|---|---|
.svg.png) | ||
| Current senator | Marty Block (D–San Diego) | |
| Registration | 39.75% Democratic | |
| Demographics | 59.22% White | |
| Population (2010) • Voting age • Citizen voting age |
928,044 764,337 685,425 | |
| Registered voters | 512,672 | |
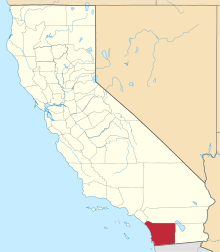
California's 39th State Senate district is one of 40 California State Senate districts. It is currently represented by Democrat Marty Block of San Diego.
District profile
The district encompasses most of the city of San Diego, along with several inner suburbs to the north and south. It is centered on Downtown San Diego and mainly stretches along the city's coastline, including part of San Diego Bay.
|
Election results from statewide races
| Year | Office | Results |
|---|---|---|
| 2014 | Governor | Brown 58.3 – 41.7% |
| 2012 | President | Obama 58.8 – 38.8% |
| Senator | Feinstein 61.0 – 39.0% | |
| 2010 | Governor | Brown 54.6 – 39.7% |
| Senator | Boxer 54.7 – 39.5% | |
| 2008 | President | Obama 64.8 – 33.4% |
| 2006 | Governor | Schwarzenegger 57.0 – 37.9% |
| Senator | Feinstein 63.8 – 31.5% | |
| 2004 | President | Kerry 57.6 – 41.3% |
| Senator | Boxer 61.2 – 34.1% | |
| 2003 | Recall | No 55.6 – 44.4% |
| Schwarzenegger 50.7 – 30.8% | ||
| 2002 | Governor | Davis 49.3 – 42.0% |
| 2000 | President | Gore 52.0 – 42.3% |
| Senator | Feinstein 58.0 – 34.6% | |
| 1998 | Governor | Davis 54.3 – 40.9% |
| Senator | Boxer 51.4 – 44.2% | |
| 1996 | President | Clinton 48.8 – 40.5% |
| 1994 | Governor | Wilson 57.9 – 37.8% |
| Senator | Huffington 46.8 – 45.0% | |
| 1992 | President | Clinton 42.7 – 31.7% |
| Senator | Boxer 48.7 – 42.0% | |
| Senator | Feinstein 53.3 – 39.2% |
Election results
2016
| California State Senate election, 2016 | ||||
|---|---|---|---|---|
| Primary election | ||||
| Party | Candidate | Votes | % | |
| Democratic | Toni Atkins | |||
| Republican | J. Bribiesca | |||
| Republican | Richard M. Fago | |||
| Republican | John Renison | |||
| Total votes | ' | ' | ||
2012
| California State Senate elections, 2012 | ||||
|---|---|---|---|---|
| Primary election | ||||
| Party | Candidate | Votes | % | |
| Democratic | Marty Block | 85,930 | 46.3 | |
| Republican | George Plescia | 81,214 | 43.7 | |
| Democratic | Patrick L. Marsh | 18,510 | 10.0 | |
| Total votes | 185,654 | 100.0 | ||
| General election | ||||
| Democratic | Marty Block | 221,012 | 58.4 | |
| Republican | George Plescia | 157,305 | 41.6 | |
| Total votes | 378,317 | 100.0 | ||
| Democratic hold | ||||
2008
| Party | Candidate | Votes | % | |
|---|---|---|---|---|
| Democratic | Christine Kehoe (incumbent) | 227,475 | 65.21 | |
| Republican | Jeff Perwin | 108,606 | 31.13 | |
| Libertarian | Jesse Thomas | 12,742 | 3.65 | |
| Total votes | 348,823 | 100.00 | ||
| Democratic hold | ||||
2004
| Party | Candidate | Votes | % | |
|---|---|---|---|---|
| Democratic | Christine Kehoe | 200,737 | 60.0 | |
| Republican | Larry Stirling | 118,417 | 35.4 | |
| Libertarian | John Murphy | 15,552 | 4.6 | |
| Total votes | 334,706 | 100.0 | ||
| Democratic hold | ||||
2000
| Party | Candidate | Votes | % | |
|---|---|---|---|---|
| Democratic | Deirdre "Dede" Alpert (incumbent) | 160,834 | 56.3 | |
| Republican | Larry Stirling | 112,454 | 39.4 | |
| Libertarian | Roger A. Nichols | 6,474 | 2.3 | |
| Natural Law | Stuart Knoles | 5,973 | 2.0 | |
| Total votes | 285,735 | 100.0 | ||
| Democratic hold | ||||
1996
| Party | Candidate | Votes | % | |
|---|---|---|---|---|
| Democratic | Deirdre "Dede" Alpert | 142,722 | 51.7 | |
| Republican | Joe Dolphin | 126,653 | 45.9 | |
| Natural Law | Stuart Knoles | 6,533 | 2.4 | |
| Total votes | 275,908 | 100.0 | ||
| Democratic gain from Independent | ||||
1992
| Party | Candidate | Votes | % | |
|---|---|---|---|---|
| Independent | Lucy Killea (incumbent) | 187,353 | 60.4 | |
| Republican | Jim Ellis | 102,419 | 33.0 | |
| Peace and Freedom | Patricia Cofre | 10,844 | 3.5 | |
| Libertarian | John P. Moody | 9,553 | 3.1 | |
| Total votes | 310,169 | 100.0 | ||
| Independent hold | ||||
See also
External links
| General |  | |
|---|---|---|
| Sites | ||
This article is issued from Wikipedia - version of the 11/12/2016. The text is available under the Creative Commons Attribution/Share Alike but additional terms may apply for the media files.