California's 33rd congressional district
| California's 33rd congressional district | ||
|---|---|---|
.tif.png) | ||
| Current Representative | Ted Lieu (D–Torrance) | |
| Area | 48 mi2 | |
| Median income | $61,273[1] | |
| Ethnicity | 68.5% White, 2.8% Black, 13.5% Asian, 11.2% Hispanic, 4.0[2]% other | |
| Cook PVI | D+11 | |
California's 33rd congressional district is a congressional district in the U.S. state of California based in Los Angeles County. The district is currently represented by Democrat Ted Lieu. In 2014, after 40 years in Congress, previous representative Henry Waxman announced his retirement. State Senator Ted Lieu succeeded Henry Waxman in Congress in January 2015, after having defeated Los Angeles County deputy district attorney Elan Carr in the November 4 general election.
Geography
The district includes cities, communities, and districts on the Westside of Los Angeles, the South Bay beach cities including portions of Torrance and the entire Palos Verdes Peninsula within Los Angeles County. They include:
- Agoura Hills
- Bel Air
- Beverly Hills
- Brentwood
- El Segundo
- Fairfax District, Los Angeles
- Hermosa Beach
- Holmby Hills
- Malibu
- Manhattan Beach
- Marina del Rey
- Pacific Palisades
- Palos Verdes Estates
- Playa del Rey
- Rancho Palos Verdes
- Redondo Beach
- Rolling Hills
- Rolling Hills Estates
- Santa Monica
- Santa Monica Mountains communities and parks
- Topanga
- Torrance (90505 zip code)
- University of California, Los Angeles campus
- Venice
- Westwood
History
From 2003 to 2013, the district encompassed the incorporated city of Culver City (a center of film and TV production), and in the Baldwin Hills unincorporated areas such as Ladera Heights, and some of the western neighborhoods within the city of Los Angeles such as Baldwin Hills (neighborhood).
People announcing their campaigns for this seat in the 2014 election cycle include: author Marianne Williamson, director Brent Roske, producer/historian Vince Flaherty and Deputy District Attorney for L.A. County Elan Carr.[3]
Voting
| Election results from statewide races | ||
|---|---|---|
| Year | Office | Results |
| 2010 | Governor | Brown 82.9 - 13.4% |
| Senator | Boxer 83.2 - 13.0% | |
| 2008 | President[4] | Obama 86.8 - 11.7% |
| 2006 | Governor[5] | Angelides 69.4 - 25.6% |
| Senator[6] | Feinstein 83.7 - 10.8% | |
| 2004 | President[7] | Kerry 82.8 - 15.9% |
| Senator[8] | Boxer 83.5 - 11.7% | |
| 2003 | Recall[9][10] | No 74.2 - 25.8% |
| Bustamante 57.0 - 24.5% | ||
| 2002 | Governor[11] | Davis 74.7 - 15.2% |
| 2000 | President[12] | Gore 82.6 - 14.9% |
| Senator[13] | Feinstein 81.7 - 11.4% | |
| 1998 | Governor | |
| Senator | ||
| 1996 | President | |
| 1994 | Governor | |
| Senator | ||
| 1992 | President | Clinton 63.0 - 23.6% |
| Senator | Boxer 59.3 - 29.9% | |
| Senator | Feinstein 65.8 - 25.9% | |
List of representatives
| Representative | Party | Years | Notes | Counties |
|---|---|---|---|---|
| District created | January 3, 1963 | |||
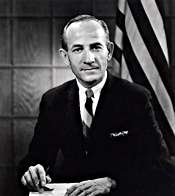
 Harry R. Sheppard Harry R. Sheppard |
Democratic | January 3, 1963 – January 3, 1965 |
Redistricted from the 27th district Retired |
San Bernardino |
 Kenneth W. Dyal Kenneth W. Dyal |
Democratic | January 3, 1965 – January 3, 1967 |
Lost re-election | |
 Jerry Pettis Jerry Pettis |
Republican | January 3, 1967 – January 3, 1975 |
Redistricted to the 37th district | |
 Del M. Clawson Del M. Clawson |
Republican | January 3, 1975 – December 31, 1978 |
Redistricted from the 23rd district Resigned |
Los Angeles |
| Vacant | December 31, 1978 – January 3, 1979 |
|||
 Wayne R. Grisham Wayne R. Grisham |
Republican | January 3, 1979 – January 3, 1983 |
Lost re-nomination | |
 David Dreier David Dreier |
Republican | January 3, 1983 – January 3, 1993 |
Redistricted from the 35th district Redistricted to the 28th district |
Los Angeles (eastern suburbs) |
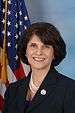 Lucille Roybal-Allard Lucille Roybal-Allard |
Democratic | January 3, 1993 – January 3, 2003 |
Redistricted to the 34th district | Los Angeles (Downtown L.A.) |
 Diane Watson Diane Watson |
Democratic | January 3, 2003 – January 3, 2011 |
Redistricted from the 32nd district Retired |
Los Angeles (Culver City, Ladera Heights, and Baldwin Hills) |
 Karen Bass Karen Bass |
Democratic | January 3, 2011 – January 3, 2013 |
Redistricted to the 37th district | |
 Henry Waxman Henry Waxman |
Democratic | January 3, 2013 – January 3, 2015 |
Redistricted from the 30th district Retired |
Los Angeles (Beverly Hills and Santa Monica) |
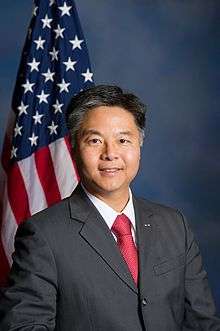 Ted Lieu Ted Lieu |
Democratic | January 3, 2015 – | ||
Election results
|
1962 • 1964 • 1966 • 1968 • 1970 • 1972 • 1974 • 1976 • 1978 • 1980 • 1982 • 1984 • 1986 • 1988 • 1990 • 1992 • 1994 • 1996 • 1998 • 2000 • 2002 • 2004 • 2006 • 2008 • 2010 • 2012 |
1962
| Party | Candidate | Votes | % | |
|---|---|---|---|---|
| Democratic | Harry R. Sheppard (inc.) | 96,192 | 59.0 | |
| Republican | William R. Thomas | 66,764 | 41.0 | |
| Total votes | 162,956 | 100.0 | ||
| Voter turnout | % | |||
| Democratic hold | ||||
1964
| Party | Candidate | Votes | % | |
|---|---|---|---|---|
| Democratic | Kenneth W. Dyal | 109,047 | 51.7 | |
| Republican | Jerry Pettis | 101,742 | 48.3 | |
| Total votes | 210,789 | 100.0 | ||
| Voter turnout | % | |||
| Democratic hold | ||||
1966
| Party | Candidate | Votes | % | |||
|---|---|---|---|---|---|---|
| Republican | Jerry Pettis | 102,401 | 53.5 | |||
| Democratic | Kenneth W. Dyal (incumbent) | 89,071 | 46.5 | |||
| Total votes | 191,472 | 100.0 | ||||
| Voter turnout | % | |||||
| Republican gain from Democratic | ||||||
1968
| Party | Candidate | Votes | % | |
|---|---|---|---|---|
| Republican | Jerry Pettis (incumbent) | 123,426 | 66.3 | |
| Democratic | Al C. Bellard | 59,619 | 32.0 | |
| American Independent | Earl D. Wallen | 3,171 | 1.7 | |
| Total votes | 186,216 | 100.0 | ||
| Voter turnout | % | |||
| Republican hold | ||||
1970
| Party | Candidate | Votes | % | |
|---|---|---|---|---|
| Republican | Jerry Pettis (incumbent) | 116,093 | 72.2 | |
| Democratic | Chester M. Wright | 44,764 | 27.8 | |
| Total votes | 160,857 | 100.0 | ||
| Voter turnout | % | |||
| Republican hold | ||||
1972
| Party | Candidate | Votes | % | |
|---|---|---|---|---|
| Republican | Jerry Pettis (incumbent) | 140,304 | 75.1 | |
| Democratic | Ken Thompson | 46,626 | 24.9 | |
| Total votes | 186,930 | 100.0 | ||
| Voter turnout | % | |||
| Republican hold | ||||
1974
| Party | Candidate | Votes | % | |
|---|---|---|---|---|
| Republican | Del M. Clawson (incumbent) | 71,054 | 53.4 | |
| Democratic | Robert E. "Bob" White | 57,423 | 43.1 | |
| American Independent | James C. "Jim" Griffin | 4,636 | 3.5 | |
| Total votes | 133,113 | 100.0 | ||
| Voter turnout | % | |||
| Republican hold | ||||
1976
| Party | Candidate | Votes | % | |
|---|---|---|---|---|
| Republican | Del M. Clawson (incumbent) | 95,398 | 55.1 | |
| Democratic | Ted Snyder | 77,807 | 44.9 | |
| Total votes | 173,205 | 100.0 | ||
| Voter turnout | % | |||
| Republican hold | ||||
1978
| Party | Candidate | Votes | % | |
|---|---|---|---|---|
| Republican | Wayne R. Grisham | 79,533 | 56 | |
| Democratic | Dennis S. Kazarian | 62,540 | 44 | |
| Total votes | 142,073 | 100.0 | ||
| Voter turnout | % | |||
| Republican hold | ||||
1980
| Party | Candidate | Votes | % | |
|---|---|---|---|---|
| Republican | Wayne R. Grisham (inc.) | 122,439 | 70.9 | |
| Democratic | Fred L. Anderson | 50,365 | 29.1 | |
| Total votes | 172,804 | 100.0 | ||
| Voter turnout | % | |||
| Republican hold | ||||
1982
| Party | Candidate | Votes | % | |
|---|---|---|---|---|
| Republican | David Dreier (incumbent) | 112,362 | 65.2 | |
| Democratic | Paul Servelle | 55,514 | 32.2 | |
| Libertarian | Phillips B. Franklin | 2,251 | 1.3 | |
| Peace and Freedom | James Michael "Mike" Noonan | 2,223 | 1.3 | |
| Total votes | 172,350 | 100.0 | ||
| Voter turnout | % | |||
| Republican hold | ||||
1984
| Party | Candidate | Votes | % | |
|---|---|---|---|---|
| Republican | David Dreier (incumbent) | 147,363 | 70.6 | |
| Democratic | Claire K. McDonald | 54,147 | 26.0 | |
| Libertarian | Gail Lightfoot | 4,738 | 2.3 | |
| Peace and Freedom | James Michael "Mike" Noonan | 2,371 | 1.1 | |
| Total votes | 208,619 | 100.0 | ||
| Voter turnout | % | |||
| Republican hold | ||||
1986
| Party | Candidate | Votes | % | |
|---|---|---|---|---|
| Republican | David Dreier (incumbent) | 118,541 | 71.7 | |
| Democratic | Monty Hempel | 44,312 | 26.8 | |
| Peace and Freedom | James Michael "Mike" Noonan | 2,500 | 1.5 | |
| Total votes | 165,353 | 100.0 | ||
| Voter turnout | % | |||
| Republican hold | ||||
1988
| Party | Candidate | Votes | % | |
|---|---|---|---|---|
| Republican | David Dreier (incumbent) | 151,704 | 69.2 | |
| Democratic | Nelson Gentry | 57,586 | 26.2 | |
| Libertarian | Gail Lightfoot | 6,601 | 3.0 | |
| Peace and Freedom | James Michael "Mike" Noonan | 3,492 | 1.6 | |
| Total votes | 219,383 | 100.0 | ||
| Voter turnout | % | |||
| Republican hold | ||||
1990
| Party | Candidate | Votes | % | |
|---|---|---|---|---|
| Republican | David Dreier (incumbent) | 101,336 | 63.7 | |
| Democratic | Georgia Houston Webb | 49,981 | 31.4 | |
| Libertarian | Gail Lightfoot | 7,840 | 4.9 | |
| Total votes | 159,157 | 100.0 | ||
| Voter turnout | % | |||
| Republican hold | ||||
1992
| Party | Candidate | Votes | % | ||
|---|---|---|---|---|---|
| Democratic | Lucille Roybal-Allard | 32,010 | 63.0 | ||
| Republican | Robert Guzman | 15,428 | 30.4 | ||
| Peace and Freedom | Tim Delia | 2,135 | 4.2 | ||
| Libertarian | Dale S. Olvera | 1,206 | 2.4 | ||
| Total votes | 50,779 | 100.0 | |||
| Voter turnout | % | ||||
| Democratic win (new seat) | |||||
1994
| Party | Candidate | Votes | % | |
|---|---|---|---|---|
| Democratic | Lucille Roybal-Allard (inc.) | 33,814 | 81.46 | |
| Peace and Freedom | Kermit Booker | 7,694 | 18.54 | |
| Total votes | 41,508 | 100.0 | ||
| Voter turnout | % | |||
| Democratic hold | ||||
1996
| Party | Candidate | Votes | % | |
|---|---|---|---|---|
| Democratic | Lucille Roybal-Allard (inc.) | 47,478 | 82.2 | |
| Republican | John Leonard | 8,147 | 14.0 | |
| Libertarian | Howard Johnson | 2,203 | 3.8 | |
| Total votes | 57,828 | 100.0 | ||
| Voter turnout | % | |||
| Democratic hold | ||||
1998
| Party | Candidate | Votes | % | |
|---|---|---|---|---|
| Democratic | Lucille Roybal-Allard (inc.) | 43,310 | 87.19 | |
| Republican | Wayne Miller | 6,364 | 12.81 | |
| Total votes | 49,674 | 100.0 | ||
| Voter turnout | % | |||
| Democratic hold | ||||
2000
| Party | Candidate | Votes | % | |
|---|---|---|---|---|
| Democratic | Lucille Roybal-Allard (inc.) | 60,510 | 84.6 | |
| Republican | Wayne Miller | 8,260 | 11.6 | |
| Libertarian | Nathan Thomas Craddock | 1,601 | 2.2 | |
| Natural Law | William Harpur | 1,200 | 1.6 | |
| Total votes | 71,571 | 100.0 | ||
| Voter turnout | % | |||
| Democratic hold | ||||
2002
| Party | Candidate | Votes | % | |
|---|---|---|---|---|
| Democratic | Diane Watson (incumbent) | 97,779 | 82.6 | |
| Republican | Andrew Kim | 16,699 | 14.1 | |
| Libertarian | Charles Tate | 3,971 | 3.3 | |
| Total votes | 118,449 | 100.0 | ||
| Voter turnout | % | |||
| Democratic hold | ||||
2004
| Party | Candidate | Votes | % | |
|---|---|---|---|---|
| Democratic | Diane Watson (incumbent) | 166,801 | 88.6 | |
| Libertarian | Robert G. Weber, Jr. | 21,513 | 11.4 | |
| Total votes | 188,314 | 100.0 | ||
| Voter turnout | % | |||
| Democratic hold | ||||
2006
| Party | Candidate | Votes | % | |
|---|---|---|---|---|
| Democratic | Diane Watson (incumbent) | 113,715 | 100.0 | |
| Voter turnout | % | |||
| Democratic hold | ||||
2008
| Party | Candidate | Votes | % | |
|---|---|---|---|---|
| Democratic | Diane Watson (incumbent) | 186,924 | 87.57 | |
| Republican | David Crowley | 26,536 | 12.43 | |
| Total votes | 213,460 | 100.00 | ||
| Voter turnout | 70.19% | |||
| Democratic hold | ||||
2010
| Party | Candidate | Votes | % | |
|---|---|---|---|---|
| Democratic | Karen Bass | 131,990 | 86.08 | |
| Republican | James L. Andion | 21,342 | 13.92 | |
| Total votes | 153,332 | 100.0 | ||
| Democratic hold | ||||
2012
| Party | Candidate | Votes | % | |
|---|---|---|---|---|
| Democratic | Henry Waxman | 171,860 | 54% | |
| Independent | Bill Bloomfield | 146,660 | 46% | |
| Total votes | 318,520 | 100% | ||
| Democratic hold | ||||
2014
| Party | Candidate | Votes | % | |
|---|---|---|---|---|
| Democratic | Ted Lieu | 85,144 | 58% | |
| Republican | Elan Carr | 60,962 | 42% | |
| Total votes | 146,106 | 100% | ||
| Democratic hold | ||||
2016
| Party | Candidate | Votes | % | |
|---|---|---|---|---|
| Democratic | Ted Lieu | 144,541 | 66.3% | |
| Republican | Kenneth W. Wright | 73,433 | 33.7% | |
| Total votes | 217,974 | 100% | ||
| Democratic hold | ||||
Living former Members
As of April 2015, there are five former members of the U.S. House of Representatives from California's 33rd congressional district that are currently living.
| Representative | Term in office | Date of birth (and age) |
|---|---|---|
| David Dreier | 1983 - 1993 | July 5, 1952 |
| Lucille Roybal-Allard | 1993 - 2003 | June 12, 1941 |
| Diane Watson | 2003 - 2011 | November 12, 1933 |
| Karen Bass | 2011 - 2013 | October 3, 1953 |
| Henry Waxman | 2013 - 2015 | September 12, 1939 |
Historical district boundaries

See also
References
- ↑ http://bigstory.ap.org/article/party-rich-congress-its-democrats
- ↑ http://www.latimes.com/la-redistricting-map-july-2011,0,5339409.htmlstory#39.71057374407184,-118.14590136718749,5,usCongress,,,current
- ↑ Elan Carr for Congress (2014)
- ↑ (2008 President)
- ↑ Statement of Vote (2006 Governor)
- ↑ Statement of Vote (2006 Senator)
- ↑ Statement of Vote (2004 President)
- ↑ Statement of Vote (2004 Senator)
- ↑ Statement of Vote (2003 Recall Question)
- ↑ Statement of Vote (2003 Governor)
- ↑ Statement of Vote (2002 Governor)
- ↑ Statement of Vote (2000 President)
- ↑ Statement of Vote (2000 Senator)
- ↑ 1962 election results
- ↑ 1964 election results
- ↑ 1966 election results
- ↑ 1968 election results
- ↑ 1970 election results
- ↑ 1972 election results
- ↑ 1974 election results
- ↑ 1976 election results
- ↑ 1978 election results
- ↑ 1980 election results
- ↑ 1982 election results
- ↑ 1984 election results
- ↑ 1986 election results
- ↑ 1988 election results
- ↑ 1990 election results
- ↑ 1992 election results
- ↑ 1994 election results
- ↑ 1996 election results
- ↑ 1998 election results
- ↑ 2000 election results
- ↑ 2002 general election results Archived February 3, 2009, at the Wayback Machine.
- ↑ 2004 general election results
- ↑ 2006 general election results Archived November 27, 2008, at the Wayback Machine.
- ↑ 2008 general election results
- ↑ 2010 general election results
- ↑ 2012 general election results
- ↑ 2014 general election results for CA-33
- ↑ 2016 general election results for CA-33
Further reading
- Mark Leibovich (April 24, 2014), "Real House Candidates of Beverly Hills", New York Times
External links
- GovTrack.us: Current map of California's 33rd congressional district
- GovTrack.us: Representative Henry Waxman
- RAND California Election Returns: District Definitions
Coordinates: 34°02′49″N 118°47′00″W / 34.04694°N 118.78333°W