California's 29th congressional district
| California's 29th congressional district | ||
|---|---|---|
.tif.png) | ||
| Current Representative | Tony Cárdenas (D–Los Angeles) | |
| Ethnicity | 18.4% White, 3.6% Black, 7.5% Asian, 68.7% Hispanic, 1.7[1]% other | |
| Cook PVI | D+25 | |
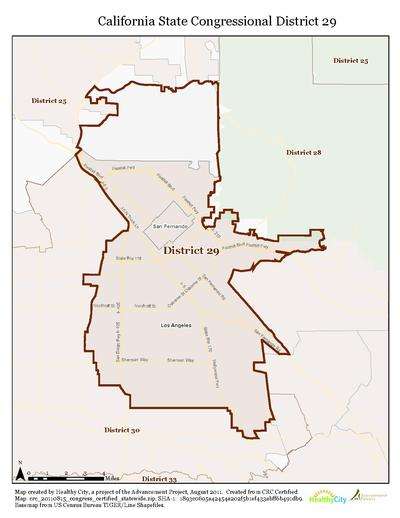
California's 29th congressional district is a congressional district in the U.S. state of California based in the north central San Fernando Valley, including the communities of Van Nuys, San Fernando, Pacoima, Arleta, Panorama City, Sylmar, and parts of Sun Valley, and North Hollywood. The district is represented by Democrat Tony Cárdenas.
Voting
| Election results from statewide races | ||
|---|---|---|
| Year | Office | Results |
| 2012 | President | Obama 77.0 - 20.5% |
| 2010 | Governor | Brown 61.0 - 34.5% |
| Senator | Boxer 60.7 - 34.8% | |
| 2008 | President[2] | Obama 67.6 - 30.4% |
| 2006 | Governor[3] | Schwarzenegger 50.3 - 44.4% |
| Senator[4] | Feinstein 64.0 - 30.7% | |
| 2004 | President[5] | Kerry 61.2 - 37.4% |
| Senator[6] | Boxer 63.8 - 31.4% | |
| 2003 | Recall[7][8] | Yes 50.8 - 49.2% |
| Schwarzenegger 47.1 - 33.6% | ||
| 2002 | Governor[9] | Davis 52.2 - 38.7% |
| 2000 | President[10] | Gore 72.1 - 22.3% |
| Senator[11] | Feinstein 70.5 - 21.2% | |
| 1998 | Governor | |
| Senator | ||
| 1996 | President | |
| 1994 | Governor | |
| Senator | ||
| 1992 | President | Clinton 66.3 - 20.2% |
| Senator | Boxer 67.7 - 27.4% | |
| Senator | Feinstein 72.5 - 23.6% | |
List of representatives
| Representative | Party | Years | Notes | Counties |
|---|---|---|---|---|
| District created | January 3, 1953 | |||
 John J. Phillips John J. Phillips |
Republican | January 3, 1953 – January 3, 1957 |
Redistricted from the 22nd district Lost re-election |
Imperial, Riverside |
 Dalip Singh Saund Dalip Singh Saund |
Democratic | January 3, 1957 – January 3, 1963 |
First Sikh Congressman Left office due to incapacitating stroke |
Imperial, Riverside |
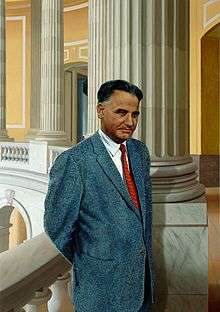
 George E. Brown, Jr. George E. Brown, Jr. |
Democratic | January 3, 1963 – January 3, 1971 |
Retired to run for the US Senate | Los Angeles |
 George E. Danielson George E. Danielson |
Democratic | January 3, 1971 – January 3, 1975 |
Redistricted to the 30th district | |
 Augustus F. Hawkins Augustus F. Hawkins |
Democratic | January 3, 1975 – January 3, 1983 |
Redistricted from the 21st district | |
| January 3, 1983 – January 3, 1991 |
Retired | South Central Los Angeles | ||
 Maxine Waters Maxine Waters |
Democratic | January 3, 1991 – January 3, 1993 |
Redistricted to the 35th district | |
 Henry Waxman Henry Waxman |
Democratic | January 3, 1993 – January 3, 2003 |
Redistricted from the 24th district Redistricted to the 30th district |
West Side Los Angeles |
 Adam Schiff Adam Schiff |
Democratic | January 3, 2003 – January 3, 2013 |
Redistricted from the 27th district Redistricted to the 28th district |
Los Angeles (Burbank, Glendale, Pasadena) |
 Tony Cárdenas Tony Cárdenas |
Democratic | January 3, 2013 – present |
North-central San Fernando Valley | |
Election results
|
1952 • 1954 • 1956 • 1958 • 1960 • 1962 • 1964 • 1966 • 1968 • 1970 • 1972 • 1974 • 1976 • 1978 • 1980 • 1982 • 1984 • 1986 • 1988 • 1990 • 1992 • 1994 • 1996 • 1998 • 2000 • 2002 • 2004 • 2006 • 2010 • 2012 • 2014 |
1952
| Party | Candidate | Votes | % | |
|---|---|---|---|---|
| Republican | John J. Phillips (incumbent) | 73,144 | 100.0 | |
| Voter turnout | % | |||
| Republican hold | ||||
1954
| Party | Candidate | Votes | % | |
|---|---|---|---|---|
| Republican | John J. Phillips (incumbent) | 42,420 | 58 | |
| Democratic | Bruce Shangle | 30,781 | 42 | |
| Total votes | 73,201 | 100.0 | ||
| Voter turnout | % | |||
| Republican hold | ||||
1956
| Party | Candidate | Votes | % | |||
|---|---|---|---|---|---|---|
| Democratic | Dalip Singh Saund | 54,989 | 51.5 | |||
| Republican | Jacqueline Cochran Odlum | 51,690 | 48.5 | |||
| Total votes | 106,679 | 100.0 | ||||
| Voter turnout | % | |||||
| Democratic gain from Republican | ||||||
1958
| Party | Candidate | Votes | % | |
|---|---|---|---|---|
| Democratic | Dalip Singh Saund (inc.) | 64,518 | 62.4 | |
| Republican | John Babbage | 38,899 | 37.6 | |
| Total votes | 103,417 | 100.0 | ||
| Voter turnout | % | |||
| Democratic hold | ||||
1960
| Party | Candidate | Votes | % | |
|---|---|---|---|---|
| Democratic | Dalip Singh Saund (inc.) | 76,139 | 57.1 | |
| Republican | Charles H. Jameson | 57,319 | 42.9 | |
| Total votes | 133,458 | 100.0 | ||
| Voter turnout | % | |||
| Democratic hold | ||||
1962
| Party | Candidate | Votes | % | ||
|---|---|---|---|---|---|
| Democratic | George Brown, Jr. | 73,740 | 55.7 | ||
| Republican | H. L. Richardson, Jr. | 58,760 | 44.3 | ||
| Total votes | 132,500 | 100.0 | |||
| Voter turnout | % | ||||
| Democratic win (new seat) | |||||
1964
| Party | Candidate | Votes | % | |
|---|---|---|---|---|
| Democratic | George Brown, Jr. (inc.) | 90,208 | 58.6 | |
| Republican | Charles J. Farrington, Jr. | 63,836 | 41.4 | |
| Total votes | 154,044 | 100.0 | ||
| Voter turnout | % | |||
| Democratic hold | ||||
1966
| Party | Candidate | Votes | % | |
|---|---|---|---|---|
| Democratic | George Brown, Jr. (inc.) | 69,115 | 51.1 | |
| Republican | Bill Orozco | 66,079 | 48.9 | |
| Total votes | 135,194 | 100.0 | ||
| Voter turnout | % | |||
| Democratic hold | ||||
1968
| Party | Candidate | Votes | % | |
|---|---|---|---|---|
| Democratic | George Brown, Jr. (inc.) | 74,807 | 52.3 | |
| Republican | Bill Orozco | 68,213 | 47.7 | |
| Total votes | 143,020 | 100.0 | ||
| Voter turnout | % | |||
| Democratic hold | ||||
1970
| Party | Candidate | Votes | % | |
|---|---|---|---|---|
| Democratic | George E. Danielson | 71,308 | 62.6 | |
| Republican | Tom McMann | 42,620 | 37.4 | |
| Total votes | 113,928 | 100.0 | ||
| Voter turnout | % | |||
| Democratic hold | ||||
1972
| Party | Candidate | Votes | % | |
|---|---|---|---|---|
| Democratic | George E. Danielson (inc.) | 91,553 | 62.8 | |
| Republican | Richard E. Ferraro | 48,814 | 33.5 | |
| Peace and Freedom | John W. Blaine | 5,455 | 3.7 | |
| Total votes | 145,822 | 100.0 | ||
| Voter turnout | % | |||
| Democratic hold | ||||
1974
| Party | Candidate | Votes | % | |
|---|---|---|---|---|
| Democratic | Augustus F. Hawkins (inc.) | 45,977 | 100.0 | |
| Voter turnout | % | |||
| Democratic hold | ||||
1976
| Party | Candidate | Votes | % | |
|---|---|---|---|---|
| Democratic | Augustus F. Hawkins (inc.) | 82,515 | 85.4 | |
| Republican | Michael D. Germonprez | 10,852 | 11.2 | |
| Independent | Sheila Leburg | 3,235 | 3.3 | |
| Total votes | 96,602 | 100.0 | ||
| Voter turnout | % | |||
| Democratic hold | ||||
1978
| Party | Candidate | Votes | % | |
|---|---|---|---|---|
| Democratic | Augustus F. Hawkins (inc.) | 65,214 | 85.0 | |
| Republican | Uriah J. Fields | 11,512 | 15.0 | |
| Total votes | 76,726 | 100.0 | ||
| Voter turnout | % | |||
| Democratic hold | ||||
1980
| Party | Candidate | Votes | % | |
|---|---|---|---|---|
| Democratic | Augustus F. Hawkins (inc.) | 80,095 | 86.1 | |
| Republican | Michael Arthur Hirt | 10,282 | 11.1 | |
| Libertarian | Earl Smith | 2,622 | 2.8 | |
| Total votes | 92,999 | 100.0 | ||
| Voter turnout | % | |||
| Democratic hold | ||||
1982
| Party | Candidate | Votes | % | |
|---|---|---|---|---|
| Democratic | Augustus F. Hawkins (inc.) | 97,028 | 79.8 | |
| Republican | Milton R. Mackaig | 24,568 | 20.2 | |
| Total votes | 121,596 | 100.0 | ||
| Voter turnout | % | |||
| Democratic hold | ||||
1984
| Party | Candidate | Votes | % | |
|---|---|---|---|---|
| Democratic | Augustus F. Hawkins (inc.) | 108,777 | 86.6 | |
| Republican | Echo Y. Goto | 16,781 | 13.4 | |
| Total votes | 125,558 | 100.0 | ||
| Voter turnout | % | |||
| Democratic hold | ||||
1986
| Party | Candidate | Votes | % | |
|---|---|---|---|---|
| Democratic | Augustus F. Hawkins (inc.) | 78,132 | 84.5 | |
| Republican | John Van de Brooke | 13,432 | 14.5 | |
| Libertarian | Waheed R. Boctor | 851 | 0.9 | |
| Total votes | 92,415 | 100.0 | ||
| Voter turnout | % | |||
| Democratic hold | ||||
1988
| Party | Candidate | Votes | % | |
|---|---|---|---|---|
| Democratic | Augustus F. Hawkins (inc.) | 88,169 | 82.8 | |
| Republican | Reuben D. Franco | 14,543 | 13.7 | |
| Libertarian | Gregory P. Gilmore | 3,724 | 3.5 | |
| Total votes | 105,436 | 100.0 | ||
| Voter turnout | % | |||
| Democratic hold | ||||
1990
| Party | Candidate | Votes | % | |
|---|---|---|---|---|
| Democratic | Maxine Waters | 51,350 | 79.4 | |
| Republican | Bill DeWitt | 12,054 | 18.6 | |
| Libertarian | Waheed R. Boctor | 1,268 | 2.0 | |
| Total votes | 64,672 | 100.0 | ||
| Voter turnout | % | |||
| Democratic hold | ||||
1992
| Party | Candidate | Votes | % | |
|---|---|---|---|---|
| Democratic | Henry Waxman (incumbent) | 160,312 | 61.3 | |
| Republican | Mark Robbins | 67,141 | 25.7 | |
| Independent | David Davis | 15,445 | 5.9 | |
| Peace and Freedom | Susan C. Davies | 13,888 | 5.3 | |
| Libertarian | Felix Tsvi Rogin | 4,699 | 1.8 | |
| No party | Vann (write-in) | 1 | 0.0% | |
| Total votes | 261,486 | 100.0 | ||
| Voter turnout | % | |||
| Democratic hold | ||||
1994
| Party | Candidate | Votes | % | |
|---|---|---|---|---|
| Democratic | Henry Waxman (incumbent) | 129,413 | 66.15 | |
| Republican | Paul Stepanek | 53,801 | 28.26 | |
| Libertarian | Mike Binkley | 7,162 | 3.76 | |
| Total votes | 190,376 | 100.0 | ||
| Voter turnout | % | |||
| Democratic hold | ||||
1996
| Party | Candidate | Votes | % | |
|---|---|---|---|---|
| Democratic | Henry Waxman (incumbent) | 145,278 | 67.7 | |
| Republican | Paul Stepanek | 52,857 | 24.6 | |
| Peace and Freedom | John Daley | 8,819 | 4.1 | |
| Libertarian | Mike Binkley | 4,766 | 2.2 | |
| Natural Law | Brian Rees | 3,097 | 1.4 | |
| Total votes | 214,817 | 100.0 | ||
| Voter turnout | % | |||
| Democratic hold | ||||
1998
| Party | Candidate | Votes | % | |
|---|---|---|---|---|
| Democratic | Henry Waxman (incumbent) | 131,561 | 73.87 | |
| Republican | Mike Gottlieb | 40,282 | 22.62 | |
| Libertarian | Mike Binkley | 3,534 | 1.98 | |
| Natural Law | Karen Blasdell-Wilkinson | 2,717 | 1.53 | |
| Total votes | 178,094 | 100.0 | ||
| Voter turnout | % | |||
| Democratic hold | ||||
2000
| Party | Candidate | Votes | % | |
|---|---|---|---|---|
| Democratic | Henry Waxman (incumbent) | 180,295 | 75.7 | |
| Republican | Jim Scileppi | 45,784 | 19.3 | |
| Libertarian | Jack Anderson | 7,944 | 3.3 | |
| Natural Law | Bruce Currivan | 4,178 | 1.7 | |
| Total votes | 238,201 | 100.0 | ||
| Voter turnout | % | |||
| Democratic hold | ||||
2002
| Party | Candidate | Votes | % | |
|---|---|---|---|---|
| Democratic | Adam Schiff (incumbent) | 76,036 | 62.6 | |
| Republican | Jim Scileppi | 40,676 | 33.4 | |
| Libertarian | Ted Brown | 4,889 | 4.0 | |
| Total votes | 121,541 | 100.0 | ||
| Voter turnout | % | |||
| Democratic hold | ||||
2004
| Party | Candidate | Votes | % | |
|---|---|---|---|---|
| Democratic | Adam Schiff (incumbent) | 133,670 | 64.7 | |
| Republican | Harry Frank Scolinos | 62,871 | 30.4 | |
| Green | Philip Koebel | 5,715 | 2.7 | |
| Libertarian | Ted Brown | 4,570 | 2.2 | |
| No party | John Burton (write-in) | 6 | 0.0% | |
| Total votes | 206,832 | 100.0 | ||
| Voter turnout | % | |||
| Democratic hold | ||||
2006
| Party | Candidate | Votes | % | |
|---|---|---|---|---|
| Democratic | Adam Schiff (incumbent) | 91,014 | 63.5 | |
| Republican | William J. Bodell | 39,321 | 27.5 | |
| Green | William M. Paparian | 8,197 | 5.7 | |
| Peace and Freedom | Lynda L. Llamas | 2,599 | 1.8 | |
| Libertarian | Jim Keller | 2,258 | 1.5 | |
| No party | John Burton (write-in) | 15 | 0.0% | |
| Total votes | 143,404 | 100.0 | ||
| Voter turnout | % | |||
| Democratic hold | ||||
2008
| Party | Candidate | Votes | % | |
|---|---|---|---|---|
| Democratic | Adam Schiff (incumbent) | 146,198 | 68.9 | |
| Republican | Charles Hahn | 56,727 | 26.7 | |
| Libertarian | Alan Pyeatt | 9,219 | 4.3 | |
| Voter turnout | % | |||
| Democratic hold | ||||
2010
| Party | Candidate | Votes | % | |
|---|---|---|---|---|
| Democratic | Adam Schiff (incumbent) | 104,374 | 64.78 | |
| Republican | John P. Colbert | 51,534 | 31.98 | |
| Libertarian | William P. Cushing | 5,218 | 3.24 | |
| Voter turnout | % | |||
| Democratic hold | ||||
2012
| Party | Candidate | Votes | % | ||
|---|---|---|---|---|---|
| Democratic | Tony Cardenas | 111,287 | 74.1 | ||
| No party preference | David R. Hernandez | 38,994 | 25.9 | ||
| Total votes | 150,281 | 100.0 | |||
| Democratic win (new seat) | |||||
2014
| Party | Candidate | Votes | % | ||
|---|---|---|---|---|---|
| Democratic | Tony Cardenas (incumbent) | 50,096 | 74% | ||
| Republican | William O'Callaghan Leader | 17,045 | 26% | ||
| Total votes | 67,141 | 100% | |||
| Democratic win (new seat) | |||||
Living former Members
As of April 2015, there are three former members of the U.S. House of Representatives from California's 29th congressional district that are currently living.
| Representative | Term in office | Date of birth (and age) |
|---|---|---|
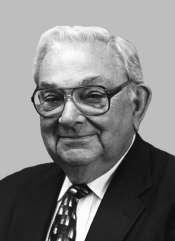
| Maxine Waters | 1991 - 1993 | August 15, 1938 |
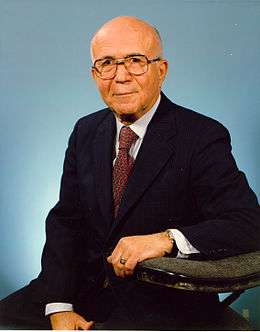
| Henry Waxman | 1993 - 2003 | September 12, 1939 |
| Adam Schiff | 2003 - 2013 | June 22, 1960 |
Historical district boundaries

See also
References
- ↑ http://www.latimes.com/la-redistricting-map-july-2011,0,5339409.htmlstory#39.71057374407184,-118.14590136718749,5,usCongress,,,current
- ↑ (2008 President)
- ↑ Statement of Vote (2006 Governor)
- ↑ Statement of Vote (2006 Senator)
- ↑ Statement of Vote (2004 President)
- ↑ Statement of Vote (2004 Senator)
- ↑ Statement of Vote (2003 Recall Question)
- ↑ Statement of Vote (2003 Governor)
- ↑ Statement of Vote (2002 Governor)
- ↑ Statement of Vote (2000 President)
- ↑ Statement of Vote (2000 Senator)
- ↑ 1952 election results
- ↑ 1954 election results
- ↑ 1956 election results
- ↑ 1958 election results
- ↑ 1960 election results
- ↑ 1962 election results
- ↑ 1964 election results
- ↑ 1966 election results
- ↑ 1968 election results
- ↑ 1970 election results
- ↑ 1972 election results
- ↑ 1974 election results
- ↑ 1976 election results
- ↑ 1978 election results
- ↑ 1980 election results
- ↑ 1982 election results
- ↑ 1984 election results
- ↑ 1986 election results
- ↑ 1988 election results
- ↑ 1990 election results
- ↑ 1992 election results
- ↑ 1994 election results
- ↑ 1996 election results
- ↑ 1998 election results
- ↑ 2000 election results
- ↑ 2002 general election results Archived February 3, 2009, at the Wayback Machine.
- ↑ 2004 general election results
- ↑ 2006 general election results Archived November 27, 2008, at the Wayback Machine.
- ↑ 2008 general election results
- ↑ United States House of Representatives elections, 2010
- ↑ 2012 general election results Archived October 19, 2013, at the Wayback Machine.
- ↑ 2012 general election results Archived October 19, 2013, at the Wayback Machine.
External links
- GovTrack.us: California's 29th congressional district
- RAND California Election Returns: District Definitions
- California Voter Foundation map - CD29
Coordinates: 34°16′00″N 118°25′49″W / 34.26667°N 118.43028°W