Calgary Centre-North
|
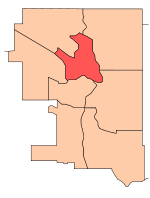
Calgary Centre-North in relation to the other Calgary ridings | |
| Defunct federal electoral district | |
| Legislature | House of Commons |
| District created | 2003 |
| District abolished | 2013 |
| First contested | 2004 |
| Last contested | 2011 |
| District webpage | profile, map |
| Demographics | |
| Population (2011)[1] | 114,784 |
| Electors (2011) | 83,832 |
| Area (km²)[2] | 48.05 |
| Census divisions | Division No. 6 |
| Census subdivisions | Calgary |
Calgary Centre-North (formerly known as Calgary North Centre) was a federal electoral district in Alberta, Canada, that was represented in the Canadian House of Commons from 2004 to 2015. It was a mixed urban and suburban constituency in Calgary – with a dense urban area close to the Bow River in the south and suburbs in the north of the riding, west of Deerfoot Trail and east of Nose Hill Park.
History
This riding was created as "Calgary North Centre" in 2003 from Calgary Centre (38%), Calgary—Nose Hill (38%) and Calgary Northeast (24%).
In 2004, it was renamed "Calgary Centre-North".
In 2013, it was abolished and redistributed into Calgary Confederation (67%) and Calgary Nose Hill (33%) ridings.
Members of Parliament
This riding has elected the following members of the Canadian House of Commons:
| Parliament | Years | Member | Party | |
|---|---|---|---|---|
| Calgary North Centre | ||||
| Riding created from Calgary Centre, Calgary Northeast and Calgary—Nose Hill |
||||
| 38th | 2004–2006 | Jim Prentice | Conservative | |
| Calgary Centre-North | ||||
| 39th | 2006–2008 | Jim Prentice | Conservative | |
| 40th | 2008–2010 | |||
| 41st | 2011–2015 | Michelle Rempel | ||
| Riding dissolved into Calgary Confederation and Calgary Nose Hill | ||||
Election results
Calgary Centre-North
| Canadian federal election, 2011 | ||||||||
|---|---|---|---|---|---|---|---|---|
| Party | Candidate | Votes | % | ∆% | Expenditures | |||
| Conservative | Michelle Rempel | 28,443 | 56.53 | 0.00 | $82,363.77 | |||
| New Democratic | Paul Vargis | 8,048 | 15.99 | +0.67 | $15,914.50 | |||
| Liberal | Stephen Randall | 7,046 | 14.00 | +2.23 | $55,742.32 | |||
| Green | Heather MacIntosh | 6,578 | 13.07 | -2.22 | $42,457.33 | |||
| Marxist–Leninist | Peggy Askin | 203 | 0.40 | +0.02 | $0.00 | |||
| Total valid votes/Expense limit | 50,318 | 100.00 | $ | |||||
| Total rejected ballots | 200 | 0.40 | – | |||||
| Turnout | 50,518 | 60.55 | – | |||||
| Eligible voters | 83,431 | – | – | |||||
| Canadian federal election, 2008 | ||||||||
|---|---|---|---|---|---|---|---|---|
| Party | Candidate | Votes | % | ∆% | Expenditures | |||
| Conservative | Jim Prentice | 27,371 | 56.53 | +0.53 | $67,126 | |||
| New Democratic | John Chan | 7,417 | 15.32 | -1.46 | $24,957 | |||
| Green | Eric Donovan | 7,403 | 15.29 | +3.49 | n/a | |||
| Liberal | Doug James | 5,699 | 11.77 | -1.93 | $12,026 | |||
| Libertarian | Jason McNeil | 345 | 0.71 | +0.71 | $3,315 | |||
| Marxist–Leninist | Peggy Askin | 184 | 0.38 | +0.04 | n/a | |||
| Total valid votes/Expense limit | 48,419 | 100.00 | $88,582 | |||||
| Total rejected ballots | – | – | ||||||
| Turnout | – | – | ||||||
| Conservative hold | Swing | +1.0 | ||||||
| Canadian federal election, 2006 | ||||||||
|---|---|---|---|---|---|---|---|---|
| Party | Candidate | Votes | % | ∆% | Expenditures | |||
| Conservative | Jim Prentice | 31,174 | 56.00 | +1.82 | $69,871 | |||
| New Democratic | John Chan | 9,341 | 16.78 | +4.66 | $23,559 | |||
| Liberal | Matthew Moody | 7,628 | 13.70 | -7.65 | $16,352 | |||
| Green | Marc Andrew MacGillivray | 6,573 | 11.80 | +0.56 | $4,212 | |||
| Independent | Michael Falconar | 383 | 0.68 | -0.05 | $1,133 | |||
| First Peoples National | Doug Dokis | 206 | 0.37 | – | $0 | |||
| Marxist–Leninist | Margaret Peggy Askin | 194 | 0.34 | -0.01 | $59 | |||
| Canadian Action | James Kohut | 168 | 0.30 | – | $0 | |||
| Total valid votes | 55,667 | 100.00 | ||||||
| Total rejected ballots | 213 | 0.38 | ||||||
| Turnout | 55,880 | 63.80 | ||||||
Calgary North Centre
| Canadian federal election, 2004 | ||||||||
|---|---|---|---|---|---|---|---|---|
| Party | Candidate | Votes | % | ∆% | Expenditures | |||
| Conservative | Jim Prentice | 28,143 | 54.18 | * | $55,236 | |||
| Liberal | Cathy McClusky | 11,093 | 21.35 | * | $43,208 | |||
| New Democratic | John Chan | 6,298 | 12.12 | * | $15,764 | |||
| Green | Mark MacGillivray | 5,840 | 11.24 | * | $3,450 | |||
| Independent | Michael Falconar | 380 | 0.73 | * | $3,076 | |||
| Marxist–Leninist | Margaret Peggy Askin | 184 | 0.35 | * | $46 | |||
| Total valid votes | 51,938 | 100.00 | – | |||||
| Total rejected ballots | 188 | 0.36 | – | |||||
| Turnout | 52,126 | 60.97 | – | |||||
See also
- List of Canadian federal electoral districts
- Alberta federal electoral districts
- Past Canadian electoral districts
References
- "(Code 48003) Census Profile". 2011 census. Statistics Canada. 2012. Retrieved 2011-03-06.
- Riding history for Calgary North Centre (2003-2004) from the Library of Parliament
- Riding history for Calgary Centre-North (2004-2008) from the Library of Parliament
- 2011 results from Elections Canada
- Expenditures - 2008
- Expenditures - 2004
Notes
- ↑ Statistics Canada: 2012
- ↑ Statistics Canada: 2012
External links
- 2008 Calgary Centre-North Riding Debate ("Round Table") Coverage (MP3, WMV, FLV)
- Website of the Parliament of Canada
.png)
.png)