Demographics of Brazil
Brazil's population is very diverse, comprising many races and ethnic groups. In general, Brazilians trace their origins from five sources: Europeans, Western and Central-Western Africans, Amerindians, Levantines, and East Asians.
Brazil has conducted a periodical population census since 1872. Brazil is widely known to be one of the most diverse countries in the world. Since 1940, this census has been carried out decennially. Scanned versions of the forms for each census distributed in Brazil since 1960 are available on-line from IPUMS International.[1]
Historically, Brazil has experienced large degrees of ethnic and racial admixture, assimilation of cultures and syncretism.
Population


According to the 2008 PNAD (National Household Sample Survey), conducted by the IBGE, the Brazilian Statistics bureau, there were about 189,953,000 inhabitants in 2008.[2] As of the latest (2010) census, the Brazilian government estimates its population at 190.8 million.
The population of Brazil is estimated based on various sources from 1550 to 1850. The first official census took place in 1872. From that year, every 10 years (with some exceptions) the population is counted.
Brazil is the fifth most populated country in the world.
- 1550 – 15,000
- 1600 – 100,000
- 1660 – 184,000
- 1700 – 300,000
- 1766 – 1,500,000
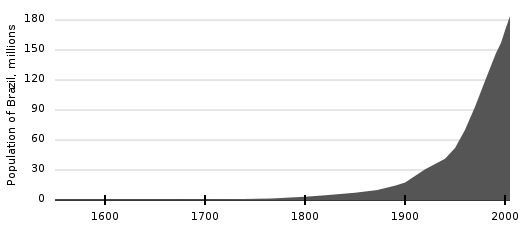 Population of Brazil, 1550–2005
 - 1800 – 3,250,000
- 1820 – 4,717,000
- 1850 – 7,256,000
- 1872 – 9,930,478
- 1890 – 14,333,915
- 1900 – 17,438,434
- 1920 – 30,635,605
- 1940 – 41,236,315
- 1950 – 51,944,397
- 1960 – 70,119,071
- 1970 – 93,139,037
- 1980 – 119,070,865
- 1991 – 146,917,459
- 1996 – 157,079,573
- 2000 – 169,544,443
- 2010 – 192,755,799[3]
- 2016 – 206,803,000[4]
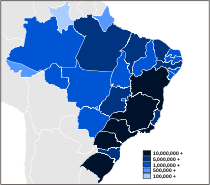
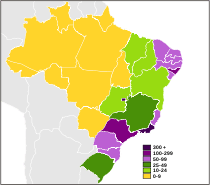
Population distribution in Brazil is very uneven. The majority of Brazilians live within 300 kilometers of the coast, while the interior in the Amazon Basin is almost empty. Therefore, the densely populated areas are on the coast and the sparsely populated areas are in the interior. This historical pattern is little changed by recent movements into the interior.
UN estimates
According to the 2015 revision of the World Population Prospects the total population was 198,614,000 in 2010, compared to only 53,975,000 in 1950. The proportion of children below the age of 15 in 2015 was 25.0%, 69.2% was between 15 and 65 years of age, while 7.8% was 65 years or older.[5]
| Total population (x 1000) | Population aged less than 15 (%) | Population aged 15–64 (%) | Population aged 65+ (%) | |
|---|---|---|---|---|
| 1950 | 53 975 | 41.6 | 55.5 | 3.0 |
| 1955 | 62 656 | 42.0 | 55.0 | 3.0 |
| 1960 | 72 494 | 43.1 | 53.7 | 3.1 |
| 1965 | 84 130 | 43.6 | 53.0 | 3.4 |
| 1970 | 95 982 | 42.3 | 54.2 | 3.5 |
| 1975 | 108 431 | 40.2 | 56.0 | 3.8 |
| 1980 | 122 200 | 38.4 | 57.6 | 4.0 |
| 1985 | 136 836 | 36.9 | 59.0 | 4.1 |
| 1990 | 150 393 | 35.4 | 60.1 | 4.5 |
| 1995 | 162 755 | 32.4 | 62.6 | 5.0 |
| 2000 | 175 786 | 29.7 | 64.7 | 5.6 |
| 2005 | 188 479 | 27.5 | 66.2 | 6.3 |
| 2010 | 198 614 | 25.3 | 67.9 | 6.8 |
| 2015 | 207 848 | 23.0 | 69.2 | 7.8 |
Vital statistics
Registration of vital events in Brazil has considerably improved during the past decades but is still not considered complete, especially in the northern part of the country. The Population Division of the United Nations prepared the following estimates.[5]
| Period | Live births per year |
Deaths per year |
Natural change per year |
CBR* | CDR* | NC* | TFR* | IMR* | Life expectancy total |
Life expectancy males |
Life expectancy females |
|---|---|---|---|---|---|---|---|---|---|---|---|
| 1950–1955 | 2 578 000 | 908,000 | 1 670 000 | 44.2 | 15.6 | 28.6 | 6.15 | 135 | 50.9 | 49.2 | 52.6 |
| 1955–1960 | 2 923 000 | 956,000 | 1 967 000 | 43.3 | 14.1 | 29.1 | 6.15 | 122 | 53.3 | 51.5 | 55.2 |
| 1960–1965 | 3 315 000 | 988,000 | 2 327 000 | 42.3 | 12.6 | 29.7 | 6.15 | 109 | 55.7 | 53.8 | 57.6 |
| 1965–1970 | 3 345 000 | 975,000 | 2 370 000 | 37.2 | 10.8 | 26.4 | 5.38 | 100 | 57.6 | 55.7 | 59.6 |
| 1970–1975 | 3 462 000 | 973,000 | 2 489 000 | 33.9 | 9.5 | 24.4 | 4.72 | 91 | 59.5 | 57.3 | 61.8 |
| 1975–1980 | 3 788 000 | 1 035 000 | 2 753 000 | 32.9 | 9.0 | 23.9 | 4.31 | 79 | 61.5 | 59.2 | 63.9 |
| 1980–1985 | 4 006 000 | 1 078 000 | 2 928 000 | 30.9 | 8.3 | 22.6 | 3.80 | 63 | 63.4 | 60.4 | 66.8 |
| 1985–1990 | 3 790 000 | 1 079 000 | 2 711 000 | 26.4 | 7.5 | 18.9 | 3.10 | 52 | 65.3 | 61.9 | 69.1 |
| 1990–1995 | 3 547 000 | 1 074 000 | 2 473 000 | 22.7 | 6.9 | 15.8 | 2.60 | 43 | 67.3 | 63.6 | 71.2 |
| 1995–2000 | 3 658 000 | 1 052 000 | 2 606 000 | 21.6 | 6.2 | 15.4 | 2.45 | 34 | 69.3 | 65.5 | 73.3 |
| 2000–2005 | 3 612 000 | 1 074 000 | 2 538 000 | 19.8 | 5.9 | 13.9 | 2.25 | 27 | 70.9 | 67.2 | 74.8 |
| 2005–2010 | 3 173 000 | 1 146 000 | 2 027 000 | 16.4 | 5.9 | 10.5 | 1.90 | 24 | 72.2 | 68.7 | 75.9 |
| 2010–2015 | 3 073 000 | 1 230 000 | 1 843 000 | 15.1 | 6.1 | 9.0 | 1.82 | 19 | 73.8 | 70.2 | 77.5 |
| 2015–2020 | 2 957 000 | 1 335 000 | 1 622 000 | 14.0 | 6.3 | 7.7 | 1.74 | 16 | 75.1 | 71.6 | 78.7 |
| * CBR = crude birth rate (per 1000); CDR = crude death rate (per 1000); NC = natural change (per 1000); IMR = infant mortality rate per 1000 births; TFR = total fertility rate (number of children per woman) | |||||||||||
Births and deaths[6]
| Year | Population | Live births | Deaths | Natural increase | Crude birth rate | Crude death rate | Rate of natural increase | TFR |
|---|---|---|---|---|---|---|---|---|
| 2009 | 2,752,401 | 1,079,228 | 1,673,173 | 1,906 | ||||
| 2010 | 192,755,799 | 2,760,961 | 1,117,675 | 1,643,286 | 14.32 | 5.80 | 8.52 | 1,869 |
| 2011 | 2,824,776 | 1,148,165 | 1,676,611 | 1,82 | ||||
| 2012 | 2,830,458 | 1,157,214 | 1,673,244 | 1,81 | ||||
| 2013 | 2,832,590 | 1,180,796 | 1,651,794 | 1,80 | ||||
| 2014 | 2,913,121 | 1,194,164 | 1,718,957 | |||||
Regional differences
In some states in the North and Northeast, the fertility rate was higher than the national average in 2013. The highest rate was in Acre, with 2.59 children per woman Other regions with high fertility include Amapá, with 2.42 children per woman, Amazonas, 2.38 in Roraima, 2.34, in Maranhão, 2.28, and Pará, 2.20.
On the other hand, Santa Catarina is the state with the lowest rate, 1.58 children per woman. Other states with low fertility include, Federal District, with 1.59, Rio Grande do Sul, 1.60, in Rio de Janeiro, 1.62 in São Paulo and Minas Gerais, 1.63.
Childlessness and education
The color or race of the woman and the level of education has also shown to influence the fact of not having children. In 2013, among white women aged 15 to 49 years, 41.5% had no children, while among black women, the percentage was 35.8%.
The proportional difference is even greater among white women compared to black 25–29 years. While the proportion among white women childless was 48.1% among black women was 33.8%.
Regarding education, among women 15–49 years of age with more than eight years of schooling, 44.2% had no children in 2013, while among those with up to seven years of study this figure was 21.6%.
Schooling among women 25–29 years has shown an even greater disparity. Among the less educated, 16.3% had no children, while among the more educated 45.5% were mothers. The proportion of women aged 45 to 49 without children was 8.2% in 2013 among those with less education and 15.1% among those with more years of schooling.
Total fertility rate
| Brazil 100% | White 47.73% | Black 7.61% | Asian 1.09% | Pardo (Multiracial) 43.13% | American Indians 0.43% | |
|---|---|---|---|---|---|---|
| Population 0–14 | 45,932,294 | 20,460,482 | 2,698,639 | 420,952 | 22,055,573 | 295,862 |
| Percent group 0–14 in race | 24.08% | 22.47% | 18.59% | 20.02% | 26.81% | 36.17% |
| Population 0–14 compared to racial groups | 100% | 44.54% | 5.88% | 0.92% | 48.02% | 0.64% |
| Population 15–49 | 105,816,285 | 49,381,206 | 8,693,350 | 1,178,391 | 46,156,227 | 402,079 |
| Proportions 0–14 to 15–49 | 0,43407 | 0,41434 | 0,31043 | 0,35723 | 0,47785 | 0,73583 |
| Age group | Brazil 100% (percent of the population) | White 47.73% (percent in the race/percent in the age group) | Black 7.61% (percent in the race/percent in the age group) | Asian 1.09% (percent in the race/percent in the age group) | Pardo (Multiracial) 43.13% (percent in the race/percent in the age group) | Indians 0.43% (percent in the race/percent in the age group) | Unspecified 0.0034% |
|---|---|---|---|---|---|---|---|
| Population | 190,755,799 | 91,051,646 | 14,517,961 | 2,084,288 | 82,277,333 | 817,963 | 6,608 |
| 0–4 | 13,796,158 (7.23%) | 6,701,186 (7.36%/48.57%) | 655,958 (4.52%/4.75%) | 119,956 (5.76%/0.87%) | 6,217,638 (7.56%/45.07%) | 101,195 (12.37%/0.73%) | 225 |
| 5–9 | 14,969,375 (7.85%) | 6,562,558 (7.21%/43.84%) | 887,209 (6.11%/5.93%) | 139,543 (6.69%/0.93%) | 7,279,983 (8.85%/48.63%) | 99,841 (12.21%/0.67%) | 241 |
| 10–14 | 17,166,761 (9.00%) | 7,196,738 (7.90%/41.92%) | 1,155,472 (7.96%/6.73%) | 161,453 (7.75%/0.94%) | 8,557,952 (10.40%/49.85%) | 94,826 (11.59%/0.55%) | 320 |
| 15–19 | 16,990,872 (8.91%) | 7,311,734 (8.03%/43.03%) | 1,264,183 (8.71%/7.44%) | 177,008 (8.49%/1.04%) | 8,155,126 (9.91%/48.00%) | 82,500 (10.86%/0.49%) | 321 |
| 20–24 | 17,245,192 (9.04%) | 7,774,488 (8.54%/45.08%) | 1,381,677 (9.52%/8.01%) | 200,060 (9.60%/1.16%) | 7,814,487 (9.50%/45.31%) | 73,387 (8.97%/0.43%) | 1 093 |
| 25–29 | 17,104,414 (8.97%) | 7,936,115 (8.72%/46.40%) | 1,443,820 (9.95%/8.44%) | 202,733 (9.73%/1.19%) | 7,455,402 (9.06%/43.59%) | 65,104 (7.96%/0.38%) | 1 240 |
| 30–34 | 15,744,512 (8.25%) | 7,344,600 (8.07%/46.65%) | 1,360,298 (9.37%/8.64%) | 182,150 (8.74%/1.16%) | 6,800,175 (8.26%/43.19%) | 56,326 (6.89%/0.36%) | 963 |
| 35–39 | 13,888,579 (7.28%) | 6,596,137 (7.24%/47.49%) | 1,175,333 (8.10%/8.46%) | 152,546 (7.32%/1,10) | 5,915,773 (7.18%/42.59%) | 48,167 (5.89%/0.35%) | 623 |
| 40–44 | 13,009,364 (6.82%) | 6,365,363 (6.99%/48.93%) | 1,095,301 (7.54%/8.42%) | 139,230 (6.68%/1.07%) | 5,368,059 (6.52%/41.26%) | 40,950 (5.01%/0.31%) | 461 |
| 45–49 | 11,833,352 (6.20%) | 6,052,769 (6.65%/51.15%) | 972,738 (6.70%/8.22%) | 124,664 (5.98%/1.05%) | 4,647,205 (5.65%/39.27%) | 35,645 (4.36%/0.30%) | 331 |
| 50–54 | 10,140,402 (5.32%) | 5,286,559 (5.81%/52.13%) | 848,098 (5.84%/8.36%) | 106,539 (5.11%/1.05%) | 3,869,792 (4.70%/38.16%) | 29,156 (3.56%/0.29%) | 258 |
| 55–59 | 8,276,221 (4.34%) | 4,404,057 (4.84%/53.21%) | 675,404 (4.65%/8.16%) | 95,149 (4.57%/1.15%) | 3,076,630 (3.74%/37.17%) | 24,800 (3.03%/0.30%) | 181 |
| 60–69 | 11,349,930 (5.95%) | 6,158,001 (6.76%/54.26%) | 906,487 (6.24%/7.99%) | 152,099 (7.30%/1.34%) | 4,097,068 (4.98%/36.10%) | 36,062 (4.41%/0.32%) | 213 |
| 70+ | 9,240,667 (4.84%) | 5,361,341 (5.89%/58.02%) | 695,983 (4.79%/7.53%) | 131,158 (6.29%/1.42%) | 3,022,043 (3.67%/32.70%) | 30,004 (3.67%/0.32%) | 138 |
Largest urban aglomerations
Cities in Brazil, except for the state of São Paulo, are usually not arranged in a single network, but rather on various export paths to seaside ports. The most important cities are on the coast or close to it. State capitals are also each the largest city in its state, except for Vitória, the capital of Espírito Santo, and Florianópolis, the capital of Santa Catarina. There are also non-capital metropolitan areas in São Paulo state (Campinas, Santos and Paraíba Valley), Minas Gerais (Steel Valley), Rio Grande do Sul (Sinos Valley), and Santa Catarina (Itajaí Valley).
São Paulo and Rio de Janeiro are far larger than any other Brazilian city. São Paulo's influence in most economic aspects can be noted in a national (and even international) scale; other Brazilian metropolises are second tier, even though Rio de Janeiro (partially due to its former status as the national capital) still host various large corporations' headquarters, besides being Brazil's cultural center with respect to soap operas and film production. Salvador, the capital of Bahia is the 3rd biggest city and was the first capital of Brazil, very historic city.
Metropolitan areas
| Largest metropolitan areas in Brazil 2016 Brazilian Institute of Geography and Statistics estimates[9] | |||||||||
|---|---|---|---|---|---|---|---|---|---|
| Rank | Name | State | Pop. | Rank | Name | State | Pop. | ||
 São Paulo  Rio de Janeiro |
1 | São Paulo | São Paulo | 21,242,939 | 11 | Manaus | Amazonas | 2,568,817 |  Belo Horizonte 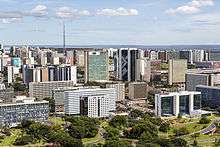 Brasília |
| 2 | Rio de Janeiro | Rio de Janeiro | 12,330,186 | 12 | Vale do Paraíba e Litoral Norte | São Paulo | 2,475,879 | ||
| 3 | Belo Horizonte | Minas Gerais | 5,873,841 | 13 | Goiânia | Goiás | 2,458,504 | ||
| 4 | Brasília | Distrito Federal | 4,284,676 | 14 | Belém | Pará | 2,422,481 | ||
| 5 | Porto Alegre | Rio Grande do Sul | 4,276,475 | 15 | Vitória | Espírito Santo | 1,935,483 | ||
| 6 | Fortaleza | Ceará | 4,019,213 | 16 | Sorocaba | São Paulo | 1,908,425 | ||
| 7 | Salvador | Bahia | 3,984,583 | 17 | Baixada Santista | São Paulo | 1,813,033 | ||
| 8 | Recife | Pernambuco | 3,940,456 | 18 | São Luís | Maranhão | 1,605,305 | ||
| 9 | Curitiba | Paraná | 3,537,894 | 19 | Natal | Rio Grande do Norte | 1,537,211 | ||
| 10 | Campinas | São Paulo | 3,131,528 | 20 | Piracicaba | São Paulo | 1,452,691 | ||
Municipalities
| | |||||||||
|---|---|---|---|---|---|---|---|---|---|
| Rank | Name | State | Pop. | Rank | Name | State | Pop. | ||
.jpg) São Paulo 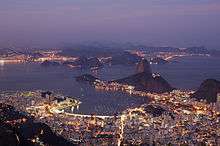 Rio de Janeiro |
1 | São Paulo | São Paulo | 11,253,503 | 11 | Belém | Pará | 1,393,399 | .jpg) Salvador .jpg) Brasília |
| 2 | Rio de Janeiro | Rio de Janeiro | 6,320,446 | 12 | Goiânia | Goiás | 1,302,001 | ||
| 3 | Salvador | Bahia | 2,675,656 | 13 | Guarulhos | São Paulo | 1,221,979 | ||
| 4 | Brasília | Distrito Federal | 2,570,160 | 14 | Campinas | São Paulo | 1,080,113 | ||
| 5 | Fortaleza | Ceará | 2,452,185 | 15 | São Luís | Maranhão | 1,014,837 | ||
| 6 | Belo Horizonte | Minas Gerais | 2,375,151 | 16 | São Gonçalo | Rio de Janeiro | 999,728 | ||
| 7 | Manaus | Amazonas | 1,802,014 | 17 | Maceió | Alagoas | 932,748 | ||
| 8 | Curitiba | Paraná | 1,701,907 | 18 | Duque de Caxias | Rio de Janeiro | 855,048 | ||
| 9 | Recife | Pernambuco | 1,537,704 | 19 | Teresina | Piauí | 814,230 | ||
| 10 | Porto Alegre | Rio Grande do Sul | 1,409,351 | 20 | Natal | Rio Grande do Norte | 803,739 | ||
Migrations
Immigration
| Immigration to Brazil, by national origin, periods from 1830 to 1933 Source: Brazilian Institute for Geography and Statistics (IBGE) | ||||||||||
|
| ||||||||||
| origin | 1830–1855 | 1856–1883 | 1884–1893 | 1894–1903 | 1904–1913 | 1914–1923 | 1924–1933 | 1934–2014 | ||
| Portuguese | 16,737 | 116,000 | 170,621 | 155,542 | 384,672 | 201,252 | 233,650 | 400,000 | ||
| Italians | — | 100,000 | 510,533 | 537,784 | 196,521 | 86,320 | 70,177 | |||
| Spaniards | — | — | 113,116 | 102,142 | 224,672 | 94,779 | 52,400 | |||
| Germans | 2,008 | 30,000 | 22,778 | 6,698 | 33,859 | 29,339 | 61,723 | |||
| Japanese | — | — | — | — | 11,868 | 20,398 | 110,191 | |||
| Syrians and Lebanese | — | — | 96 | 7,124 | 45,803 | 20,400 | 20,400 | |||
| Others | — | — | 66,524 | 42,820 | 109,222 | 51,493 | 164,586 | |||
Immigration has been a very important demographic factor in the formation, structure and history of the population in Brazil, influencing culture, economy, education, racial issues, etc. Brazil has received the third largest number of immigrants in the Western Hemisphere, after the United States and Argentina.
Brazil's structure, legislation and settlement policies for arriving immigrants were much less organized than in Canada and the United States at the time. Nevertheless, an Immigrant's Hostel (Hospedaria dos Imigrantes) was built in 1886 in São Paulo, and quick admittance and recording routines for the throngs of immigrants arriving by ship at the seaports of Vitória, Rio de Janeiro, Santos, Paranaguá, Florianópolis and Porto Alegre were established. The São Paulo State alone processed more than 2.5 million immigrants in its almost 100 years of continuous operation. People of more than 70 different nationalities were recorded.
Following the trend of several other countries in the Americas, which encouraged immigration from many countries, Brazil quickly became a melting pot of races and nationalities, but being peculiar in the sense of having the highest degree of intermarriage in the world. Immigrants found a strong social and cultural tolerance toward inter-racial marriage, including large numbers of Mulattoes (white and black), Caboclos (Indian and White) and mixed European, African and Indian people, though it was not accompanied by an entire lack of racism. Correspondingly, the same mentality reflected in low psychological and social barriers regarding intermarriage between Europeans, Middle Easterners and Asians of several origins, as well as between people of different religions.
History of immigration
It is that the Americas were settled by three migratory waves from Northern Asia. The Native Brazilians are thought to descend from the first wave of migrants, who arrived in the region around 9000 BC. The main Native Brazilian groups are the Tupi-Guarani, the Jê, the Arawaks and the Caraibas (Kalina or Caribs). The Tupi-Guarani nation, originally from the Paraná river basin and also one of the largest of the Native-Paraguayan nations, had spread all along the Brazilian coastline from South to North and came to be known by the Portuguese as "Os Índios da Língua Geral" ("The Indians of the General Language"); the Jê nation occupied most of the interior of the country from Maranhão to Santa Catarina. The Arawaks and the Caribs, the last ones to get in contact with the Portuguese, lived in the North and Northwest of Brazil.
The European immigration to Brazil started in the 16th century, with the vast majority of them coming from Portugal. In the first two centuries of colonization, 100,000 Portuguese arrived in Brazil (around 500 colonists per year). In the 18th century, 600,000 Portuguese arrived (6,000 per year).[11] The first region to be settled by the Portuguese was Northeastern Brazil, followed by the Southeast region. The original Amerindian population of Brazil (between two and five million) largely died from disease or violence or was assimilated into the Portuguese population.[12] The Mamelucos (or Caboclos, a mixed race between Whites and Amerindians) have always been present in many parts of Brazil.
Another important ethnic group, Africans, first arrived as slaves. Many came from Guinea, or from West African countries – by the end of the eighteenth century many had been taken from the Kingdom of Kongo and modern-day Angola, Mozambique, Ghana and Nigeria. By the time of the end of the slave trade in 1850, around three to five million slaves had been brought to Brazil–37% of all slave traffic between Africa and the Americas. Nowadays, there are still small immigration waves coming from the African continent. The largest influx of European immigrants to Brazil occurred in the late 19th and early 20th centuries. According to the Memorial do Imigrante statistics data, Brazil attracted nearly 5 million immigrants between 1870 and 1953.[13][14] These immigrants were divided in two groups: a part of them was sent to Southern Brazil to work as small farmers. However, the biggest part of the immigrants was sent to Southeast Brazil to work in the coffee plantations. The immigrants sent to Southern Brazil were mainly Germans (starting in 1824, mainly from Rhineland-Palatinate, Pomerania, Hamburg, Westphalia, etc.) and Italians (starting in 1875, mainly from the Veneto and Lombardia). In the South, the immigrants established rural communities that, still today, have a strong cultural connection with their ancestral homelands. In south east Brazil, most of the immigrants were Italians (mainly from the Veneto, Campania, Calabria and Lombardia), Portuguese (mainly from Beira Alta, Minho and Alto Trás-os-Montes), Spaniards (mainly from Galicia and Andalusia).
Notably, the first half of the 20th century saw a large inflow of Japanese (mainly from Honshū, Hokkaidō and Okinawa) and Arab (from Lebanon and Syria) immigrants. These Arab immigrants were—and still are—wrongly called "Turks" by many Brazilians because their original countries were still under Turkish rule back in the day Arab immigration to Brazil began. The number of actual Turks who immigrated to Brazil was in fact very small.
IBGE's 1998 PME
In 1998, the IBGE, within its preparation for the 2000 census, experimentally introduced a question about "origem" (ancestry) in its "Pesquisa Mensal de Emprego" (Monthly Employment Research), in order to test the viability of introducing that variable in the Census.[15] This research interviewed about 90,000 people in six metropolitan regions (São Paulo, Rio de Janeiro, Porto Alegre, Belo Horizonte, Salvador, and Recife).[16]
Here are its results for both the White population and the population in general:[17]
| Brazilian Population, by origin,
as understood by those surveyed 1998[18] | ||
|---|---|---|
| Origin | % of Whites | % of all races |
| Brazilian | 83.11% | 86.09% |
| Portuguese | 15.72% | 10.46% |
| Italian | 14.50% | 10.01% |
| Spanish | 6.42% | 4.40% |
| German | 5.51% | 3.54% |
| Indigenous | 4.80% | 6.64% |
| Black | 1.30% | 5.09% |
| Arab | 0.72% | 0.48% |
| Japanese | 0.62% | 1.34% |
| African | 0.58% | 2.06% |
| Jewish | 0.25% | 0.20% |
| Others | 4.05% | 2.81% |
| Total | 137.58% | 133.52% |
Notice that the total is higher than 100% because of multiple claims of ascendants from different nations in the answers.
Emigration
In the second half of the 1980s, Brazilians from various socioeconomic levels started to emigrate to other countries in search of economic opportunities.
In the 1990s, nearly 1.9 million Brazilians were living outside the country, mainly in the United States, Paraguay and Japan,[19] but also in Italy, Portugal, the United Kingdom, France, Canada, Australia, Switzerland, Germany, Belgium, Spain and Israel. However, there were no specific policies implemented by the government to encourage or discourage this emigration process.[20]
The 2000 Brazilian Census provides some information about the high number of migrants returning to Brazil. Of those who reported residing in another country less than 10 years before the 2000 census, 66.9 percent were Brazilians. If only the returning migrants (former Brazilian immigrants) are considered, 26.8 percent of Brazilians came from Paraguay, 17 percent came from Japan, and 15.8 percent came from the United States.[20]
Racial composition

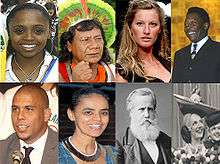
The bulk of the Brazilian population descends from three main source populations (either alone, or more commonly, in varying combinations mixed in varying degrees); early European settlers (chiefly ethnic Portuguese, but also Portuguese New Christians of ethnic Sephardic Jewish origin forced to convert to Christianity),[21] sub-Saharan Africans (Yoruba, Ewe, Akan, Bantu, and others), and the indigenous peoples in Brazil (mostly Tupi and Guarani, but also other many indigenous Brazilian ethnic groups). Interracial mixing has been common and well accepted ever since the first Portuguese settlers arrived.
Starting in the late 19th century, Brazil received substantial post-colonial immigration from several other regions, mainly from peoples of what are now the countries of Italy, Germany, Spain, Poland, as well as Arabic-speaking Christians from the Levant (mostly from what is now Lebanon, and less so from what is today Syria), Ukraine, Japan, the People's Republic of China and Korea.
Jews in Brazil are a small but sizable population, and they include mostly Ashkenazi Jews (who also arrived with the post-colonial contingent of European migration), a smaller proportion of Sephardi Jews (mostly Eastern Sephardim arrived with the contingent of post-colonial immigrants from Syria and Lebanon, but also North African Sephardim from Morocco settled in the Amazon, and Western Sephardim arrived with the Dutch), and to a much lesser extent Mizrahi Jews. Overall, the small but sizable Brazilian Jewish community is concentrated especially in Rio de Janeiro, São Paulo, and Porto Alegre, and they are accounted for without Brazilian descendants of Portuguese "New Christians" (ethnic Sephardic Jews forced to convert to Christianity and arrived with the ethnic Portuguese during the colonial period), which if included would inflate the Jewish origin population in Brazil considerably. By themselves, Brazilian descendants of Portuguese "New Christians" are estimated to account for a figure anywhere between hundreds of thousands to several million.
The descendants of European immigrants, particularly the Germans, Italians and Poles, are mainly concentrated in the southern part of the country, in the states of Rio Grande do Sul, Santa Catarina, Paraná, and the most populous, São Paulo; these states have a large majority of people of European descent. In the rest of the country, most of the white population is of older Portuguese settler stock. In the mid-southern states of Rio de Janeiro, Espírito Santo, Minas Gerais, Goiás, Mato Grosso do Sul and in the Federal District, the number of whites is somewhat equal to the number of Afro-Brazilian and mixed race Brazilians.
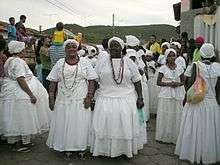
In the Northeast, which received large masses of African slaves to work in sugarcane, tobacco and cotton plantations, people of African and mixed-race descent predominate, mostly on the coast, whereas in the semi-arid country land (usually called sertão) there is a predominance of white and Amerindian-European mixed people. Most of the black or mulatto people in the sertão are descended from freed African slaves or mulattos who fled inland from the coast and worked as cowboys for semi-feudal lords. The city of Salvador da Bahia is considered one of the largest black cities of the world. In the Northwest (covering largely the Brazilian Amazon), a great part of the population has distinguishable ethnic characteristics that emphasize their Amerindian roots. Other ethnic groups have merged with the Indigenous tribes there. This region is not densely populated, and "caboclos", people of mixed native and European descent, are a small part of the entire Brazilian population.
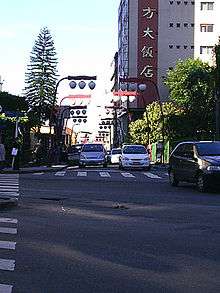
The Japanese are the largest Asian group in Brazil. In fact, Brazil has the largest population of Japanese ancestry outside Japan, with 1.5 million Japanese-Brazilians, most of them living in São Paulo. Some Chinese and Korean also settled Brazil. Most Chinese came from mainland China, but others came from Taiwan and Hong Kong, and also from Portuguese-speaking Macau—these Chinese from Macau could speak and understand Portuguese, and it was not hard for them to adjust to Brazilian life. Those immigrant populations and their descendants still retain some of their original ethnic identity, however they are not closed communities and are rapidly integrating into mainstream Brazilian society: for instance, very few of the third generation can understand their grandparents' languages.
Aboriginal Brazilians
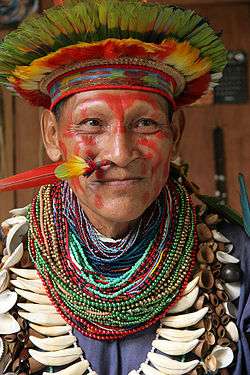
The Amerindians make up 0.4% of Brazil's population, or about 700,000 people. Indigenous peoples are found in the entire territory of Brazil, although the majority of them live in Indian reservations in the North and Centre-Western part of the country.
Over 60 million Brazilians possess at least one Native South American ancestor, according to a recent mitochondrial DNA study.[22] However, only 0.4% of the population consider themselves to be Natives. Brazilians tend to consider "Native South American" a cultural, not racial category.
When the first Portuguese arrived in Brazil, in 1500, there were about 5 million Natives living in the country. In the mid-19th century they were only 100,000 and in the late 20th century close to 300,000.
Black Brazilians
Black Brazilians are defined as people who are solely, or mostly, descended from former African slaves, or immigrants. According to the 2010 census, there are 14 517 961 Afro Brazilians, which make up 7.61% of Brazil's population, although a larger number of Brazilians have some degree of African ancestry.[8]
Asian Brazilians
According to the 2006 census, people of East Asian descent number 1,919,000, or 1.1% of Brazil's population. Estimates say that there are 2.5 to 3.0 million people of Japanese descent in Brazil, who are mostly concentrated in two states: São Paulo and Paraná, but smaller communities are found in the entire territory of the country. Brazil has the largest population of Japanese descent outside Japan.[23]
There are also smaller communities of Korean people and Chinese origin.
Mixed race/Pardo Brazilians
The Pardos are a mixture of Europeans, Blacks and Amerindians. Brazil does not have a category for multiracial people, but a Pardo (brown) one, which may include caboclos, mulatos, cafuzos (local ethnonyms for people of noticeable mixed White and Amerindian, Black and White, and Amerindian and Black descent, i.e., mestizos, mulattoes and zambos, respectively), the multiracial result of their intermixing (despite most of White and Black Brazilians possessing some degree of race-mixing, since brownness in Brazil is a matter of phenotype) and assimilated, westernized indigenous people.[24][25]
The Pardos make up 43.13% or 82.3 million people of Brazil's population. Multiracial Brazilians live in the entire territory of Brazil. Although, according to DNA resources, most Brazilians possess some degree of mixed-race ancestry, less than 45% of the country's population classified themselves as being part of this group.[26]
White Brazilians
According to the 2010 census, there were more than 91 million White Brazilians, comprising 47.73% of Brazil's population.[27] White Brazilians are defined as people who are solely or mostly descended from European immigrants, although most Brazilians have some degree of European ancestry. Whites are found in the entire territory of Brazil, although they are most concentrated in the south and southeastern parts of the country;
Nearly one million Europeans had arrived in Brazil by 1800; most of them colonists from Portugal. An immigration boom occurred in the 19th and 20th centuries, when nearly six million Europeans emigrated to Brazil, most of them Italians, Portuguese, Germans and Spaniards.
Many White Brazilians have some Amerindian and/or African ancestry (similarly found, but with widely differing percentages of admixture are, in White Americans[28] and White Argentines).[29] It is estimated that 75% of all Brazilians have varying degrees of Portuguese ancestry.
Nowadays, White Brazilians come from a very diverse background, which includes:
- The Dutch were among the Europeans settling in Brazil during the 17th century. From 1630 to 1654, the Dutch controlled the northeast coast of Brazil, establishing their colonial capital in Recife. However, they did not settle Brazil in large numbers.
- The first Germans arrived in Brazil in 1824. Most of them established themselves in rural communities across Southern Brazil, such as São Leopoldo, Novo Hamburgo, Blumenau and Pomerode. In states of the south, such as Santa Catarina and Rio Grande do Sul, they may represent as much as 5% of the population.
- Italians started arriving in Brazil in 1875. First they settled in rural communities across Southern Brazil. In the early 20th century, they mostly settled in the coffee plantations in the Southeast. 25 million Brazilians are of Italian origin, the largest number outside of Italy itself, most of them descended from Northern Italians.
- Poles came in significant numbers to Brazil after 1870. Most of them settled in the State of Paraná, working as small farmers.
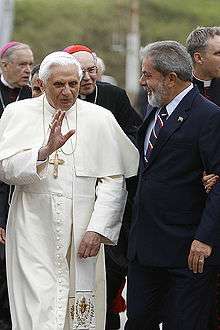
- Portuguese Most Brazilians are fully or partly of Portuguese ancestry. Portuguese settlers began arriving in 1500. Immigration increased during the 18th century and reached its peak in the late 19th and early 20th centuries. Since 2005 to the present time, approximately 400,000 Portuguese have emigrated to Brazil due to the difficult economic situation in Portugal.
- Spaniards came in large numbers to Brazil, starting in the late 19th century. Most of them were attracted to work in the coffee plantations in the state of São Paulo. Today there are an estimated 15 million Brazilians of direct Spanish descent.[30]
- Ukrainians came mostly in the late 19th century. Currently they number approximately 980,000, most of whom live in a compact settlement in south central Paraná[31]
Composition of Brazil, genetic studies
Genetic studies have shown the Brazilian population as a whole to have European, African and Native Americans components.
Autosomal studies
A 2015 autosomal genetic study, which also analysed data of 25 studies of 38 different Brazilian populations concluded that: European ancestry accounts for 62% of the heritage of the population, followed by the African (21%) and the Native American (17%). The European contribution is highest in Southern Brazil (77%), the African highest in Northeast Brazil (27%) and the Native American is the highest in Northern Brazil (32%).[32]
| Region[32] | European | African | Native American |
|---|---|---|---|
| North Region | 51% | 16% | 32% |
| Northeast Region | 58% | 27% | 15% |
| Central-West Region | 64% | 24% | 12% |
| Southeast Region | 67% | 23% | 10% |
| South Region | 77% | 12% | 11% |
An autosomal study from 2013, with nearly 1300 samples from all of the Brazilian regions, found a pred. degree of European ancestry combined with African and Native American contributions, in varying degrees. 'Following an increasing North to South gradient, European ancestry was the most prevalent in all urban populations (with values up to 74%). The populations in the North consisted of a significant proportion of Native American ancestry that was about two times higher than the African contribution. Conversely, in the Northeast, Center-West and Southeast, African ancestry was the second most prevalent. At an intrapopulation level, all urban populations were highly admixed, and most of the variation in ancestry proportions was observed between individuals within each population rather than among population'.[33]
| Region[34] | European | African | Native American |
|---|---|---|---|
| North Region | 51% | 17% | 32% |
| Northeast Region | 56% | 28% | 16% |
| Central-West Region | 58% | 26% | 16% |
| Southeast Region | 61% | 27% | 12% |
| South Region | 74% | 15% | 11% |
An autosomal DNA study (2011), with nearly 1000 samples from all over the country ("whites", "pardos" and "blacks", according to their respective proportions), found out a major European contribution, followed by a high African contribution and an important Native American component.[35] "In all regions studied, the European ancestry was predominant, with proportions ranging from 60.6% in the Northeast to 77.7% in the South".[36] The 2011 autosomal study samples came from blood donors (the lowest classes constitute the great majority of blood donors in Brazil[37]), and also public health institutions personnel and health students. The study showed that Brazilians from different regions are more homogenous than previously thought by some based on the census alone. "Brazilian homogeneity is, therefore, a lot greater between Brazilian regions than within Brazilian regions".[38]
| Region[35] | European | African | Native American |
|---|---|---|---|
| Northern Brazil | 68.80% | 10.50% | 18.50% |
| Northeast of Brazil | 60.10% | 29.30% | 8.90% |
| Southeast Brazil | 74.20% | 17.30% | 7.30% |
| Southern Brazil | 79.50% | 10.30% | 9.40% |
According to a DNA study from 2010, "a new portrayal of each ethnicity contribution to the DNA of Brazilians, obtained with samples from the five regions of the country, has indicated that, on average, European ancestors are responsible for nearly 80% of the genetic heritage of the population. The variation between the regions is small, with the possible exception of the South, where the European contribution reaches nearly 90%. The results, published by the scientific magazine American Journal of Human Biology by a team of the Catholic University of Brasília, show that, in Brazil, physical indicators such as skin colour, colour of the eyes and colour of the hair have little to do with the genetic ancestry of each person, which has been shown in previous studies (regardless of census classification).[39] "Ancestry informative SNPs can be useful to estimate individual and population biogeographical ancestry. Brazilian population is characterized by a genetic background of three parental populations (European, African, and Brazilian Native Amerindians) with a wide degree and diverse patterns of admixture. In this work we analyzed the information content of 28 ancestry-informative SNPs into multiplexed panels using three parental population sources (African, Amerindian, and European) to infer the genetic admixture in an urban sample of the five Brazilian geopolitical regions. The SNPs assigned apart the parental populations from each other and thus can be applied for ancestry estimation in a three hybrid admixed population. Data was used to infer genetic ancestry in Brazilians with an admixture model. Pairwise estimates of F(st) among the five Brazilian geopolitical regions suggested little genetic differentiation only between the South and the remaining regions. Estimates of ancestry results are consistent with the heterogeneous genetic profile of Brazilian population, with a major contribution of European ancestry (0.771) followed by African (0.143) and Amerindian contributions (0.085). The described multiplexed SNP panels can be useful tool for bioanthropological studies but it can be mainly valuable to control for spurious results in genetic association studies in admixed populations".[40] It is important to note that "the samples came from free of charge paternity test takers, thus as the researchers made it explicit: "the paternity tests were free of charge, the population samples involved people of variable socioeconomic strata, although likely to be leaning slightly towards the ‘‘pardo’’ group".[41]
| Region[41] | European | African | Native American |
|---|---|---|---|
| North Region | 71.10% | 18.20% | 10.70% |
| Northeast Region | 77.40% | 13.60% | 8.90% |
| Central-West Region | 65.90% | 18.70% | 11.80% |
| Southeast Region | 79.90% | 14.10% | 6.10% |
| South Region | 87.70% | 7.70% | 5.20% |
An autosomal DNA study from 2009 found a similar profile "all the Brazilian samples (regions) lie more closely to the European group than to the African populations or to the Mestizos from Mexico".[42]
| Region[43] | European | African | Native American |
|---|---|---|---|
| North Region | 60.6% | 21.3% | 18.1% |
| Northeast Region | 66.7% | 23.3% | 10.0% |
| Central-West Region | 66.3% | 21.7% | 12.0% |
| Southeast Region | 60.7% | 32.0% | 7.3% |
| South Region | 81.5% | 9.3% | 9.2% |
According to another autosomal DNA study from 2008, by the University of Brasília (UnB), European ancestry dominates in the whole of Brazil (in all regions), accounting for 65.90% of heritage of the population, followed by the African contribution (24.80%) and the Native American (9.3%).[44]
São Paulo state, the most populous state in Brazil, with about 40 million people, showed the following composition, according to an autosomal study from 2006: European genes account for 79% of the heritage of the people of São Paulo, 14% are of African origin, and 7% Native American.[45] A more recent study, from 2013, found the following composition in São Paulo state: 61.9% European, 25.5% African and 11.6% Native American.[46]
Races and ethnicities by region

South
The South of Brazil is the region with the largest percentage of Whites. According to the 2005 census, people of European ancestry account for 79.6% of the population.[23] In colonial times, this region had a very small population.
The region what is now Southern Brazil was originally settled by Amerindian peoples, mostly Guarani and Kaingangs.[47] Only a few settlers from São Paulo were living there. This situation made the region vulnerable to attacks from neighboring countries. This fact forced the King of Portugal to decide to populate the region. For this, settlers from the Portuguese Azores islands were sent to the coast.
To stimulate the immigration to Brazil, the king offered several benefits for the Azorean couples. Between 1748 and 1756, six thousand Portuguese from the Azores moved to the coast of Santa Catarina. They were mainly newly married who were seeking a better life. At that time, the Azores were one of the poorest regions of Portugal. They established themselves mainly in the Santa Catarina Island, nowadays the region of Florianópolis. Later, some couples moved to Rio Grande do Sul, where they established Porto Alegre, the capital. The Azoreans lived on fishing and agriculture, especially flour. They composed over half of Rio Grande do Sul and Santa Catarina's population in the late 18th century.[48] [48] The state of Paraná was settled by colonists from São Paulo due to their proximity (Paraná was part of São Paulo until the mid-19th century).
With the development of cattle in the interior of Rio Grande do Sul, African slaves began arriving in large numbers. By 1822, Blacks were 50% of Rio Grande do Sul's population. This number decreased to 25% in 1858 and to only 5.2% in 2005. Most of them came from Angola.[49]
After independence from Portugal (1822) the Brazilian government started to stimulate the arrival of a new wave of immigrants to settle the South. In 1824 they established São Leopoldo, a German community. Major Schaeffer, a German who was living in Brazil, was sent to Germany in order to bring immigrants. From Rhineland-Palatinate, the Major brought the immigrants and soldiers. Settlers from Germany were brought to work as small farmers, because there were many land holdings without workers.
To attract the immigrants, the Brazilian government had promised large tracts of land, where they could settle with their families and colonize the region. The first years were not easy. Many Germans died of tropical disease, while others left the colonies to find better living conditions. The German colony of São Leopoldo was a disaster. Nevertheless, in the following years, a further 4,830 Germans arrived at São Leopoldo, and then the colony started to develop, with the immigrants establishing the town of Novo Hamburgo (New Hamburg).
From São Leopoldo and Novo Hamburgo, the German immigrants spread into others areas of Rio Grande do Sul, mainly close to sources of rivers. The whole region of Vale dos Sinos was populated by Germans. During the 1830s and part of the 1840s German immigration to Brazil was interrupted due to conflicts in the country (Ragamuffin War). The immigration restarted after 1845 with the creation of new colonies. The most important ones were Blumenau, in 1850, and Joinville in 1851, both in Santa Catarina state; these attracted thousands of German immigrants to the region. In the next five decades, other 28 thousand Germans were brought to Rio Grande do Sul to work as small farmers in the countryside.[50] By 1914, it is estimated that 50 thousand Germans settled in this state.
Another immigration boom to this region started in 1875. Communities with Italian immigrants were also created in southern Brazil. The first colonies to be populated by Italians were created in the highlands of Rio Grande do Sul (Serra Gaúcha). These were Garibaldi and Bento Gonçalves. These immigrants were predominantly from Veneto, in northern Italy. After five years, in 1880, the great numbers of Italian immigrants arriving caused the Brazilian government to create another Italian colony, Caxias do Sul. After initially settling in the government-promoted colonies, many of the Italian immigrants spread themselves into other areas of Rio Grande do Sul seeking further opportunities.
They created many other Italian colonies on their own, mainly in highlands, because the lowlands were already populated by Germans and native gaúchos. The Italian established many vineyards in the region. Nowadays, the wine produced in these areas of Italian colonization in southern Brazil is much appreciated within the country, though little is available for export. In 1875, the first Italian colonies were established in Santa Catarina, which lies immediately to the north of Rio Grande do Sul. The colonies gave rise to towns such as Criciúma, and later also spread further north, to Paraná.
A significant number of Poles have settled in Southern Brazil. The first immigrants arrived in 1869 and until 1959, it is estimated that over 100,000 Poles migrated to Brazil,[51] 95% of whom were peasants. The State of Paraná received the majority of Polish immigrants, who settled mainly in the region of Curitiba, in the towns of Mallet, Cruz Machado, São Matheus do Sul, Irati, and União da Vitória.
Southeast
The Southeastern region of Brazil is the most ethnically diverse part of the country. Whites make up 55.16% of its population, those of mixed-race 35.69%, and African descent 7.91%. It has the largest percentage of Asian Brazilians, composing 0.8%, and a small Amerindian community (0.2%).
Southeast Brazil is home to the oldest Portuguese village in the Americas, São Vicente, São Paulo, established in 1532.[52] The region, since the beginning of its colonization, is a melting pot of Whites, Indians and Blacks. The Amerindians of the region were enslaved by the Portuguese. The race mixing between the Indian females and their White masters produced the Bandeirante, the colonial inhabitant of São Paulo, who formed expeditions that crossed the interior of Brazil and greatly increased the Portuguese colonial territory. The main language spoken by these people of mixed Indian/Portuguese heritage was Língua geral, a language that mixed Tupi and Portuguese words.
In the late 17th century the Bandeirantes found gold in the area that nowadays is Minas Gerais. A gold rush took place in Brazil and thousands of Portuguese colonists arrived during this period. The confrontation between the Bandeirantes and the Portuguese for obtaining possession of the mines led to the Emboabas' War. The Portuguese won the war. The Amerindian culture declined, giving space to a stronger Portuguese cultural domination. In order to control the wealth, the Portuguese Crown moved the capital of Brazil from Salvador, Bahia to Rio de Janeiro. Thousands of African slaves were brought to work in the gold mines. They were landed in Rio de Janeiro and sent to other regions. By the late 18th century, Rio de Janeiro was an "African city": most of its inhabitants were slaves. No other place in the world had as many slaves since the end of the Roman Empire.[53] In 1808 the Portuguese Royal Family, fleeing from Napoleon, took charge in Rio de Janeiro. Some 15,000 Portuguese nobles moved to Brazil. The region changed a lot, becoming more European.
After independence and principally after 1850, Southeast Brazil was "inundated" by European immigrants, who were attracted by the government to replace the African slaves in the coffee plantations. Most immigrants landed in the Port of Santos and have been forwarded to the coffee farms within São Paulo. The vast majority of the immigrants came from Italy. Brazil attracted nearly 5 million immigrants between 1870 and 1953. The large number of Italians are visible in many parts of Southeast Brazil. Their descendants are nowadays predominant in many areas. For example, Northeast São Paulo is 65% Italian.[54]
The arrival of immigrants from several parts of Europe, the Middle-East and Asia produced an ethnically diverse population. The city of Bastos, in São Paulo, is 11.4% Japanese. The city of São Paulo is home to the largest Japanese population outside Japan itself. [55]
Northeast
The population of Northeast Brazil is a result of an intensive race mixing, which has occurred in the region for more than four centuries. According to the 2006 census people reported as "brown" make up 62.5% of the population. Those reported as Black account for 7.8%.
This region did not have much effect from the massive European immigration that took place in Southern Brazil in the late 19th century and first decades of the 20th century. The Northeast has been a poorer region of Brazil since the decline of sugar cane plantations in the late 17th century, so its economy did not require immigrants.
The ethnic composition of the population starts in the 16th century. The Portuguese settlers rarely brought women, which led to relationships with the Indian women. Later, interracial relationships occurred between Portuguese and African females. The coast, in the past the place where millions of Black slaves arrived (mostly from modern-day Angola, Ghana, Nigeria and Benin) to work in sugar-cane plantations, is where nowadays there is a predominance of Mulattoes, those of Black and White ancestry. Salvador, Bahia is considered the largest Black city outside of Africa, with over 80% of its inhabitants being African-Brazilians. In the interior, there is a predominance of Indian and White mixture.[56]
North
Northern Brazil, largely covered by the Amazon rainforest, is the Brazilian region with the largest Amerindian influences, both in culture and ethnicity. Inhabited by diverse indigenous tribes, this part of Brazil was reached by Portuguese and Spanish colonists in the 17th century, but it started to be populated by non-Indians only in the late 19th and early 20th centuries. The exploitation of rubber used in the growing industries of automobiles, has emerged a huge migration to the region.
Many people from the poor Northeast Brazil, mostly Ceará, moved to the Amazon area. The contact between the Indians and the northeastern rubbers created the base of the ethnic composition of the region, with its mixed-race majority.
Central-West
The Central-West region of Brazil was inhabited by diverse Indians when the Portuguese arrived in the early 18th century. The Portuguese came to explore the precious stones that were found there. Contact between the Portuguese and the Indians created a mixed-race population. Until the mid-20th century, Central-West Brazil had a very small population. The situation changed with the construction of Brasília, the new capital of Brazil, in 1960. Many workers were attracted to the region, mostly from northeastern Brazil.
A new wave of settlers started arriving from the 1970s. With the mechanization of agriculture in the South of Brazil, many rural workers of German and Italian origin migrated to Central-West Brazil. In some areas, they are already the majority of the population.
Education and health

The Federal Constitution of 1988 and the 1996 General Law of Education in Brazil (LDB) attributed to the Federal Government, states, Federal District and municipalities the responsibility of managing the Brazilian educational system, considering three educational public systems as a basis for collaboration between these federal systems. Each of these public educational systems is responsible for its own maintenance, which manages funds as well as mechanisms and sources for financial resources. The new Constitution reserves 25% of state and municipal taxes and 18% of federal taxes for education.[57]
As set out by the Brazilian Constitution, the main responsibility for basic education is attributed to the states and municipalities. Hence, a historical feature of Brazilian basic education is its extremely decentralized nature, which gives great organizational autonomy to sub-national governments (27 states and 5,546 municipalities) in organizing their educational systems. Early childhood education, from 0–6 years, is under exclusive responsibility of the municipalities. Responsibility for compulsory primary education from 1st to 9th grades is shared between states and municipalities. Kindergarten and pre-school education are the responsibility of local levels of government, whereas secondary schools are under the responsibility of the states. Maintenance of the system, including salaries, the definition of teacher career structures and supervision of early childhood, primary, and secondary levels (which make up basic education) is decentralized, and these levels are responsible for defining their respective curriculum content.
Higher education starts with undergraduate or sequential courses, which may offer different specialization choices such as academic or vocational paths. Depending on the choice, students may improve their educational background with Stricto Sensu or Lato Sensu postgraduate courses. Higher education has three main purposes: teaching, research and extension, each with their own specific contribution to make to a particular course. Diplomas and certificates are proof of having passed through higher education.
In 2003, the literacy rate was at 88 percent of the population, and the youth literacy rate (ages 15–19) was 93.2 percent.[57] However, Brazilian analysts tend to approach these favorable numbers with suspicion, considering the generally poor levels of performance displayed by students, especially in the public school network.
According to Brazilian Government, the most serious health problems are:[58]
- Childhood mortality: about 2.51% of childhood mortality, reaching 3.77% in the northeast region.
- Motherhood mortality: about 73.1 deaths per 100,000 born children in 2002.
- Mortality by non-transmissible illness: 151.7 deaths per 100,000 inhabitants caused by heart and circulatory diseases, along with 72.7 deaths per 100,000 inhabitants caused by cancer.
- Mortality caused by external causes (transportation, violence and suicide): 71.7 deaths per 100,000 inhabitants (14.9% of all deaths in the country), reaching 82.3 deaths in the southeast region.
Religion
According to the IBGE census 2010[59] 64.6% are Roman Catholics; 24% are Protestants and other Christians, 8% are agnostics, atheists or have no religion, 2% are followers of Spiritism, and 1% are members of other religions. Some of these are Jehovah's Witnesses (1,100,000), Latter-day Saints (200,000), Buddhism (215,000), Judaism (86,000), and Islam (27,000)[60] and some practice a mixture of different religions, such as Catholicism, Candomblé, and indigenous American religions .
Brazil has the largest Roman Catholic population in the world.
Followers of Protestantism are rising in number. Until 1970, the majority of Brazilian Protestants were adherents of "traditional churches", mostly Lutherans, Presbyterians and Baptists. There are 120,000 Episcopalians in 9 dioceses (Anglican Episcopal Church of Brazil). Since then, numbers of Pentecostal and Neopentecostal adherents have increased significantly.
Islam in Brazil was first practiced by African slaves.[61] Today, the Muslim population in Brazil is made up mostly of Arab immigrants. The US Department of State claims there is a recent trend of increased conversions to Islam among non-Arab citizens.[62]
The largest population of Buddhists in Latin America lives in Brazil, due greatly to Brazil's large Japanese population.
According to IBGE 2000 Census,[63] the following are the largest religious denominations in Brazil, with those with more than a half million members only shown.
| Rank | Group | Members | Other information |
|---|---|---|---|
| 1 | Roman Catholic Church | 135 million |
|
| 2 | Non-religious | 12.5 million |
|
| 3 | Assemblies of God (Assembléias de Deus) |
8.4 million |
|
| 4 | Baptist | 3.1 million |
|
| 5 | Christian Congregation of Brazil | 2.4 million | |
| 6 | Spiritism | 2.2 million |
|
| 7 | Universal Church of the Kingdom of God (Igreja Universal do Reino de Deus) |
2.1 million |
|
| 8 | Foursquare Gospel Church | 1.3 million |
|
| 9 | Adventists | 1.2 million |
|
| 10 | Jehovah's Witnesses | 1.1 million | |
| 11 | Lutherans | 1 million |
|
| 12 | Calvinists | 981,000 |
|
| 13 | God is Love Pentecostal Church | 774,000 |
|
| 14 | Afro-Brazilian | 525,000 |
|
| 15 | Brazilian Catholics | 500,000 | |
| – | Others and no religion declared | 3.5 million |
Languages

Portuguese is the only official language of Brazil.[64] It is spoken by nearly the entire population and is virtually the only language used in schools, newspapers, radio, TV and for all business and administrative purposes. Moreover, Brazil is the only Portuguese-speaking nation in the Americas, making the language an important part of Brazilian national identity.
Many Amerindian languages are spoken daily in indigenous communities, primarily in Northern Brazil. Although many of these communities have significant contact with Portuguese,[65] today there are incentives stimulating preservation and the teaching of native languages. According to SIL International, 133 Native American languages are currently endangered. Some of the largest indigenous language groups include Arawak, Carib, Macro-Gê and Tupi.[66] In 2006, the City of São Gabriel da Cachoeira in the region of Cabeça do Cachorro (Northwestern region of the State of Amazonas), has adopted some indigenous languages as some of its other official languages along with Portuguese.
Other languages are spoken by descendants of immigrants, who are usually bilingual, in small rural communities in Southern Brazil. The most important are the Brazilian German dialects, such as Riograndenser Hunsrückisch and the Pomeranian language, and also the Talian, based on the Italian Venetian language. In the city of São Paulo, Levantine Arabic, Japanese, Chinese and Korean can be heard in the immigrant neighborhoods, such as Liberdade.
The World Factbook demographic statistics
The following demographic statistics are from The World Factbook, unless otherwise indicated [67]
Nationality
- noun: Brazilian(s)
- adjective: Brazilian
Population
- 204,259,812
Languages
- Portuguese (official)
Ethnic groups
- White 47.7%
- Mulatto 43.1%
- Black 7.6%
- Asian 1.1%
- Indigenous 0.4%
Literacy
- Total population: 92.6%
- Male: 92.2%
- Female: 92.9% (2015 est.)
Religions
- Roman Catholic 64.6%
- Other Catholic 0.4%
- Protestant 22.2%
- Adventist (including Seventh-day Adventist and Adventist Church of Promise) 6.5%
- Assembly of God 2.0%
- Christian Congregation of Brazil 1.2%
- Universal Kingdom of God 1.0%
- Other Protestant 11.5%
- Other Christian 0.7%
- Spiritist 2.2%
- Other 1.4%
- None 8%
- Unspecified 0.4%
See also
- Brazil
- Race and ethnicity in Brazil
- Demographics of Rio de Janeiro
- List of largest cities in Brazil
- Racial democracy
- Brazilian Journal of Population Studies
References
- ↑ IPUMS International
- ↑ IBGE. 2008 PNAD
- ↑ Government of Brazil
- ↑ IBGE – Official population clock
- 1 2 http://esa.un.org/unpd/wpp/
- ↑ http://unstats.un.org/unsd/demographic/products/dyb/dyb2.htm
- ↑ IBGE – 2010 Census: Country faces decline of fertility
- 1 2 http://www.ibge.gov.br/english/estatistica/populacao/censo2010/caracteristicas_da_populacao/tabelas_pdf/tab3.pdf
- ↑ "IBGE releases population estimates for municipalities in 2016". IBGE. 2016-08-30. Retrieved 2016-08-31.
- ↑ "2010 Brazilian Institute of Geography and Statistics estimate". Brazilian Institute of Geography and Statistics. 29 November 2011. Retrieved 22 January 2011.
- ↑ Sapo.pt Imigrantes
- ↑ Country Studies Brazil
- ↑ "Entrada de imigrantes no Brasil – 1870/1907" (in Portuguese). Archived from the original on 13 June 2007. Retrieved 20 June 2007.
- ↑ "Entrada de imigrantes no Brasil – 1908/1953" (in Portuguese). Archived from the original on 13 June 2007. Retrieved 20 June 2007.
- ↑ http://www.schwartzman.org.br/simon/pdf/origem.pdf p.3
- ↑ /www.schwartzman.org.br/simon/pdf/origem.pdf Note 3, p.3
- ↑ /www.schwartzman.org.br/simon/pdf/origem.pdf Table 6, p.10
- ↑ Fora de foco: diversidade e identidade étnicas no Brasil
- ↑ FT.com, "Signs betray ‘hidden workers’ of Japan", retrieved 20 July 2007.
- 1 2 Amaral, Ernesto F. (2005) "Shaping Brazil: The Role of International Migration", Migration Policy Institute website. Retrieved 13 June 2007.
- ↑ "Jewish Roots of Brazil", Anita Novinsky, 1987
- ↑ Alves-Silva, J; da Silva Santos, M; Guimarães, PE; et al. (August 2000). "The ancestry of Brazilian mtDNA lineages". Am. J. Hum. Genet. 67: 444–61. doi:10.1086/303004. PMC 1287189
 . PMID 10873790.
 - 1 2 "PNDA Census 2005 race" (PDF) (in Portuguese). Retrieved 26 June 2007.
- ↑ Edward Eric Telles (2004). "Racial Classification". Race in Another America: the significance of skin color in Brazil. Princeton University Press. pp. 81–84. ISBN 0-691-11866-3.
- ↑ David I. Kertzer and Dominique Arel (2002). Census and Identity: The Politics of Race, Ethnicity, and Language in National Censuses. Cambridge University Press. pp. 63–64. ISBN 0-521-00427-6.
- ↑ http://journals.plos.org/plosone/article?id=10.1371/journal.pone.0017063
- ↑ http://web.archive.org/web/20151016224631/http://www.ibge.gov.br/english/estatistica/populacao/censo2010/caracteristicas_da_populacao/tabelas_pdf/tab3.pdf
- ↑ Racial Reality – White Americans
- ↑ El 56% de los argentinos tiene antepasados indígenas
- ↑ http://www.mae.es/es/MenuPpal/Paises/ArbolPaises/Brasil/Nota+pais/
- ↑ Pacific Island Travel web-site, accessed 4.8.08, taken from: Brazil: the Rough Guide, by David Cleary, Dilwyn Jenkins, Oliver Marshall, Jim Hine. ISBN 1-85828-223-3
- 1 2 http://onlinelibrary.wiley.com/doi/10.1002/ajhb.22714/abstract
- ↑ http://www.plosone.org/article/fetchObject.action?uri=info%3Adoi%2F10.1371%2Fjournal.pone.0075145&representation=PDF
- ↑ Lins, T. C.; Vieira, R. G.; Abreu, B. S.; Grattapaglia, D.; Pereira, R. W. (March–April 2009). "Genetic composition of Brazilian population samples based on a set of twenty-eight ancestry informative SNPs". American Journal of Human Biology. 22 (2): 187–192. doi:10.1002/ajhb.20976. PMID 19639555.
- 1 2 PLOS ONE: The Genomic Ancestry of Individuals from Different Geographical Regions of Brazil Is More Uniform Than Expected
- ↑ http://www4.ensp.fiocruz.br/informe/anexos/ric.pdf
- ↑ http://www.amigodoador.com.br/estatisticas.html Profile of the Brazilian blood donor
- ↑ Nossa herança europeia — CH
- ↑ DNA de brasileiro é 80% europeu, indica estudo
- ↑ Lins, TC; Vieira, RG; Abreu, BS; Grattapaglia, D; Pereira, RW (2010). "Genetic composition of Brazilian population samples based on a set of twenty-eight ancestry informative SNPs". Am. J. Hum. Biol. 22: 187–92. doi:10.1002/ajhb.20976. PMID 19639555.
- 1 2 Genetic composition of Brazilian population samples based on a set of twenty-eight ancestry informative SNPs – Lins – 2009 – American Journal of Human Biology – Wiley Online L...
- ↑ "Allele frequencies of 15 STRs in a representative sample of the Brazilian population.". Forensic Sci Int Genet. 4: e61–3. Feb 2010. doi:10.1016/j.fsigen.2009.05.006. PMID 20129458.
- ↑ Forensic Science International: Genetics. Allele frequencies of 15 STRs in a representative sample of the Brazilian population (inglés) basandos en estudios del IBGE de 2008. Se presentaron muestras de 12.886 individuos de distintas etnias, por regiones, provenían en un 8.26% del Norte, 23.86% del Nordeste, 4.79% del Centro-Oeste, 10.32% del Sudeste y 52.77% del Sur.
- ↑ the impact of migrations in the constitution of Latin American populations
- ↑ Genomic ancestry of a sample population from the state of São Paulo, Brazil – Ferreira – 2006 – American Journal of Human Biology – Wiley Online Library
- ↑ PLOS ONE: Revisiting the Genetic Ancestry of Brazilians Using Autosomal AIM-Indels
- ↑ Página do Gaúcho – Índios – Os grupos indígenas e sua distribuição
- 1 2 Imigrantes: Açorianos
- ↑ RS VIRTUAL – O Rio Grande do Sul na Internet – História – Colonização – Negros – A história dos gaúchos sem história
- ↑ Germans
- ↑ Uma história oculta: a imigração dos países da Europa do Centro-Leste para o Brasil
- ↑ RankBrasil – Livro Dos Recordes Brasileiros – Os melhores e maiores do Brasil
- ↑ Pdt – Rj
- ↑ Fundação Lorenzato
- ↑ São Paulo é tudo de bom – Turismo, eventos e entretenimento na cidade de São Paulo
- ↑ Regiões do Brasil
- 1 2 Japan Bank for International Cooperation report, November 2005, "Sector Study for Education in Brazil", retrieved 28 February 2007
- ↑ Ministério do Planejamento website, "Saúde" (fact sheet, 2002), retrieved 12 June 2007.
- ↑ IBGE - Instituto Brasileiro de Geografia e Estatística (Brazilian Institute for Geography and Statistics). 2010 Census. Accessed 07.08.2012.
- ↑ "Religion in Brazil" (pdf). IBGE. 2000. Retrieved 24 April 2007.
- ↑ Lovejoy, Paul E., Muslim Encounters With Slavery in Brazil, Markus Wiener Pub., 2007. ISBN 1-55876-378-3.
- ↑ US Department of State, "International Religious Freedom Report 2006", retrieved 5 June 2007
- ↑ (Portuguese) IBGE 2000 Census
- ↑ "Portuguese, the official language of Brazil". Brazilian Government official website. Retrieved 4 August 2007.
- ↑ "Portuguese throughout the world". Brazilian Government official website. Retrieved 4 August 2007.
- ↑ SIL International, "Línguas Indígenas do Brasil", retrieved 12 June 2007.
- ↑ "South America :: BRAZIL". CIA The World Factbook.
![]() This article incorporates public domain material from the CIA World Factbook document "2006 edition".
This article incorporates public domain material from the CIA World Factbook document "2006 edition".
External links
- United Nations "World Population Prospects": Country Profile – Brazil
- Population Statistics for Brazil
- Build Brazil population graph 1960 – 2013 (World Bank data)
- Build Brazil population projection graph till 2100 (United Nation data)
- Build Brazil life expectancy at birth graph 1950 – 2013 (United Nation data)
| |||||||||||||||||||||||||||||||||||||||||||||||||||||||||||||||||||||||||||
| Related topics | |||||||||||||||||||||||||||||||||||||||||||||||||||||||||||||||||||||||||||