Electroencephalography
| Electroencephalography | |
|---|---|
| Intervention | |
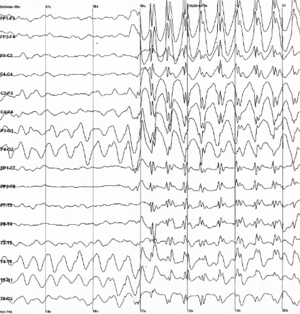 Epileptic spike and wave discharges monitored with EEG |
Electroencephalography (EEG) is an electrophysiological monitoring method to record electrical activity of the brain. It is typically noninvasive, with the electrodes placed along the scalp, although invasive electrodes are sometimes used in specific applications. EEG measures voltage fluctuations resulting from ionic current within the neurons of the brain.[1] In clinical contexts, EEG refers to the recording of the brain's spontaneous electrical activity over a period of time,[1] as recorded from multiple electrodes placed on the scalp. Diagnostic applications generally focus on the spectral content of EEG, that is, the type of neural oscillations (popularly called "brain waves") that can be observed in EEG signals.
EEG is most often used to diagnose epilepsy, which causes abnormalities in EEG readings.[2] It is also used to diagnose sleep disorders, coma, encephalopathies, and brain death. EEG used to be a first-line method of diagnosis for tumors, stroke and other focal brain disorders,[3] but this use has decreased with the advent of high-resolution anatomical imaging techniques such as magnetic resonance imaging (MRI) and computed tomography (CT). Despite limited spatial resolution, EEG continues to be a valuable tool for research and diagnosis, especially when millisecond-range temporal resolution (not possible with CT or MRI) is required.
Derivatives of the EEG technique include evoked potentials (EP), which involves averaging the EEG activity time-locked to the presentation of a stimulus of some sort (visual, somatosensory, or auditory). Event-related potentials (ERPs) refer to averaged EEG responses that are time-locked to more complex processing of stimuli; this technique is used in cognitive science, cognitive psychology, and psychophysiological research.
History


The history of EEG is detailed by Barbara E. Swartz in Electroencephalography and Clinical Neurophysiology.[4] In 1875, Richard Caton (1842–1926), a physician practicing in Liverpool, presented his findings about electrical phenomena of the exposed cerebral hemispheres of rabbits and monkeys in the British Medical Journal. In 1890, Polish physiologist Adolf Beck published an investigation of spontaneous electrical activity of the brain of rabbits and dogs that included rhythmic oscillations altered by light. Beck started experiments on the electrical brain activity of animals. Beck placed electrodes directly on the surface of brain to test for sensory stimulation. His observation of fluctuating brain activity lead to the conclusion of brain waves.[5]
In 1912, Ukrainian physiologist Vladimir Vladimirovich Pravdich-Neminsky published the first animal EEG and the evoked potential of the mammalian (dog).[6] In 1914, Napoleon Cybulski and Jelenska-Macieszyna photographed EEG recordings of experimentally induced seizures.
German physiologist and psychiatrist Hans Berger (1873–1941) recorded the first human EEG in 1924.[7] Expanding on work previously conducted on animals by Richard Caton and others, Berger also invented the electroencephalogram (giving the device its name), an invention described "as one of the most surprising, remarkable, and momentous developments in the history of clinical neurology".[8] His discoveries were first confirmed by British scientists Edgar Douglas Adrian and B. H. C. Matthews in 1934 and developed by them.
In 1934, Fisher and Lowenback first demonstrated epileptiform spikes. In 1935 Gibbs, Davis and Lennox described interictal spike waves and the three cycles/s pattern of clinical absence seizures, which began the field of clinical electroencephalography. Subsequently, in 1936 Gibbs and Jasper reported the interictal spike as the focal signature of epilepsy. The same year, the first EEG laboratory opened at Massachusetts General Hospital.
Franklin Offner (1911–1999), professor of biophysics at Northwestern University developed a prototype of the EEG that incorporated a piezoelectric inkwriter called a Crystograph (the whole device was typically known as the Offner Dynograph).
In 1947, The American EEG Society was founded and the first International EEG congress was held. In 1953 Aserinsky and Kleitman described REM sleep.
In the 1950s, William Grey Walter developed an adjunct to EEG called EEG topography, which allowed for the mapping of electrical activity across the surface of the brain. This enjoyed a brief period of popularity in the 1980s and seemed especially promising for psychiatry. It was never accepted by neurologists and remains primarily a research tool.
Medical use
A routine clinical EEG recording typically lasts 20–30 minutes (plus preparation time) and usually involves recording from scalp electrodes. Routine EEG is typically used in the following clinical circumstances:
- to distinguish epileptic seizures from other types of spells, such as psychogenic non-epileptic seizures, syncope (fainting), sub-cortical movement disorders and migraine variants.
- to differentiate "organic" encephalopathy or delirium from primary psychiatric syndromes such as catatonia
- to serve as an adjunct test of brain death
- to prognosticate, in certain instances, in patients with coma
- to determine whether to wean anti-epileptic medications
At times, a routine EEG is not sufficient, particularly when it is necessary to record a patient while he/she is having a seizure. In this case, the patient may be admitted to the hospital for days or even weeks, while EEG is constantly being recorded (along with time-synchronized video and audio recording). A recording of an actual seizure (i.e., an ictal recording, rather than an inter-ictal recording of a possibly epileptic patient at some period between seizures) can give significantly better information about whether or not a spell is an epileptic seizure and the focus in the brain from which the seizure activity emanates.
Epilepsy monitoring is typically done:
- to distinguish epileptic seizures from other types of spells, such as psychogenic non-epileptic seizures, syncope (fainting), sub-cortical movement disorders and migraine variants.
- to characterize seizures for the purposes of treatment
- to localize the region of brain from which a seizure originates for work-up of possible seizure surgery
Additionally, EEG may be used to monitor certain procedures:
- to monitor the depth of anesthesia
- as an indirect indicator of cerebral perfusion in carotid endarterectomy
- to monitor amobarbital effect during the Wada test
EEG can also be used in intensive care units for brain function monitoring:
- to monitor for non-convulsive seizures/non-convulsive status epilepticus
- to monitor the effect of sedative/anesthesia in patients in medically induced coma (for treatment of refractory seizures or increased intracranial pressure)
- to monitor for secondary brain damage in conditions such as subarachnoid hemorrhage (currently a research method)
If a patient with epilepsy is being considered for resective surgery, it is often necessary to localize the focus (source) of the epileptic brain activity with a resolution greater than what is provided by scalp EEG. This is because the cerebrospinal fluid, skull and scalp smear the electrical potentials recorded by scalp EEG. In these cases, neurosurgeons typically implant strips and grids of electrodes (or penetrating depth electrodes) under the dura mater, through either a craniotomy or a burr hole. The recording of these signals is referred to as electrocorticography (ECoG), subdural EEG (sdEEG) or intracranial EEG (icEEG)--all terms for the same thing. The signal recorded from ECoG is on a different scale of activity than the brain activity recorded from scalp EEG. Low voltage, high frequency components that cannot be seen easily (or at all) in scalp EEG can be seen clearly in ECoG. Further, smaller electrodes (which cover a smaller parcel of brain surface) allow even lower voltage, faster components of brain activity to be seen. Some clinical sites record from penetrating microelectrodes.[1] EEG may be done in all pediatric patients presenting with first onset afebrile or complex febrile seizures.[9] EEG is not indicated for diagnosing headache.[10] Recurring headache is a common pain problem, and this procedure is sometimes used in a search for a diagnosis, but it has no advantage over routine clinical evaluation.[10]
Research use
EEG, and the related study of ERPs are used extensively in neuroscience, cognitive science, cognitive psychology, neurolinguistics and psychophysiological research. Many EEG techniques used in research are not standardised sufficiently for clinical use. But research on mental disabilities, such as Auditory Processing Disorder (APD), ADD, or ADHD, is becoming more widely known and EEGs are used as research and treatment.
Advantages
Several other methods to study brain function exist, including functional magnetic resonance imaging (fMRI), positron emission tomography, magnetoencephalography (MEG), Nuclear magnetic resonance spectroscopy, Electrocorticography, Single-photon emission computed tomography, Near-infrared spectroscopy (NIRS), and Event-related optical signal (EROS). Despite the relatively poor spatial sensitivity of EEG, it possesses multiple advantages over some of these techniques:
- Hardware costs are significantly lower than those of most other techniques [11]
- EEG prevents limited availability of technologists to provide immediate care in high traffic hospitals.[12]
- EEG sensors can be used in more places than fMRI, SPECT, PET, MRS, or MEG, as these techniques require bulky and immobile equipment. For example, MEG requires equipment consisting of liquid helium-cooled detectors that can be used only in magnetically shielded rooms, altogether costing upwards of several million dollars;[13] and fMRI requires the use of a 1-ton magnet in, again, a shielded room.
- EEG has very high temporal resolution, on the order of milliseconds rather than seconds. EEG is commonly recorded at sampling rates between 250 and 2000 Hz in clinical and research settings, but modern EEG data collection systems are capable of recording at sampling rates above 20,000 Hz if desired. MEG and EROS are the only other noninvasive cognitive neuroscience techniques that acquire data at this level of temporal resolution.[13]
- EEG is relatively tolerant of subject movement, unlike most other neuroimaging techniques. There even exist methods for minimizing, and even eliminating movement artifacts in EEG data [14]
- EEG is silent, which allows for better study of the responses to auditory stimuli.
- EEG does not aggravate claustrophobia, unlike fMRI, PET, MRS, SPECT, and sometimes MEG[15]
- EEG does not involve exposure to high-intensity (>1 tesla) magnetic fields, as in some of the other techniques, especially MRI and MRS. These can cause a variety of undesirable issues with the data, and also prohibit use of these techniques with participants that have metal implants in their body, such as metal-containing pacemakers[16]
- EEG does not involve exposure to radioligands, unlike positron emission tomography.[17]
- ERP studies can be conducted with relatively simple paradigms, compared with IE block-design fMRI studies
- Extremely uninvasive, unlike Electrocorticography, which actually requires electrodes to be placed on the surface of the brain.
EEG also has some characteristics that compare favorably with behavioral testing:
- EEG can detect covert processing (i.e., processing that does not require a response)[18]
- EEG can be used in subjects who are incapable of making a motor response[19]
- Some ERP components can be detected even when the subject is not attending to the stimuli
- Unlike other means of studying reaction time, ERPs can elucidate stages of processing (rather than just the final end result)[20]
- EEG is a powerful tool for tracking brain changes during different phases of life. EEG sleep analysis can indicate significant aspects of the timing of brain development, including evaluating adolescent brain maturation.[21]
- In EEG there is a better understanding of what signal is measured as compared to other research techniques, i.e. the BOLD response in MRI.
Disadvantages
- Low spatial resolution on the scalp. fMRI, for example, can directly display areas of the brain that are active, while EEG requires intense interpretation just to hypothesize what areas are activated by a particular response.[22]
- EEG poorly measures neural activity that occurs below the upper layers of the brain (the cortex).
- Unlike PET and MRS, cannot identify specific locations in the brain at which various neurotransmitters, drugs, etc. can be found.[17]
- Often takes a long time to connect a subject to EEG, as it requires precise placement of dozens of electrodes around the head and the use of various gels, saline solutions, and/or pastes to keep them in place (although a cap can be used). While the length of time differs dependent on the specific EEG device used, as a general rule it takes considerably less time to prepare a subject for MEG, fMRI, MRS, and SPECT.
- Signal-to-noise ratio is poor, so sophisticated data analysis and relatively large numbers of subjects are needed to extract useful information from EEG[23]
With other neuroimaging techniques
Simultaneous EEG recordings and fMRI scans have been obtained successfully,[24][25] though successful simultaneous recording requires that several technical difficulties be overcome, such as the presence of ballistocardiographic artifact, MRI pulse artifact and the induction of electrical currents in EEG wires that move within the strong magnetic fields of the MRI. While challenging, these have been successfully overcome in a number of studies.[26]
MRI’s produce detailed images created by generating strong magnetic fields that may induce potentially harmful displacement force and torque. These fields produce potentially harmful radio frequency heating and create image artifacts rendering images useless. Due to these potential risks, only certain medical devices can be used in an MR environment.
Similarly, simultaneous recordings with MEG and EEG have also been conducted, which has several advantages over using either technique alone:
- EEG requires accurate information about certain aspects of the skull that can only be estimated, such as skull radius, and conductivities of various skull locations. MEG does not have this issue, and a simultaneous analysis allows this to be corrected for.
- MEG and EEG both detect activity below the surface of the cortex very poorly, and like EEG, the level of error increases with the depth below the surface of the cortex one attempts to examine. However, the errors are very different between the techniques, and combining them thus allows for correction of some of this noise.
- MEG has access to virtually no sources of brain activity below a few centimetres under the cortex. EEG, on the other hand, can receive signals from greater depth, albeit with a high degree of noise. Combining the two makes it easier to determine what in the EEG signal comes from the surface (since MEG is very accurate in examining signals from the surface of the brain), and what comes from deeper in the brain, thus allowing for analysis of deeper brain signals than either EEG or MEG on its own.[27]
Recently, a combined EEG/MEG (EMEG) approach has been investigated for the purpose of source reconstruction in epilepsy diagnosis.[28]
EEG has also been combined with positron emission tomography. This provides the advantage of allowing researchers to see what EEG signals are associated with different drug actions in the brain.[29]
Mechanisms
The brain's electrical charge is maintained by billions of neurons.[30] Neurons are electrically charged (or "polarized") by membrane transport proteins that pump ions across their membranes. Neurons are constantly exchanging ions with the extracellular milieu, for example to maintain resting potential and to propagate action potentials. Ions of similar charge repel each other, and when many ions are pushed out of many neurons at the same time, they can push their neighbours, who push their neighbours, and so on, in a wave. This process is known as volume conduction. When the wave of ions reaches the electrodes on the scalp, they can push or pull electrons on the metal in the electrodes. Since metal conducts the push and pull of electrons easily, the difference in push or pull voltages between any two electrodes can be measured by a voltmeter. Recording these voltages over time gives us the EEG.[31]
The electric potential generated by an individual neuron is far too small to be picked up by EEG or MEG.[32] EEG activity therefore always reflects the summation of the synchronous activity of thousands or millions of neurons that have similar spatial orientation. If the cells do not have similar spatial orientation, their ions do not line up and create waves to be detected. Pyramidal neurons of the cortex are thought to produce the most EEG signal because they are well-aligned and fire together. Because voltage fields fall off with the square of distance, activity from deep sources is more difficult to detect than currents near the skull.[33]
Scalp EEG activity shows oscillations at a variety of frequencies. Several of these oscillations have characteristic frequency ranges, spatial distributions and are associated with different states of brain functioning (e.g., waking and the various sleep stages). These oscillations represent synchronized activity over a network of neurons. The neuronal networks underlying some of these oscillations are understood (e.g., the thalamocortical resonance underlying sleep spindles), while many others are not (e.g., the system that generates the posterior basic rhythm). Research that measures both EEG and neuron spiking finds the relationship between the two is complex, with a combination of EEG power in the gamma band and phase in the delta band relating most strongly to neuron spike activity.[34]
Method
.jpg)
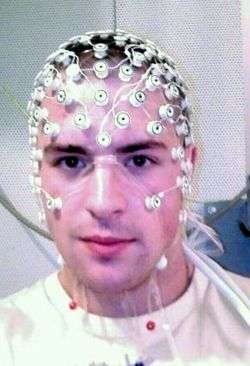
In conventional scalp EEG, the recording is obtained by placing electrodes on the scalp with a conductive gel or paste, usually after preparing the scalp area by light abrasion to reduce impedance due to dead skin cells. Many systems typically use electrodes, each of which is attached to an individual wire. Some systems use caps or nets into which electrodes are embedded; this is particularly common when high-density arrays of electrodes are needed.
Electrode locations and names are specified by the International 10–20 system[35] for most clinical and research applications (except when high-density arrays are used). This system ensures that the naming of electrodes is consistent across laboratories. In most clinical applications, 19 recording electrodes (plus ground and system reference) are used.[36] A smaller number of electrodes are typically used when recording EEG from neonates. Additional electrodes can be added to the standard set-up when a clinical or research application demands increased spatial resolution for a particular area of the brain. High-density arrays (typically via cap or net) can contain up to 256 electrodes more-or-less evenly spaced around the scalp.
Each electrode is connected to one input of a differential amplifier (one amplifier per pair of electrodes); a common system reference electrode is connected to the other input of each differential amplifier. These amplifiers amplify the voltage between the active electrode and the reference (typically 1,000–100,000 times, or 60–100 dB of voltage gain). In analog EEG, the signal is then filtered (next paragraph), and the EEG signal is output as the deflection of pens as paper passes underneath. Most EEG systems these days, however, are digital, and the amplified signal is digitized via an analog-to-digital converter, after being passed through an anti-aliasing filter. Analog-to-digital sampling typically occurs at 256–512 Hz in clinical scalp EEG; sampling rates of up to 20 kHz are used in some research applications.
During the recording, a series of activation procedures may be used. These procedures may induce normal or abnormal EEG activity that might not otherwise be seen. These procedures include hyperventilation, photic stimulation (with a strobe light), eye closure, mental activity, sleep and sleep deprivation. During (inpatient) epilepsy monitoring, a patient's typical seizure medications may be withdrawn.
The digital EEG signal is stored electronically and can be filtered for display. Typical settings for the high-pass filter and a low-pass filter are 0.5-1 Hz and 35–70 Hz, respectively. The high-pass filter typically filters out slow artifact, such as electrogalvanic signals and movement artifact, whereas the low-pass filter filters out high-frequency artifacts, such as electromyographic signals. An additional notch filter is typically used to remove artifact caused by electrical power lines (60 Hz in the United States and 50 Hz in many other countries).[1]
The EEG signals can be captured with opensource hardware such as OpenBCI and the signal can be processed by freely available EEG software such as EEGLAB or the Neurophysiological Biomarker Toolbox.
As part of an evaluation for epilepsy surgery, it may be necessary to insert electrodes near the surface of the brain, under the surface of the dura mater. This is accomplished via burr hole or craniotomy. This is referred to variously as "electrocorticography (ECoG)", "intracranial EEG (I-EEG)" or "subdural EEG (SD-EEG)". Depth electrodes may also be placed into brain structures, such as the amygdala or hippocampus, structures, which are common epileptic foci and may not be "seen" clearly by scalp EEG. The electrocorticographic signal is processed in the same manner as digital scalp EEG (above), with a couple of caveats. ECoG is typically recorded at higher sampling rates than scalp EEG because of the requirements of Nyquist theorem—the subdural signal is composed of a higher predominance of higher frequency components. Also, many of the artifacts that affect scalp EEG do not impact ECoG, and therefore display filtering is often not needed.
A typical adult human EEG signal is about 10 µV to 100 µV in amplitude when measured from the scalp[37] and is about 10–20 mV when measured from subdural electrodes.
Since an EEG voltage signal represents a difference between the voltages at two electrodes, the display of the EEG for the reading encephalographer may be set up in one of several ways. The representation of the EEG channels is referred to as a montage.
- Sequential montage
- Each channel (i.e., waveform) represents the difference between two adjacent electrodes. The entire montage consists of a series of these channels. For example, the channel "Fp1-F3" represents the difference in voltage between the Fp1 electrode and the F3 electrode. The next channel in the montage, "F3-C3," represents the voltage difference between F3 and C3, and so on through the entire array of electrodes.
- Referential montage
- Each channel represents the difference between a certain electrode and a designated reference electrode. There is no standard position for this reference; it is, however, at a different position than the "recording" electrodes. Midline positions are often used because they do not amplify the signal in one hemisphere vs. the other. Another popular reference is "linked ears," which is a physical or mathematical average of electrodes attached to both earlobes or mastoids.
- Average reference montage
- The outputs of all of the amplifiers are summed and averaged, and this averaged signal is used as the common reference for each channel.
- Laplacian montage
- Each channel represents the difference between an electrode and a weighted average of the surrounding electrodes.[38]
When analog (paper) EEGs are used, the technologist switches between montages during the recording in order to highlight or better characterize certain features of the EEG. With digital EEG, all signals are typically digitized and stored in a particular (usually referential) montage; since any montage can be constructed mathematically from any other, the EEG can be viewed by the electroencephalographer in any display montage that is desired.
The EEG is read by a clinical neurophysiologist or neurologist (depending on local custom and law regarding medical specialities), optimally one who has specific training in the interpretation of EEGs for clinical purposes. This is done by visual inspection of the waveforms, called graphoelements. The use of computer signal processing of the EEG—so-called Quantitative electroencephalography—is somewhat controversial when used for clinical purposes (although there are many research uses).
Limitations
EEG has several limitations. Most important is its poor spatial resolution.[39] EEG is most sensitive to a particular set of post-synaptic potentials: those generated in superficial layers of the cortex, on the crests of gyri directly abutting the skull and radial to the skull. Dendrites, which are deeper in the cortex, inside sulci, in midline or deep structures (such as the cingulate gyrus or hippocampus), or producing currents that are tangential to the skull, have far less contribution to the EEG signal.
EEG recordings do not directly capture axonal action potentials. An action potential can be accurately represented as a current quadrupole, meaning that the resulting field decreases more rapidly than the ones produced by the current dipole of post-synaptic potentials.[40] In addition, since EEGs represent averages of thousands of neurons, a large population of cells in synchronous activity is necessary to cause a significant deflection on the recordings. Action potentials are very fast and, as a consequence, the chances of field summation are slim. However, neural backpropagation, as a typically longer dendritic current dipole, can be picked up by EEG electrodes and is a reliable indication of the occurrence of neural output.
Not only do EEGs capture dendritic currents almost exclusively as opposed to axonal currents, they also show a preference for activity on populations of parallel dendrites and transmitting current in the same direction at the same time. Pyramidal neurons of cortical layers II/III and V extend apical dendrites to layer I. Currents moving up or down these processes underlie most of the signals produced by electroencephalography.[41]
Therefore, EEG provides information with a large bias to select neuron types, and generally should not be used to make claims about global brain activity. The meninges, cerebrospinal fluid and skull "smear" the EEG signal, obscuring its intracranial source.
It is mathematically impossible to reconstruct a unique intracranial current source for a given EEG signal,[1] as some currents produce potentials that cancel each other out. This is referred to as the inverse problem. However, much work has been done to produce remarkably good estimates of, at least, a localized electric dipole that represents the recorded currents.
EEG vs fMRI, fNIRS and PET
EEG has several strong points as a tool for exploring brain activity. EEGs can detect changes over milliseconds, which is excellent considering an action potential takes approximately 0.5-130 milliseconds to propagate across a single neuron, depending on the type of neuron.[42] Other methods of looking at brain activity, such as PET and fMRI have time resolution between seconds and minutes. EEG measures the brain's electrical activity directly, while other methods record changes in blood flow (e.g., SPECT, fMRI) or metabolic activity (e.g., PET, NIRS), which are indirect markers of brain electrical activity. EEG can be used simultaneously with fMRI so that high-temporal-resolution data can be recorded at the same time as high-spatial-resolution data, however, since the data derived from each occurs over a different time course, the data sets do not necessarily represent exactly the same brain activity. There are technical difficulties associated with combining these two modalities, including the need to remove the MRI gradient artifact present during MRI acquisition and the ballistocardiographic artifact (resulting from the pulsatile motion of blood and tissue) from the EEG. Furthermore, currents can be induced in moving EEG electrode wires due to the magnetic field of the MRI.
EEG can be used simultaneously with NIRS without major technical difficulties. There is no influence of these modalities on each other and a combined measurement can give useful information about electrical activity as well as local hemodynamics.
EEG vs MEG
EEG reflects correlated synaptic activity caused by post-synaptic potentials of cortical neurons. The ionic currents involved in the generation of fast action potentials may not contribute greatly to the averaged field potentials representing the EEG.[32][43] More specifically, the scalp electrical potentials that produce EEG are generally thought to be caused by the extracellular ionic currents caused by dendritic electrical activity, whereas the fields producing magnetoencephalographic signals[13] are associated with intracellular ionic currents.[44]
EEG can be recorded at the same time as MEG so that data from these complementary high-time-resolution techniques can be combined.
Studies on numerical modeling of EEG and MEG have also been done.[45]
Normal activity
-

One second of EEG signal
-
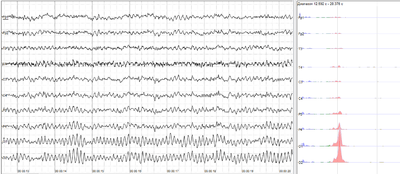
The sample of human EEG with prominent resting state activity - alpha-rhythm. Left - EEG traces (horizontal - time in seconds; vertical - amplitudes, scale 100uV). Right - power spectra of shown signals (vertical lines - 10 and 20 Hz, scale is linear). Alpha-rhythm consists of sinusoidal-like waves with frequencies in 8–12 Hz range (11 Hz in this case) more prominent in posterior sites. Alpha range is red at power spectrum graph.
-

The sample of human EEG with in resting state. Left - EEG traces (horizontal - time in seconds; vertical - amplitudes, scale 100uV). Right - power spectra of shown signals (vertical lines - 10 and 20 Hz, scale is linear). 80-90% of people have prominent sinusoidal-like waves with frequencies in 8–12 Hz range - alpha rhythm. Others (like this) lack this type of activity.
-

The samples of main types of artifacts in human EEG. 1 - Electrooculographic artifact caused by the excitation of eyeball's muscles (related to blinking, for example). Big amplitude, slow, positive wave prominent in frontal electrodes. 2 - Electrode's artifact caused by bad contact (and thus bigger impedance) between P3 electrode and skin. 3 - Swallowing artifact. 4 - Common reference electrode's artifact caused by bad contact between reference electrode and skin. Huge wave similar in all channels.
The EEG is typically described in terms of (1) rhythmic activity and (2) transients. The rhythmic activity is divided into bands by frequency. To some degree, these frequency bands are a matter of nomenclature (i.e., any rhythmic activity between 8–12 Hz can be described as "alpha"), but these designations arose because rhythmic activity within a certain frequency range was noted to have a certain distribution over the scalp or a certain biological significance. Frequency bands are usually extracted using spectral methods (for instance Welch) as implemented for instance in freely available EEG software such as EEGLAB or the Neurophysiological Biomarker Toolbox. Computational processing of the EEG is often named Quantitative electroencephalography (qEEG).
Most of the cerebral signal observed in the scalp EEG falls in the range of 1–20 Hz (activity below or above this range is likely to be artifactual, under standard clinical recording techniques). Waveforms are subdivided into bandwidths known as alpha, beta, theta, and delta to signify the majority of the EEG used in clinical practice.[46]
| Band | Frequency (Hz) | Location | Normally | Pathologically |
|---|---|---|---|---|
| Delta | < 4 | frontally in adults, posteriorly in children; high-amplitude waves |
|
|
| Theta | 4 – 7 | Found in locations not related to task at hand |
|
|
| Alpha | 8 – 15 | posterior regions of head, both sides, higher in amplitude on dominant side. Central sites (c3-c4) at rest |
|
|
| Beta | 16 – 31 | both sides, symmetrical distribution, most evident frontally; low-amplitude waves |
|
|
| Gamma | 32 + | Somatosensory cortex |
| |
| Mu | 8 – 12 | Sensorimotor cortex |
|
|
The practice of using only whole numbers in the definitions comes from practical considerations in the days when only whole cycles could be counted on paper records. This leads to gaps in the definitions, as seen elsewhere on this page. The theoretical definitions have always been more carefully defined to include all frequencies. Unfortunately there is no agreement in standard reference works on what these ranges should be - values for the upper end of alpha and lower end of beta include 12,13,14 and 15.If the threshold is taken as 14 Hz, then the slowest beta wave has about the same duration as the longest spike (70ms) which makes this the most useful value.
| Band | Frequency (Hz) | |
|---|---|---|
| Delta | < 4 | |
| Theta | ≥ 4 and < 8 | |
| Alpha | ≥ 8 and < 14 | |
| Beta | ≥ 14 |
Others sometimes divide the bands into sub bands for the purposes of data analysis.
Wave patterns

- Delta is the frequency range up to 4 Hz. It tends to be the highest in amplitude and the slowest waves. It is seen normally in adults in slow wave sleep. It is also seen normally in babies. It may occur focally with subcortical lesions and in general distribution with diffuse lesions, metabolic encephalopathy hydrocephalus or deep midline lesions. It is usually most prominent frontally in adults (e.g. FIRDA - Frontal Intermittent Rhythmic Delta) and posteriorly in children (e.g. OIRDA - Occipital Intermittent Rhythmic Delta).

- Theta is the frequency range from 4 Hz to 7 Hz. Theta is seen normally in young children. It may be seen in drowsiness or arousal in older children and adults; it can also be seen in meditation.[53] Excess theta for age represents abnormal activity. It can be seen as a focal disturbance in focal subcortical lesions; it can be seen in generalized distribution in diffuse disorder or metabolic encephalopathy or deep midline disorders or some instances of hydrocephalus. On the contrary this range has been associated with reports of relaxed, meditative, and creative states.

- Alpha is the frequency range from 7 Hz to 14 Hz. Hans Berger named the first rhythmic EEG activity he saw as the "alpha wave". This was the "posterior basic rhythm" (also called the "posterior dominant rhythm" or the "posterior alpha rhythm"), seen in the posterior regions of the head on both sides, higher in amplitude on the dominant side. It emerges with closing of the eyes and with relaxation, and attenuates with eye opening or mental exertion. The posterior basic rhythm is actually slower than 8 Hz in young children (therefore technically in the theta range). In addition to the posterior basic rhythm, there are other normal alpha rhythms such as the mu rhythm (alpha activity in the contralateral sensory and motor cortical areas) that emerges when the hands and arms are idle; and the "third rhythm" (alpha activity in the temporal or frontal lobes).[54][55] Alpha can be abnormal; for example, an EEG that has diffuse alpha occurring in coma and is not responsive to external stimuli is referred to as "alpha coma".


- Beta is the frequency range from 15 Hz to about 30 Hz. It is seen usually on both sides in symmetrical distribution and is most evident frontally. Beta activity is closely linked to motor behavior and is generally attenuated during active movements.[56] Low amplitude beta with multiple and varying frequencies is often associated with active, busy or anxious thinking and active concentration. Rhythmic beta with a dominant set of frequencies is associated with various pathologies and drug effects, especially benzodiazepines. It may be absent or reduced in areas of cortical damage. It is the dominant rhythm in patients who are alert or anxious or who have their eyes open.

- Gamma is the frequency range approximately 30–100 Hz. Gamma rhythms are thought to represent binding of different populations of neurons together into a network for the purpose of carrying out a certain cognitive or motor function.[1]
- Mu ranges 8–13 Hz., and partly overlaps with other frequencies. It reflects the synchronous firing of motor neurons in rest state. Mu suppression is thought to reflect motor mirror neuron systems, because when an action is observed, the pattern extinguishes, possibly because of the normal neuronal system and the mirror neuron system "go out of sync", and interfere with each other.[51]
"Ultra-slow" or "near-DC" (Direct current) activity is recorded using DC amplifiers in some research contexts. It is not typically recorded in a clinical context because the signal at these frequencies is susceptible to a number of artifacts.
Some features of the EEG are transient rather than rhythmic. Spikes and sharp waves may represent seizure activity or interictal activity in individuals with epilepsy or a predisposition toward epilepsy. Other transient features are normal: vertex waves and sleep spindles are seen in normal sleep.
Note that there are types of activity that are statistically uncommon, but not associated with dysfunction or disease. These are often referred to as "normal variants." The mu rhythm is an example of a normal variant.
The normal Electroencephalography (EEG) varies by age. The neonatal EEG is quite different from the adult EEG. The EEG in childhood generally has slower frequency oscillations than the adult EEG.
The normal EEG also varies depending on state. The EEG is used along with other measurements (EOG, EMG) to define sleep stages in polysomnography. Stage I sleep (equivalent to drowsiness in some systems) appears on the EEG as drop-out of the posterior basic rhythm. There can be an increase in theta frequencies. Santamaria and Chiappa cataloged a number of the variety of patterns associated with drowsiness. Stage II sleep is characterized by sleep spindles—transient runs of rhythmic activity in the 12–14 Hz range (sometimes referred to as the "sigma" band) that have a frontal-central maximum. Most of the activity in Stage II is in the 3–6 Hz range. Stage III and IV sleep are defined by the presence of delta frequencies and are often referred to collectively as "slow-wave sleep." Stages I-IV comprise non-REM (or "NREM") sleep. The EEG in REM (rapid eye movement) sleep appears somewhat similar to the awake EEG.
EEG under general anesthesia depends on the type of anesthetic employed. With halogenated anesthetics, such as halothane or intravenous agents, such as propofol, a rapid (alpha or low beta), nonreactive EEG pattern is seen over most of the scalp, especially anteriorly; in some older terminology this was known as a WAR (widespread anterior rapid) pattern, contrasted with a WAIS (widespread slow) pattern associated with high doses of opiates. Anesthetic effects on EEG signals are beginning to be understood at the level of drug actions on different kinds of synapses and the circuits that allow synchronized neuronal activity (see: http://www.stanford.edu/group/maciverlab/).
Artifacts
Biological artifacts
Electrical signals detected along the scalp by an EEG, but that originate from non-cerebral origin are called artifacts. EEG data is almost always contaminated by such artifacts. The amplitude of artifacts can be quite large relative to the size of amplitude of the cortical signals of interest. This is one of the reasons why it takes considerable experience to correctly interpret EEGs clinically. Some of the most common types of biological artifacts include:
- Eye-induced artifacts (includes eye blinks, eye movements and extra-ocular muscle activity)
- ECG (cardiac) artifacts
- EMG (muscle activation)-induced artifacts
- Glossokinetic artifacts
The most prominent eye-induced artifacts are caused by the potential difference between the cornea and retina, which is quite large compared to cerebral potentials. When the eyes and eyelids are completely still, this corneo-retinal dipole does not affect EEG. However, blinks occur several times per minute, the eyes movements occur several times per second. Eyelid movements, occurring mostly during blinking or vertical eye movements, elicit a large potential seen mostly in the difference between the Electrooculography (EOG) channels above and below the eyes. An established explanation of this potential regards the eyelids as sliding electrodes that short-circuit the positively charged cornea to the extra-ocular skin.[57][58] Rotation of the eyeballs, and consequently of the corneo-retinal dipole, increases the potential in electrodes towards which the eyes are rotated, and decrease the potentials in the opposing electrodes.[59] Eye movements called saccades also generate transient electromyographic potentials, known as saccadic spike potentials (SPs).[60] The spectrum of these SPs overlaps the gamma-band (see Gamma wave), and seriously confounds analysis of induced gamma-band responses,[61] requiring tailored artifact correction approaches.[60] Purposeful or reflexive eye blinking also generates electromyographic potentials, but more importantly there is reflexive movement of the eyeball during blinking that gives a characteristic artifactual appearance of the EEG (see Bell's phenomenon).
Eyelid fluttering artifacts of a characteristic type were previously called Kappa rhythm (or Kappa waves). It is usually seen in the prefrontal leads, that is, just over the eyes. Sometimes they are seen with mental activity. They are usually in the Theta (4–7 Hz) or Alpha (7–14 Hz) range. They were named because they were believed to originate from the brain. Later study revealed they were generated by rapid fluttering of the eyelids, sometimes so minute that it was difficult to see. They are in fact noise in the EEG reading, and should not technically be called a rhythm or wave. Therefore, current usage in electroencephalography refers to the phenomenon as an eyelid fluttering artifact, rather than a Kappa rhythm (or wave).[62]
Some of these artifacts can be useful in various applications. The EOG signals, for instance, can be used to detect[60] and track eye-movements, which are very important in polysomnography, and is also in conventional EEG for assessing possible changes in alertness, drowsiness or sleep.
ECG artifacts are quite common and can be mistaken for spike activity. Because of this, modern EEG acquisition commonly includes a one-channel ECG from the extremities. This also allows the EEG to identify cardiac arrhythmias that are an important differential diagnosis to syncope or other episodic/attack disorders.
Glossokinetic artifacts are caused by the potential difference between the base and the tip of the tongue. Minor tongue movements can contaminate the EEG, especially in parkinsonian and tremor disorders.
Environmental artifacts
In addition to artifacts generated by the body, many artifacts originate from outside the body. Movement by the patient, or even just settling of the electrodes, may cause electrode pops, spikes originating from a momentary change in the impedance of a given electrode. Poor grounding of the EEG electrodes can cause significant 50 or 60 Hz artifact, depending on the local power system's frequency. A third source of possible interference can be the presence of an IV drip; such devices can cause rhythmic, fast, low-voltage bursts, which may be confused for spikes.
Artifact correction
Recently, independent component analysis (ICA) techniques have been used to correct or remove EEG contaminants.[60][63][64][65][66][67] These techniques attempt to "unmix" the EEG signals into some number of underlying components. There are many source separation algorithms, often assuming various behaviors or natures of EEG. Regardless, the principle behind any particular method usually allow "remixing" only those components that would result in "clean" EEG by nullifying (zeroing) the weight of unwanted components. Fully automated artifact rejection methods, which use ICA, have also been developed.[68]
In the last few years, by comparing data from paralysed and unparalysed subjects, EEG contamination by muscle has been shown to be far more prevalent than had previously been realized, particularly in the gamma range above 20 Hz.[69] However, Surface Laplacian has been shown to be effective in eliminating muscle artefact, particularly for central electrodes, which are further from the strongest contaminants.[70] The combination of Surface Laplacian with automated techniques for removing muscle components using ICA proved particularly effective in a follow up study.[71]
Abnormal activity
Abnormal activity can broadly be separated into epileptiform and non-epileptiform activity. It can also be separated into focal or diffuse.
Focal epileptiform discharges represent fast, synchronous potentials in a large number of neurons in a somewhat discrete area of the brain. These can occur as interictal activity, between seizures, and represent an area of cortical irritability that may be predisposed to producing epileptic seizures. Interictal discharges are not wholly reliable for determining whether a patient has epilepsy nor where his/her seizure might originate. (See focal epilepsy.)
Generalized epileptiform discharges often have an anterior maximum, but these are seen synchronously throughout the entire brain. They are strongly suggestive of a generalized epilepsy.
Focal non-epileptiform abnormal activity may occur over areas of the brain where there is focal damage of the cortex or white matter. It often consists of an increase in slow frequency rhythms and/or a loss of normal higher frequency rhythms. It may also appear as focal or unilateral decrease in amplitude of the EEG signal.
Diffuse non-epileptiform abnormal activity may manifest as diffuse abnormally slow rhythms or bilateral slowing of normal rhythms, such as the PBR.
Intracortical Encephalogram electrodes and sub-dural electrodes can be used in tandem to discriminate and discretize artifact from epileptiform and other severe neurological events.
More advanced measures of abnormal EEG signals have also recently received attention as possible biomarkers for different disorders such as Alzheimer's disease.[72]
Remote communication
The United States Army Research Office budgeted $4 million in 2009 to researchers at the University of California, Irvine to develop EEG processing techniques to identify correlates of imagined speech and intended direction to enable soldiers on the battlefield to communicate via computer-mediated reconstruction of team members' EEG signals, in the form of understandable signals such as words.[73]
Economics
Inexpensive EEG devices exist for the low-cost research and consumer markets. Recently, a few companies have miniaturized medical grade EEG technology to create versions accessible to the general public. Some of these companies have built commercial EEG devices retailing for less than $100 USD.
- In 2004 OpenEEG released its ModularEEG as open source hardware. Compatible open source software includes a game for balancing a ball.
- In 2007 NeuroSky released the first affordable consumer based EEG along with the game NeuroBoy. This was also the first large scale EEG device to use dry sensor technology.[74]
- In 2008 OCZ Technology developed device for use in video games relying primarily on electromyography.
- In 2008 the Final Fantasy developer Square Enix announced that it was partnering with NeuroSky to create a game, Judecca.[75][76]
- In 2009 Mattel partnered with NeuroSky to release the Mindflex, a game that used an EEG to steer a ball through an obstacle course. By far the best selling consumer based EEG to date.[75][77]
- In 2009 Uncle Milton Industries partnered with NeuroSky to release the Star Wars Force Trainer, a game designed to create the illusion of possessing The Force.[75][78]
- In 2009 Emotiv released the EPOC, a 14 channel EEG device. The EPOC is the first commercial BCI to not use dry sensor technology, requiring users to apply a saline solution to electrode pads (which need remoistening after an hour or two of use).[79]
- In 2010, NeuroSky added a blink and electromyography function to the MindSet.[80]
- In 2011, NeuroSky released the MindWave, an EEG device designed for educational purposes and games.[81] The MindWave won the Guinness Book of World Records award for “Heaviest machine moved using a brain control interface”.[82]
- In 2011, Rhythmlink released Disposable WebbedTM EEG Electrodes, a flat, single-use EEG electrode. The Webbed Electrode provides a greater surface area to provide more area to be in contact with conductive material and a more comfortable experience for the patient.
- In 2012, a Japanese gadget project, neurowear, released Necomimi: a headset with motorized cat ears. The headset is a NeuroSky MindWave unit with two motors on the headband where a cat's ears might be. Slipcovers shaped like cat ears sit over the motors so that as the device registers emotional states the ears move to relate. For example, when relaxed, the ears fall to the sides and perk up when excited again.
- In 2014, OpenBCI released an eponymous Open Source brain-computer interface after a successful kickstarter campaign in 2013. The basic OpenBCI has 8 channels, expandable to 16, and supports EEG, EKG, and EMG. The OpenBCI is based on the Texas Instruments ADS1299 IC and the Arduino or PIC microcontroller, and costs $399 for the basic version. It uses standard metal cup electrodes and conductive paste.
- in 2015, mind solutions inc released the smallest consumer bci to date, the neurosync. A powerful single dry sensor eeg no bigger than a Bluetooth ear piece.[83]
Future research
The EEG has been used for many purposes besides the conventional uses of clinical diagnosis and conventional cognitive neuroscience. An early use was during World War II by the U.S. Army Air Corps to screen out pilots in danger of having seizures;[84] long-term EEG recordings in epilepsy patients are still used today for seizure prediction. Neurofeedback remains an important extension, and in its most advanced form is also attempted as the basis of brain computer interfaces. The EEG is also used quite extensively in the field of neuromarketing. In recent years, researchers have relied on EEG to understand the neural basis of swallowing.[85]
The EEG is altered by drugs that affect brain functions, the chemicals that are the basis for psychopharmacology. Berger's early experiments recorded the effects of drugs on EEG. The science of pharmaco-electroencephalography has developed methods to identify substances that systematically alter brain functions for therapeutic and recreational use.
Honda is attempting to develop a system to enable an operator to control its Asimo robot using EEG, a technology it eventually hopes to incorporate into its automobiles.[86]
EEGs have been used as an evidence in criminal trials in the Indian state of Maharashtra.[87][88]
A lot of research is currently being carried out in order to make EEG devices smaller, more portable and easier to use. So called "Wearable EEG" is based upon creating low power wireless collection electronics and ‘dry’ electrodes which do not require a conductive gel to be used.[89] Wearable EEG aims to provide small EEG devices which are present only on the head and which can record EEG for days, weeks, or months at a time, as ear-EEG. Such prolonged and easy-to-use monitoring could make a step change in the diagnosis of chronic conditions such as epilepsy, and greatly improve the end-user acceptance of BCI systems.
See also
- 10-20 system (EEG)
- Amplitude integrated electroencephalography
- Binaural beats
- Brain-computer interface
- Brainwave synchronization
- CAET-Canadian association of EEG Technology
- Cerebral function monitoring
- Comparison of consumer brain-computer interface devices
- Direct brain interfaces
- EEG measures during anesthesia
- EEG microstates
- Electrocorticography
- Electromagnetic Weapon
- Electroneurogram
- Electropalatograph
- Emotiv Systems
- European data format
- Event-related potential
- Evoked potential
- FieldTrip
- God helmet
- Hemoencephalography
- Hypersynchronization of electrophysiological activity in epilepsy
- Imagined Speech
- Induced activity
- Intracranial EEG
- Local field potentials
- Magnetoencephalography
- Mind machine
- Neural oscillations
- Neurofeedback
- Ongoing brain activity
- Spontaneous potential
References
- 1 2 3 4 5 6 Niedermeyer E.; da Silva F.L. (2004). Electroencephalography: Basic Principles, Clinical Applications, and Related Fields. Lippincot Williams & Wilkins. ISBN 0-7817-5126-8.
- ↑ Atlas of EEG & Seizure Semiology. B. Abou-Khalil; Musilus, K.E.; Elsevier, 2006.
- ↑ "EEG".
- ↑ Swartz, Barbara E. (1998). "The advantages of digital over analog recording techniques". Electroencephalography and Clinical Neurophysiology. 106 (2): 113–7. doi:10.1016/S0013-4694(97)00113-2. PMID 9741771.
- ↑ Coenen, Anton, Edward Fine, and Oksana Zayachkivska. (2014). "Adolf Beck: A Forgotten Pioneer In Electroencephalography.". Journal of the History of the Neurosciences. 23 (3): 276–286.
- ↑ Pravdich-Neminsky, VV. (1913). "Ein Versuch der Registrierung der elektrischen Gehirnerscheinungen". Zbl Physiol. 27: 951–60.
- ↑ Haas, L F (2003). "Hans Berger (1873-1941), Richard Caton (1842-1926), and electroencephalography". Journal of Neurology, Neurosurgery & Psychiatry. 74 (1): 9. doi:10.1136/jnnp.74.1.9. PMC 1738204
 . PMID 12486257.
 - ↑ Millet, David (2002). "The Origins of EEG". International Society for the History of the Neurosciences (ISHN).
- ↑ Dr Mohammed Ashfaque Tinmaswala, Dr Valinjker S.K, Dr Shilpa Hegde, Dr Parmeshwar Taware Electroencephalographic Abnormalities in First Onset Afebrile and Complex Febrile Seizures and Its Association with Type of Seizures. http://jmscr.igmpublication.org/v3-i8/28%20jmscr.pdf
- 1 2 American Academy of Neurology. "Five Things Physicians and Patients Should Question". Choosing Wisely: an initiative of the ABIM Foundation. American Academy of Neurology. Retrieved August 1, 2013, which cites
- Gronseth, G. S.; Greenberg, M. K. (1995). "The utility of the electroencephalogram in the evaluation of patients presenting with headache: A review of the literature". Neurology. 45 (7): 1263–1267. doi:10.1212/WNL.45.7.1263. PMID 7617180.
- ↑ Vespa, Paul M.; Nenov, Val; Nuwer, Marc R. (1999). "Continuous EEG Monitoring in the Intensive Care Unit: Early Findings and Clinical Efficacy". Journal of Clinical Neurophysiology. 16 (1): 1–13. doi:10.1097/00004691-199901000-00001. PMID 10082088.
- ↑ Schultz, Teal L. (2012). "Technical Tips: MRI Compatible EEG Electrodes: Advantages, Disadvantages, And Financial Feasibility In A Clinical Setting.". Neurodiagnostic Journal 52.1: 69–81.
- 1 2 3 Hämäläinen, Matti; Hari, Riitta; Ilmoniemi, Risto J.; Knuutila, Jukka; Lounasmaa, Olli V. (1993). "Magnetoencephalography-theory, instrumentation, and applications to noninvasive studies of the working human brain". Reviews of Modern Physics. 65 (2): 413–97. Bibcode:1993RvMP...65..413H. doi:10.1103/RevModPhys.65.413.
- ↑ O'Regan, S; Faul, S; Marnane, W (2010). "2010 Annual International Conference of the IEEE Engineering in Medicine and Biology": 6353–6. doi:10.1109/IEMBS.2010.5627282. ISBN 978-1-4244-4123-5.
|chapter=ignored (help) - ↑ Murphy, Kieran J.; Brunberg, James A. (1997). "Adult claustrophobia, anxiety and sedation in MRI". Magnetic Resonance Imaging. 15 (1): 51–4. doi:10.1016/S0730-725X(96)00351-7. PMID 9084025.
- ↑ Schenck, John F. (1996). "The role of magnetic susceptibility in magnetic resonance imaging: MRI magnetic compatibility of the first and second kinds". Medical Physics. 23 (6): 815–50. doi:10.1118/1.597854. PMID 8798169.
- 1 2 Yasuno, Fumihiko; Brown, Amira K; Zoghbi, Sami S; Krushinski, Joseph H; Chernet, Eyassu; Tauscher, Johannes; Schaus, John M; Phebus, Lee A; Chesterfield, Amy K; Felder, Christian C; Gladding, Robert L; Hong, Jinsoo; Halldin, Christer; Pike, Victor W; Innis, Robert B (2007). "The PET Radioligand \11C]MePPEP Binds Reversibly and with High Specific Signal to Cannabinoid CB1 Receptors in Nonhuman Primate Brain". Neuropsychopharmacology. 33 (2): 259–69. doi:10.1038/sj.npp.1301402. PMID 17392732.
- ↑ Mulholland, Thomas (2012). "Objective EEG Methods for Studying Covert Shifts of Visual Attention". In McGuigan, F. J.; Schoonover, R. A. The Psychophysiology of Thinking: Studies of Covert Processes. pp. 109–51. ISBN 978-0-323-14700-2.
- ↑ Hinterberger, Thilo; Kübler, Andrea; Kaiser, Jochen; Neumann, Nicola; Birbaumer, Niels (2003). "A brain–computer interface (BCI) for the locked-in: Comparison of different EEG classifications for the thought translation device". Clinical Neurophysiology. 114 (3): 416–25. doi:10.1016/S1388-2457(02)00411-X. PMID 12705422.
- ↑ Sereno, SC; Rayner, K; Posner, MI (1998). "Establishing a time-line of word recognition: Evidence from eye movements and event-related potentials". NeuroReport. 9 (10): 2195–200. doi:10.1097/00001756-199807130-00009. PMID 9694199.
- ↑ Feinberg, I.; Campbell, I. G. (2012). "Longitudinal sleep EEG trajectories indicate complex patterns of adolescent brain maturation". AJP: Regulatory, Integrative and Comparative Physiology. 304 (4): R296–303. doi:10.1152/ajpregu.00422.2012. PMC 3567357. PMID 23193115. Lay summary – ScienceDaily (March 19, 2013).
- ↑ Srinivasan, Ramesh (1999). "Methods to Improve the Spatial Resolution of EEG". International Journal. 1 (1): 102–11.
- ↑ Schlögl, Alois; Slater, Mel; Pfurtscheller, Gert (2002). "Presence research and EEG" (PDF).
- ↑ Horovitz, Silvina G.; Skudlarski, Pawel; Gore, John C. (2002). "Correlations and dissociations between BOLD signal and P300 amplitude in an auditory oddball task: A parametric approach to combining fMRI and ERP". Magnetic Resonance Imaging. 20 (4): 319–25. doi:10.1016/S0730-725X(02)00496-4. PMID 12165350.
- ↑ Laufs, H; Kleinschmidt, A; Beyerle, A; Eger, E; Salek-Haddadi, A; Preibisch, C; Krakow, K (2003). "EEG-correlated fMRI of human alpha activity". NeuroImage. 19 (4): 1463–76. doi:10.1016/S1053-8119(03)00286-6. PMID 12948703.
- ↑ Difrancesco, Mark W.; Holland, Scott K.; Szaflarski, Jerzy P. (2008). "Simultaneous EEG/Functional Magnetic Resonance Imaging at 4 Tesla: Correlates of Brain Activity to Spontaneous Alpha Rhythm During Relaxation". Journal of Clinical Neurophysiology. 25 (5): 255–64. doi:10.1097/WNP.0b013e3181879d56. PMC 2662486. PMID 18791470.
- ↑ Huizenga, HM; Van Zuijen, TL; Heslenfeld, DJ; Molenaar, PC (2001). "Simultaneous MEG and EEG source analysis". Physics in medicine and biology. 46 (7): 1737–51. doi:10.1088/0031-9155/46/7/301. PMID 11474922.
- ↑ Aydin Ü, Vorwerk J, Dümpelmann M, Küpper P, Kugel H, Heers M, Wellmer J, Kellinghaus C, Haueisen J, Rampp S, Stefan H, Wolters CH (2015). "Combined EEG/MEG can outperform single modality EEG or MEG source reconstruction in presurgical epilepsy diagnosis". Plos One (Review). 10 (3): e0118753. doi:10.1371/journal.pone.0118753. PMC 4356563. PMID 25761059.
- ↑ Schreckenberger, Mathias; Lange-Asschenfeldt, Christian; Lochmann, Matthias; Mann, Klaus; Siessmeier, Thomas; Buchholz, Hans-Georg; Bartenstein, Peter; Gründer, Gerhard (2004). "The thalamus as the generator and modulator of EEG alpha rhythm: A combined PET/EEG study with lorazepam challenge in humans". NeuroImage. 22 (2): 637–44. doi:10.1016/j.neuroimage.2004.01.047. PMID 15193592.
- ↑ The Human Brain in Numbers"The Human Brain in Numbers". NIH.
- ↑ Tatum, W. O., Husain, A. M., Benbadis, S. R. (2008) "Handbook of EEG Interpretation" Demos Medical Publishing.
- 1 2 Nunez PL, Srinivasan R (1981). Electric fields of the brain: The neurophysics of EEG. Oxford University Press.
- ↑ Klein, S.; Thorne, B. M. (3 October 2006). Biological psychology. New York, N.Y.: Worth. ISBN 0-7167-9922-7.
- ↑ Whittingstall, Kevin; Logothetis, Nikos K. (2009). "Frequency-Band Coupling in Surface EEG Reflects Spiking Activity in Monkey Visual Cortex". Neuron. 64 (2): 281–9. doi:10.1016/j.neuron.2009.08.016. PMID 19874794.
- ↑ Towle, Vernon L.; Bolaños, José; Suarez, Diane; Tan, Kim; Grzeszczuk, Robert; Levin, David N.; Cakmur, Raif; Frank, Samuel A.; Spire, Jean-Paul (1993). "The spatial location of EEG electrodes: Locating the best-fitting sphere relative to cortical anatomy". Electroencephalography and Clinical Neurophysiology. 86 (1): 1–6. doi:10.1016/0013-4694(93)90061-Y. PMID 7678386.
- ↑ &Na; (1994). "Guideline Seven A Proposal for Standard Montages to Be Used in Clinical EEG". Journal of Clinical Neurophysiology. 11 (1): 30–6. doi:10.1097/00004691-199401000-00008. PMID 8195424.
- ↑ Aurlien, H; Gjerde, I.O; Aarseth, J.H; Eldøen, G; Karlsen, B; Skeidsvoll, H; Gilhus, N.E (2004). "EEG background activity described by a large computerized database". Clinical Neurophysiology. 115 (3): 665–73. doi:10.1016/j.clinph.2003.10.019. PMID 15036063.
- ↑ Nunez, Paul L.; Pilgreen, Kenneth L. (1991). "The Spline-Laplacian in Clinical Neurophysiology". Journal of Clinical Neurophysiology. 8 (4): 397–413. doi:10.1097/00004691-199110000-00005. PMID 1761706.
- ↑ Kondylis, Efstathios D. (2014). "Detection Of High-Frequency Oscillations By Hybrid Depth Electrodes In Standard Clinical Intracranial EEG Recordings.". Frontiers in Neurology. 5: 1–10. doi:10.3389/fneur.2014.00149.
- ↑ Hämäläinen, Matti; Hari, Riitta; Ilmoniemi, Risto J.; Knuutila, Jukka; Lounasmaa, Olli V. (1993). "Magnetoencephalography—theory, instrumentation, and applications to noninvasive studies of the working human brain". Reviews of Modern Physics. 65 (2): 413–497. Bibcode:1993RvMP...65..413H. doi:10.1103/RevModPhys.65.413.
- ↑ Murakami, S.; Okada, Y. (13 April 2006). "Contributions of principal neocortical neurons to magnetoencephalography and electroencephalography signals". The Journal of Physiology. 575 (3): 925–936. doi:10.1113/jphysiol.2006.105379.
- ↑ Anderson, J. (22 October 2004). Cognitive Psychology and Its Implications (Hardcover) (6th ed.). New York, NY: Worth. p. 17. ISBN 0-7167-0110-3.
- ↑ Creutzfeldt, Otto D; Watanabe, Satoru; Lux, Hans D (1966). "Relations between EEG phenomena and potentials of single cortical cells. I. Evoked responses after thalamic and epicortical stimulation". Electroencephalography and Clinical Neurophysiology. 20 (1): 1–18. doi:10.1016/0013-4694(66)90136-2. PMID 4161317.
- ↑ Buzsaki G (2006). Rhythms of the brain. Oxford University Press. ISBN 0-19-530106-4.
- ↑ Tanzer Oguz I. (2006). Numerical Modeling in Electro- and Magnetoencephalography, Ph.D. Thesis. Helsinki University of Technology. ISBN 9512280914.
- ↑ Tatum, William O. (2014). "Ellen R. Grass Lecture: Extraordinary EEG.". Neurodiagnostic Journal 54.1: 3–21.
- 1 2 Kirmizi-Alsan, Elif; Bayraktaroglu, Zubeyir; Gurvit, Hakan; Keskin, Yasemin H.; Emre, Murat; Demiralp, Tamer (2006). "Comparative analysis of event-related potentials during Go/NoGo and CPT: Decomposition of electrophysiological markers of response inhibition and sustained attention". Brain Research. 1104 (1): 114–28. doi:10.1016/j.brainres.2006.03.010. PMID 16824492.
- ↑ Kisley, Michael A.; Cornwell, Zoe M. (2006). "Gamma and beta neural activity evoked during a sensory gating paradigm: Effects of auditory, somatosensory and cross-modal stimulation". Clinical Neurophysiology. 117 (11): 2549–63. doi:10.1016/j.clinph.2006.08.003. PMC 1773003. PMID 17008125.
- ↑ Kanayama, Noriaki; Sato, Atsushi; Ohira, Hideki (2007). "Crossmodal effect with rubber hand illusion and gamma-band activity". Psychophysiology. 44 (3): 392–402. doi:10.1111/j.1469-8986.2007.00511.x. PMID 17371495.
- ↑ Gastaut, H (1952). "Electrocorticographic study of the reactivity of rolandic rhythm". Revue neurologique. 87 (2): 176–82. PMID 13014777.
- 1 2 Oberman, Lindsay M.; Hubbard, Edward M.; McCleery, Joseph P.; Altschuler, Eric L.; Ramachandran, Vilayanur S.; Pineda, Jaime A. (2005). "EEG evidence for mirror neuron dysfunction in autism spectrum disorders". Cognitive Brain Research. 24 (2): 190–8. doi:10.1016/j.cogbrainres.2005.01.014. PMID 15993757.
- ↑ Recommendations for the Practice of Clinical Neurophysiology: Guidelines of the International Federation of Clinical Physiology (EEG Suppl. 52) Editors: G. Deuschl and A. Eisen q 1999 International Federation of Clinical Neurophysiology. All rights reserved. Published by Elsevier Science B.V.
- ↑ Cahn, B. Rael; Polich, John (2006). "Meditation states and traits: EEG, ERP, and neuroimaging studies". Psychological Bulletin. 132 (2): 180–211. doi:10.1037/0033-2909.132.2.180. PMID 16536641.
- ↑ Niedermeyer, E (1997). "Alpha rhythms as physiological and abnormal phenomena". International Journal of Psychophysiology. 26 (1–3): 31–49. doi:10.1016/S0167-8760(97)00754-X. PMID 9202993.
- ↑ Feshchenko, Vladimir A.; Reinsel, Ruth A.; Veselis, Robert A. (2001). "Multiplicity of the α Rhythm in Normal Humans". Journal of Clinical Neurophysiology. 18 (4): 331–44. doi:10.1097/00004691-200107000-00005. PMID 11673699.
- ↑ Pfurtscheller, G.; Lopes Da Silva, F.H. (1999). "Event-related EEG/MEG synchronization and desynchronization: Basic principles". Clinical Neurophysiology. 110 (11): 1842–57. doi:10.1016/S1388-2457(99)00141-8. PMID 10576479.
- ↑ Barry, W; Jones, GM (1965). "Influence of Eye Lid Movement Upon Electro-Oculographic Recording of Vertical Eye Movements". Aerospace medicine. 36: 855–8. PMID 14332336.
- ↑ Iwasaki, Masaki; Kellinghaus, Christoph; Alexopoulos, Andreas V.; Burgess, Richard C.; Kumar, Arun N.; Han, Yanning H.; Lüders, Hans O.; Leigh, R. John (2005). "Effects of eyelid closure, blinks, and eye movements on the electroencephalogram". Clinical Neurophysiology. 116 (4): 878–85. doi:10.1016/j.clinph.2004.11.001. PMID 15792897.
- ↑ Lins, Otavio G.; Picton, Terence W.; Berg, Patrick; Scherg, Michael (1993). "Ocular artifacts in EEG and event-related potentials I: Scalp topography". Brain Topography. 6 (1): 51–63. doi:10.1007/BF01234127. PMID 8260327.
- 1 2 3 4 Keren, Alon S.; Yuval-Greenberg, Shlomit; Deouell, Leon Y. (2010). "Saccadic spike potentials in gamma-band EEG: Characterization, detection and suppression". NeuroImage. 49 (3): 2248–63. doi:10.1016/j.neuroimage.2009.10.057. PMID 19874901.
- ↑ Yuval-Greenberg, Shlomit; Tomer, Orr; Keren, Alon S.; Nelken, Israel; Deouell, Leon Y. (2008). "Transient Induced Gamma-Band Response in EEG as a Manifestation of Miniature Saccades". Neuron. 58 (3): 429–41. doi:10.1016/j.neuron.2008.03.027. PMID 18466752.
- ↑ Epstein, Charles M. (1983). Introduction to EEG and evoked potentials. J. B. Lippincot Co. ISBN 0-397-50598-1.
- ↑ Jung, Tzyy-Ping; Makeig, Scott; Humphries, Colin; Lee, Te-Won; McKeown, Martin J.; Iragui, Vicente; Sejnowski, Terrence J. (2000). "Removing electroencephalographic artifacts by blind source separation". Psychophysiology. 37 (2): 163–78. doi:10.1017/S0048577200980259. PMID 10731767.
- ↑ Jung, Tzyy-Ping; Makeig, Scott; Westerfield, Marissa; Townsechesne, Eric; Sejnowski, Terrence J. (2000). "Removal of eye activity artifacts from visual event-related potentials in normal and clinical subjects". Clinical Neurophysiology. 111 (10): 1745–58. doi:10.1016/S1388-2457(00)00386-2. PMID 11018488.
- ↑ Joyce, Carrie A.; Gorodnitsky, Irina F.; Kutas, Marta (2004). "Automatic removal of eye movement and blink artifacts from EEG data using blind component separation". Psychophysiology. 41 (2): 313–25. doi:10.1111/j.1469-8986.2003.00141.x. PMID 15032997.
- ↑ Fitzgibbon, Sean P; Powers, David M W; Pope, Kenneth J; Clark, C Richard (2007). "Removal of EEG noise and artifact using blind source separation". Journal of Clinical Neurophysiology. 24 (3): 232–243. doi:10.1097/WNP.0b013e3180556926. PMID 17545826.
- ↑ Shackman, Alexander J.; McMenamin, Brenton W.; Maxwell, Jeffrey S.; Greischar, Lawrence L.; Davidson, Richard J. (2010). "Identifying robust and sensitive frequency bands for interrogating neural oscillations". NeuroImage. 51 (4): 1319–33. doi:10.1016/j.neuroimage.2010.03.037. PMC 2871966. PMID 20304076.
- ↑ Nolan, H.; Whelan, R.; Reilly, R.B. (2010). "FASTER: Fully Automated Statistical Thresholding for EEG artifact Rejection". Journal of Neuroscience Methods. 192 (1): 152–62. doi:10.1016/j.jneumeth.2010.07.015. PMID 20654646.
- ↑ Whitham, Emma M; Pope, Kenneth J; Fitzgibbon, Sean P; Lewis, Trent W; Clark, C Richard; Loveless, Stephen; Broberg, Marita; Wallace, Angus; DeLosAngeles, Dylan; Lillie, Peter; et al. (2007). "Scalp electrical recording during paralysis: Quantitative evidence that EEG frequencies above 20Hz are contaminated by EMG". Clinical Neurophysiology. Elsevier. 118 (8): 1877–1888. doi:10.1016/j.clinph.2007.04.027. PMID 17574912.
- ↑ Fitzgibbon, Sean P; Lewis, Trent W; Powers, David M W; Whitham, Emma M; Willoughby, John O; Pope, Kenneth J (2013). "Surface Laplacian of Central Scalp Electrical Signals is Insensitive to Muscle Contamination". IEEE Transactions on Biomedical Engineering. IEEE. 60 (1): 4–9. doi:10.1109/TBME.2012.2195662. PMID 22542648.
- ↑ Fitzgibbon, Sean P; DeLosAngeles, Dylan; Lewis, Trent W; Powers, David MW; Whitham, Emma M; Willoughby, John O; Pope, Kenneth J (2014). "Surface Laplacian of scalp electrical signals and independent component analysis resolve EMG contamination of electroencephalogram". Journal International Journal of Psychophysiology. Elsevier.
- ↑ Montez, Teresa; Poil, S.-S.; Jones, B. F.; Manshanden, I.; Verbunt, J. P. A.; Van Dijk, B. W.; Brussaard, A. B.; Van Ooyen, A.; Stam, C. J.; Scheltens, P.; Linkenkaer-Hansen, K. (2009). "Altered temporal correlations in parietal alpha and prefrontal theta oscillations in early-stage Alzheimer disease". Proceedings of the National Academy of Sciences. 106 (5): 165–70. Bibcode:2009PNAS..106.1614M. doi:10.1073/pnas.0811699106. PMC 2635782. PMID 19164579.
- ↑ MURI: Synthetic Telepathy. Cnslab.ss.uci.ed m mm m m Retrieved 2011-07-19.
- ↑ "Mind Games". The Economist. 2007-03-23.
- 1 2 3 Li, Shan (2010-08-08). "Mind reading is on the market". Los Angeles Times.
- ↑ "Brains-on with NeuroSky and Square Enix's Judecca mind-control game". Engadget. Retrieved 2010-12-02.
- ↑ "New games powered by brain waves". Physorg.com. Retrieved 2010-12-02.
- ↑ Snider, Mike (2009-01-07). "Toy trains 'Star Wars' fans to use The Force". USA Today. Retrieved 2010-05-01.
- ↑ "Emotiv Systems Homepage". Emotiv.com. Retrieved 2009-12-29.
- ↑ "News - NeuroSky Upgrades SDK, Allows For Eye Blink, Brainwave-Powered Games". Gamasutra. 2010-06-30. Retrieved 2010-12-02.
- ↑ Fiolet, Eliane. "NeuroSky MindWave Brings Brain-Computer Interface to Education". www.ubergizmo.com. Ubergizmo.
- ↑ "NeuroSky MindWave Sets Guinness World Record for "Largest Object Moved Using a Brain-Computer Interface"". NeuroGadget.com. NeuroGadget.
- ↑ http://www.theneurosync.com/
- ↑ Keiper, Adam. "The Age of Neuroelectronics". The New Atlantis.
- ↑ I. Jestrović, J. L. Coyle, E. Sejdić, "Decoding human swallowing via electroencephalography: a state-of-the-art review," Journal of Neural Engineering, vol. 12, no. 5, pp. 051001-1-051001-15, Oct. 2015.
- ↑ Mind over matter: Brain waves control Asimo 1 Apr 2009, Japan Times
- ↑ This brain test maps the truth 21 Jul 2008, 0348 hrs IST, Nitasha Natu,TNN
- ↑ "Puranik, D.A., Joseph, S.K., Daundkar, B.B., Garad, M.V. (2009). Brain Signature profiling in India. Its status as an aid in investigation and as corroborative evidence – as seen from judgments. Proceedings of XX All India Forensic Science Conference, 815 – 822, November 15 – 17, Jaipur." (PDF).
- ↑ "Casson, A.J., Yates, D.C., Smith, S., Duncan, J.S., Rodriguez-Villegas, E. (2010). Wearable electroencephalography. IEEE Engineering in Medicine and Biology Magazine, 44 – 56, May 2010.".
65. Keiper, A. (2006). The age of neuroelectronics. The New Atlantis, 11, 4-41.
Further reading
- Electroencephalogram Paul L. Nunez, Ramesh Srinivasan Scholarpedia 2(2):1348. doi:10.4249/scholarpedia.1348
External links
| Look up electroencephalography, electroencephalogram, electroencephalograph, or brainwave in Wiktionary, the free dictionary. |
- Tanzer Oguz I., (2006) Numerical Modeling in Electro- and Magnetoencephalography, Ph.D. Thesis, Helsinki University of Technology, Finland.
- A tutorial on simulating and estimating EEG sources in Matlab
- A tutorial on analysis of ongoing, evoked, and induced neuronal activity: Power spectra, wavelet analysis, and coherence