Race and genetics
| Race |
|---|
| Genetics and differences |
| Society |
| Race and... |
| Related topics |
|
The relationship between race and genetics is relevant to the controversy concerning race classification. In everyday life many societies classify populations into groups based on phenotypical traits and impressions of probable geographic ancestry and socio-economic status—these are the groups usually called "races" in countries like the United States. Because the patterns of variation of human genetic traits can be both abrupt and clinal, with a gradual change in trait frequency between population clusters, it is possible to statistically correlate clusters of physical traits with individual geographic ancestry. The frequencies of alleles tend to form clusters where populations live closely together and interact over periods of time. This is due to endogamy within kin groups and lineages or national, cultural or linguistic boundaries. This causes genetic clusters to correlate statistically with population groups when a number of alleles are evaluated.
In a similar way, genetic analysis enables us to determine the geographic ancestry of a person pinpointing the migrational history of a person's ancestors with a high degree of accuracy, and by inference the probable racial category into which they will be classified in a given society. In that way there is a distinct statistical correlation between gene frequencies and racial categories. However, because all populations are genetically diverse, and because there is a complex relation between ancestry, genetic makeup and phenotype, and because racial categories are based on subjective evaluations of the traits, it is not the case that there are any specific genes, that can be used to determine a person's race.
Most physical anthropologists consider race to be primarily a social category that does not correspond significantly with biological variation, but some anthropologists, particularly forensic anthropologists, consider race a useful biological category. They argue that it is possible to determine race from physical remains with a reasonable degree of certainty; what is identified is the geographic phenotype. Medical practitioners also sometimes argue that racial categories can be used successfully as proxies to assess risk of those different heritable illnesses that occur with different frequencies among populations of different geographic ancestries. Others argue that this use may be problematic because it risks underestimating risks of individuals from ethno-racial categories that are not considered high-risk, and to overestimate the risk in populations that are, resulting in stigmatization.
Genetic variation
Genetic variation arises from mutations, from migration between populations (gene flow) and from the reshuffling of genes through sexual reproduction. Variation is counteracted by natural selection and by genetic drift; note too the founder effect, when a small number of initial founders establish a population which hence starts with a correspondingly small degree of genetic variation. Epigenetic inheritance involves heritable changes in phenotype (appearance) or gene expression caused by mechanisms other than changes in the DNA sequence.
Human phenotypes are highly polygenic (dependent on interaction by many genes) and are influenced by environment as well as by genetics.
Nucleotide diversity is based on single mutations, single nucleotide polymorphisms (SNPs). The nucleotide diversity between humans is about 0.1 percent (one difference per one thousand nucleotides between two humans chosen at random). This amounts to approximately three million SNPs (since the human genome has about three billion nucleotides). There are an estimated ten million SNPs in the human population.
Research has shown that non-SNP (structural) variation accounts for more human genetic variation than single nucleotide diversity. Structural variation includes copy-number variation and results from deletions, inversions, insertions and duplications. It is estimated that approximately 0.4 percent of the genomes of unrelated people differ, apart from copy number. When copy-number variation is included, human-to-human genetic variation is estimated to be at least 0.5 percent.
Research methods
Trait, protein and gene studies
Early classification attempts measured surface traits.
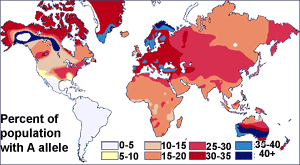
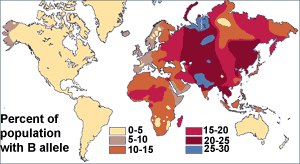
Before the discovery of DNA, scientists used blood proteins (the human blood group systems) to study human genetic variation. Research by Ludwik and Hanka Herschfeld during World War I found that the incidence of blood groups A and B differed by region; for example, among Europeans 15 percent were group B and 40 percent group A. Eastern Europeans and Russians had a higher incidence of group B; people from India had the greatest incidence. The Herschfelds concluded that humans comprised two "biochemical races", originating separately. It was hypothesized that these two races later mixed, resulting in the patterns of groups A and B. This was one of the first theories of racial differences to include the idea that human variation did not correlate with genetic variation. It was expected that groups with similar proportions of blood groups would be more closely related, but instead it was often found that groups separated by great distances (such as those from Madagascar and Russia), had similar incidences.[1] It was later discovered that the ABO blood group system is not just common to humans, but shared with other primates,[2] and likely predates all human groups.[3]
Researchers currently use genetic testing, which may involve hundreds (or thousands) of genetic markers or the entire genome.
Population genetics
Structure
Several methods to examine and quantify genetic subgroups exist, including cluster and principal components analysis. Genetic markers from individuals are examined to find a population's genetic structure. While subgroups overlap when examining variants of one marker only, when a number of markers are examined different subgroups have different average genetic structure. An individual may be described as belonging to several subgroups. These subgroups may be more or less distinct, depending on how much overlap there is with other subgroups.[5]
In cluster analysis, the number of clusters to search for K is determined in advance; how distinct the clusters are varies. The results obtained from cluster analyses depend on several factors:
- A large number genetic markers studied facilitates finding distinct clusters.[6]
- Some genetic markers vary more than others, so fewer are required to find distinct clusters.[7] Ancestry-informative markers exhibits substantially different frequencies between populations from different geographical regions. Using AIMs, scientists can determine a person's ancestral continent of origin based solely on their DNA. AIMs can also be used to determine someone's admixture proportions.[8]
- The more individuals studied, the easier it becomes to detect distinct clusters (statistical noise is reduced).[7]
- Low genetic variation makes it more difficult to find distinct clusters.[7] Greater geographic distance generally increases genetic variation, making identifying clusters easier.[9]
- A similar cluster structure is seen with different genetic markers when the number of genetic markers included is sufficiently large. The clustering structure obtained with different statistical techniques is similar. A similar cluster structure is found in the original sample with a subsample of the original sample.[10]
Distance
Genetic distance is genetic divergence between species or populations of a species. It may compare the genetic similarity of related species, such as humans and chimpanzees. Within a species, genetic distance measures divergence between subgroups.
Genetic distance significantly correlates to geographic distance between populations, a phenomenon sometimes known as "isolation by distance".[11] Genetic distance may be the result of physical boundaries restricting gene flow such as islands, deserts, mountains or forests.
Genetic distance is measured by the fixation index (FST). FST is the correlation of randomly chosen alleles in a subgroup to a larger population. It is often expressed as a proportion of genetic diversity. This comparison of genetic variability within (and between) populations is used in population genetics. The values range from 0 to 1; zero indicates the two populations are freely interbreeding, and one would indicate that two populations are separate.
History and geography
Cavalli-Sforza has described two methods of ancestry analysis.[12] Current-population genetic structure does not imply that differing clusters or components indicate only one ancestral home per group; for example, a genetic cluster in the US comprises Hispanics with European, Native American and African ancestry.[6]
Geographic analyses attempt to identify places of origin, their relative importance and possible causes of genetic variation in an area. The results can be presented as maps showing genetic variation. Cavalli-Sforza and colleagues argue that if genetic variations are investigated, they often correspond to population migrations due to new sources of food, improved transportation or shifts in political power. For example, in Europe the most significant direction of genetic variation corresponds to the spread of agriculture from the Middle East to Europe between 10,000 and 6,000 years ago.[12] Such geographic analysis works best in the absence of recent large-scale, rapid migrations.
Historic analyses use differences in genetic variation (measured by genetic distance) as a molecular clock indicating the evolutionary relation of species or groups, and can be used to create evolutionary trees reconstructing population separations.[12]
Validation
Results of genetic-ancestry research are supported if they agree with research results from other fields, such as linguistics or archeology.[12] Cavalli-Sforza and colleagues have argued that there is a correspondence between language families found in linguistic research and the population tree they found in their 1994 study. There are generally shorter genetic distances between populations using languages from the same language family. Exceptions to this rule are Sami, who are genetically associated with populations speaking languages from other language families. The Sami speak a Uralic language, but are genetically primarily European. This is argued to have resulted from migration (and interbreeding) with Europeans while retaining their original language. Agreement also exists between research dates in archeology and those calculated using genetic distance.[7][12]
Ancestral populations
A 1994 study by Cavalli-Sforza and colleagues evaluated genetic distances among 42 native populations based on 120 blood polymorphisms. The populations were grouped into nine clusters: African (sub-Saharan), Caucasoid (European), Caucasoid (extra-European), northern Mongoloid (excluding Arctic populations), northeast Asian Arctic, southern Mongoloid (mainland and insular Southeast Asia), Pacific islander, New Guinean and Australian, and American (Amerindian). Although the clusters demonstrate varying degrees of homogeneity, the nine-cluster model represents a majority (80 out of 120) of single-trait trees and is useful in demonstrating the historic phylogenetic relationship among these populations.[4]
The greatest genetic distance between two continents is between Africa and Oceania, at 0.2470. Based on physical appearance this is counterintuitive, since indigenous Australians and New Guineans resemble Africans (with dark skin and curly hair). This measure of genetic distance reflects the isolation of Australia and New Guinea since the end of the last glacial maximum, when the continent was isolated from mainland Asia due to rising sea levels. The next-largest genetic distance is between Africa and the Americas, at 0.2260. This is expected, since the longest geographic distance by land is between Africa and South America. The shortest genetic distance, 0.0155, is between European and extra-European Caucasoids. Africa is the most genetically divergent continent, with all other groups more related to each other than to sub-Saharan Africans. This is expected, according to the single-origin hypothesis. Europe has a general genetic variation about three times less than that of other continents; the genetic contribution of Asia and Africa to Europe is thought to be two-thirds and one-third, respectively.[4][12]
Recent studies have been published using an increasing number of genetic markers.[7][10][13][14][15][16]
Population structures
Race has overlapped with a debate about species known as the species problem.
Since the 1960s scientists have understood race as a social construct imposed on phenotypes in culturally determined ways, rather than a biological concept. A 2000 study by Celera Genomics found that human DNA does not differ significantly across populations. Citizens of any village in the world, in Scotland or Tanzania, have 90 percent of the genetic variability humanity has to offer. Only .01 percent of genes account for a person's appearance.[17] Biological adaptation plays a role in bodily features and skin type. According to Luigi Luca Cavalli-Sforza, "From a scientific point of view, the concept of race has failed to obtain any consensus; none is likely, given the gradual variation in existence. It may be objected that the racial stereotypes have a consistency that allows even the layman to classify individuals. However, the major stereotypes, all based on skin color, hair color and form, and facial traits, reflect superficial differences that are not confirmed by deeper analysis with more reliable genetic traits and whose origin dates from recent evolution mostly under the effect of climate and perhaps sexual selection".[4][18][19][20][21][22]
Group size
Research techniques can be used to detect genetic population differences if enough genetic markers are used; the Japanese and Chinese East Asian populations have been identified.[23] Sub-Saharan Africans have greater genetic diversity than other populations.[24]
Between-group genetics
In 1972, Richard Lewontin performed a FST statistical analysis using 17 markers (including blood-group proteins). He found that the majority of genetic differences between humans (85.4 percent) were found within a population, 8.3 percent were found between populations within a race and 6.3 percent were found to differentiate races (Caucasian, African, Mongoloid, South Asian Aborigines, Amerinds, Oceanians, and Australian Aborigines in his study). Since then, other analyses have found FST values of 6–10 percent between continental human groups, 5–15 percent between different populations on the same continent and 75–85 percent within populations.[25][26][27][28][29] This view has been affirmed by the American Anthropological Association and the American Association of Physical Anthropologists since.[30]
While acknowledging Lewontin's observation that humans are genetically homogeneous, A. W. F. Edwards in his 2003 paper "Human Genetic Diversity: Lewontin's Fallacy" argued that information distinguishing populations from each other is hidden in the correlation structure of allele frequencies, making it possible to classify individuals using mathematical techniques. Edwards argued that even if the probability of misclassifying an individual based on a single genetic marker is as high as 30 percent (as Lewontin reported in 1972), the misclassification probability nears zero if enough genetic markers are studied simultaneously. Edwards saw Lewontin's argument as based on a political stance, denying biological differences to argue for social equality.[31]
In The Ancestor's Tale Richard Dawkins devotes a chapter to the subject of race and genetics. After an extensive discussion of race and how the term is not well defined, Dawkins turns to the genetics of race. Dawkins describes the relatively low genetic variation between races, and geneticists conclusion that race is not an important aspect of a person. These conclusions echo those of Lewontin, and Dawkins characterizes this view as scientific orthodoxy. However, Dawkins felt that reasonable genetic conclusions had been tainted by Lewontin's politics. Dawkins accepted Lewontin's position that our perception of relatively large differences between human races and subgroups, as compared to the variation within these groups, is a biased perception and that human races and populations are remarkably similar to each other, with the largest part by far of human variation being accounted for by the differences between individuals. Dawkins' also agreed with Lewontin that racial classification had no social value, and was in fact destructive. Together with Edwards, Dawkins disagreed with Lewontin that this means race is of "virtually no genetic or taxonomic significance" and summarized Edwards' point that however small the racial partition of the total variation may be, if such racial characteristics as there are highly correlated with other racial characteristics, they are by definition informative, and therefore of taxonomic significance. Dawkins went on to concludes that racial classification informs us about no more than the traits common used to classify race: the superficial, external traits like eye shape and skin color.[32]
While acknowledging that FST remains useful, a number of scientists have written about other approaches to characterizing human genetic variation.[33][34][35] Long & Kittles (2009) stated that FST failed to identify important variation and that when the analysis includes only humans, FST = 0.119, but adding chimpanzees increases it only to FST = 0.183.[33] Mountain & Risch (2004) argued that an FST estimate of 0.10-0.15 does not rule out a genetic basis for phenotypic differences between groups and that a low FST estimate implies little about the degree to which genes contribute to between-group differences.[34] Pearse & Crandall 2004 wrote that FST figures cannot distinguish between a situation of high migration between populations with a long divergence time, and one of a relatively recent shared history but no ongoing gene flow.[35] In their 2015 article, Keith Hunley, Graciela Cabana, and Jeffrey Long (who had previously criticized Lewontin's statistical methodology with Rick Kittles[30]) recalculate the apportionment of human diversity using a more complex model than Lewontin and his successors. They conclude: "In sum, we concur with Lewontin’s conclusion that Western-based racial classifications have no taxonomic significance, and we hope that this research, which takes into account our current understanding of the structure of human diversity, places his seminal finding on firmer evolutionary footing."[36]
Anthropologists (such as C. Loring Brace),[37] philosopher Jonathan Kaplan and geneticist Joseph Graves[38] have argued that while it is possible to find biological and genetic variation roughly corresponding to race, this is true for almost all geographically distinct populations: the cluster structure of genetic data is dependent on the initial hypotheses of the researcher and the populations sampled. When one samples continental groups, the clusters become continental; with other sampling patterns, the clusters would be different. Weiss and Fullerton note that if one sampled only Icelanders, Mayans and Maoris, three distinct clusters would form; all other populations would be composed of genetic admixtures of Maori, Icelandic and Mayan material.[39] Kaplan therefore concludes that, while differences in particular allele frequencies can be used to identify populations that loosely correspond to the racial categories common in Western social discourse, the differences are of no more biological significance than the differences found between any human populations (e.g., the Spanish and Portuguese).[40]
Self-identification
Jorde and Wooding (2004) wrote that clusters from genetic markers did not correspond to subjects' self-identified race or ethnic group. However, the studies cited were based on relatively few genetic markers and deemed insufficient. In contrast, studies based on a higher number of genetic markers have found more agreement.[23]
A 2005 study by Tang and colleagues used 326 genetic markers to determine genetic clusters. The 3,636 subjects, from the United States and Taiwan, self-identified as belonging to white, African American, East Asian or Hispanic ethnic groups. The study found "nearly perfect correspondence between genetic cluster and SIRE for major ethnic groups living in the United States, with a discrepancy rate of only 0.14 percent".[6]
Paschou et al. (2010) found "essentially perfect" agreement between 51 self-identified populations and the population's genetic structure, using 650,000 genetic markers. Selecting for informative genetic markers allowed a reduction to less than 650, while retaining near-total accuracy.[41]
Correspondence between genetic clusters in a population (such as the current US population) and self-identified race or ethnic groups does not mean that such a cluster (or group) corresponds to only one ethnic group. African Americans have an estimated 10–20-percent European genetic admixture; Hispanics have European, Native American and African ancestry.[6] In Brazil there has been extensive admixture between Europeans, Amerindians and Africans. As a result, skin color differences within the population are not gradual, and there's relatively weak associations between self-reported race and African ancestry.[42][43] Ethnoracial self- classification in Brazilians is certainly not random with respect to genome individual ancestry, but the strength of the association between the phenotype and median proportion of African ancestry varies largely across population.[44]
Genetic-distance increase

Genetic distances generally increase continually with geographic distance, which makes a dividing line arbitrary. Any two neighboring settlements will exhibit some genetic difference from each other, which could be defined as a race. Therefore, attempts to classify races impose an artificial discontinuity on a naturally occurring phenomenon. This explains why studies on population genetic structure yield varying results, depending on methodology.[45]
Rosenberg and colleagues (2005) have argued, based on cluster analysis, that populations do not always vary continuously and a population's genetic structure is consistent if enough genetic markers (and subjects) are included. "Examination of the relationship between genetic and geographic distance supports a view in which the clusters arise not as an artifact of the sampling scheme, but from small discontinuous jumps in genetic distance for most population pairs on opposite sides of geographic barriers, in comparison with genetic distance for pairs on the same side. Thus, analysis of the 993-locus dataset corroborates our earlier results: if enough markers are used with a sufficiently large worldwide sample, individuals can be partitioned into genetic clusters that match major geographic subdivisions of the globe, with some individuals from intermediate geographic locations having mixed membership in the clusters that correspond to neighboring regions." They also wrote, regarding a model with five clusters corresponding to Africa, Eurasia (Europe, Middle East, and Central/South Asia), East Asia, Oceania, and the Americas: "For population pairs from the same cluster, as geographic distance increases, genetic distance increases in a linear manner, consistent with a clinal population structure. However, for pairs from different clusters, genetic distance is generally larger than that between intracluster pairs that have the same geographic distance. For example, genetic distances for population pairs with one population in Eurasia and the other in East Asia are greater than those for pairs at equivalent geographic distance within Eurasia or within East Asia. Loosely speaking, it is these small discontinuous jumps in genetic distance—across oceans, the Himalayas, and the Sahara—that provide the basis for the ability of STRUCTURE to identify clusters that correspond to geographic regions".[10] This applies to populations in their ancestral homes when migrations and gene flow were slow; large, rapid migrations exhibit different characteristics. Tang and colleagues (2004) wrote, "we detected only modest genetic differentiation between different current geographic locales within each race/ethnicity group. Thus, ancient geographic ancestry, which is highly correlated with self-identified race/ethnicity—as opposed to current residence—is the major determinant of genetic structure in the U.S. population".[6]
Number of clusters
Cluster analysis has been criticized because the number of clusters to search for is decided in advance, with different values possible (although with varying degrees of probability).[46] Principal component analysis does not decide in advance how many components for which to search,[47] and it has been used in an increasing number of studies.
Utility
It has been argued that knowledge of a person's race is limited in value, since people of the same race vary from one another.[23] Witherspoon and colleagues (2007) have argued that when individuals are assigned to population groups, two randomly chosen individuals from different populations can resemble each other more than a randomly chosen member of their own group. They found that many thousands of genetic markers had to be used for the answer to "How often is a pair of individuals from one population genetically more dissimilar than two individuals chosen from two different populations?" to be "never". This assumed three population groups, separated by large geographic distances (European, African and East Asian). The global human population is more complex, and studying a large number of groups would require an increased number of markers for the same answer. They conclude that "caution should be used when using geographic or genetic ancestry to make inferences about individual phenotypes",[48] and "The fact that, given enough genetic data, individuals can be correctly assigned to their populations of origin is compatible with the observation that most human genetic variation is found within populations, not between them. It is also compatible with our finding that, even when the most distinct populations are considered and hundreds of loci are used, individuals are frequently more similar to members of other populations than to members of their own population".[49]
This is similar to the conclusion reached by anthropologist Norman Sauer in a 1992 article on the ability of forensic anthropologists to assign "race" to a skeleton, based on craniofacial features and limb morphology. Sauer said, "the successful assignment of race to a skeletal specimen is not a vindication of the race concept, but rather a prediction that an individual, while alive was assigned to a particular socially constructed 'racial' category. A specimen may display features that point to African ancestry. In this country that person is likely to have been labeled Black regardless of whether or not such a race actually exists in nature".[50]
Race and medicine
There are certain statistical differences between racial groups in susceptibility to certain diseases.[51] Genes change in response to local diseases; for example, people who are Duffy-negative tend to have a higher resistance to malaria. The Duffy negative phenotype is highly frequent in central Africa and the frequency decreases with distance away from Central Africa, with higher frequencies in global populations with high degrees of recent African immigration. This suggests that the Duffy negative genotype evolved in Sub-Saharan Africa and was subsequently positively selected for in the Malaria endemic zone.[52] A number of genetic conditions prevalent in malaria-endemic areas may provide genetic resistance to malaria, including sickle cell disease, thalassaemias and glucose-6-phosphate dehydrogenase. Cystic fibrosis is the most common life-limiting autosomal recessive disease among people of European ancestry; a hypothesized heterozygote advantage, providing resistance to diseases earlier common in Europe, has been challenged.[53]
Information about a person's population of origin may aid in diagnosis, and adverse drug responses may vary by group.[7] Because of the correlation between self-identified race and genetic clusters, medical treatments influenced by genetics have varying rates of success between self-defined racial groups.[54] For this reason, some physicians consider a patient's race in choosing the most effective treatment,[55] and some drugs are marketed with race-specific instructions.[56] Jorde and Wooding (2004) have argued that because of genetic variation within racial groups, when "it finally becomes feasible and available, individual genetic assessment of relevant genes will probably prove more useful than race in medical decision making". However, race continues to be a factor when examining groups (such as epidemiologic research).[23] Some doctors and scientists such as geneticist Neil Risch argue that using self-identified race as a proxy for ancestry is necessary to be able to get a sufficiently broad sample of different ancestral populations, and in turn to be able to provide health care that is tailored to the needs of minority groups.[57]
Usage in scientific journals
Some scientific journals have addressed previous methodological errors by requiring more rigorous scrutiny of population variables. Since 2000, Nature Genetics requires its authors to “explain why they make use of particular ethnic groups or populations, and how classification was achieved.” Editors of Nature Genetics say that “[they] hope that this will raise awareness and inspire more rigorous design of genetic and epidemiological studies.”[58]
See also
- Y-chromosome haplogroups by populations
- Human genetic clustering
- History of anthropometry, section; 4.2 Race, identity and cranio-facial description
References
- ↑ Sykes, Bryan (2001). "From Blood Groups to Genes". The seven daughters of Eve. New York: Norton. pp. 32–51. ISBN 0-393-02018-5.
- ↑ Blancher, Antoine; Klein, Jan; Socha, Wladyslaw W. (2012). Molecular biology and evolution of blood group and MHC antigens in primates. Springer Science & Business Media. ISBN 3-642-59086-1.
- ↑ Ségurel, Laure; Thompson, Emma E.; Flutre, Timothée; Lovstad, Jessica; Venkat, Aarti; Margulis, Susan W.; Moyse, Jill; Ross, Steve; Gamble, Kathryn; Sella, Guy; Ober, Carole; Przeworski, Molly (2012-11-06). "The ABO blood group is a trans-species polymorphism in primates". Proceedings of the National Academy of Sciences. 109 (45): 18493–18498. doi:10.1073/pnas.1210603109. ISSN 0027-8424. PMC 3494955
 . PMID 23091028. Retrieved 2016-07-05.
 - 1 2 3 4 Cavalli-Sforza, Luigi Luca; Menozzi, Paolo; Piazza, Alberto (1994). The History and Geography of Human Genes. Princeton: Princeton University Press. ISBN 978-0-691-08750-4. Lay summary (1 December 2013).
- ↑ Witherspoon, D. J.; Wooding, S.; Rogers, A. R.; Marchani, E. E.; Watkins, W. S.; Batzer, M. A.; Jorde, L. B. (2007). "Genetic Similarities Within and Between Human Populations". Genetics. 176 (1): 351–359. doi:10.1534/genetics.106.067355. ISSN 0016-6731. PMC 1893020. PMID 17339205.
- 1 2 3 4 5 Tang H, Quertermous T, Rodriguez B, et al. (February 2005). "Genetic Structure, Self-Identified Race/Ethnicity, and Confounding in Case-Control Association Studies". American Journal of Human Genetics. 76 (2): 268–75. doi:10.1086/427888. PMC 1196372. PMID 15625622.
- 1 2 3 4 5 6 Rosenberg NA, Pritchard JK, Weber JL; et al. (December 2002). "Genetic structure of human populations". Science. 298 (5602): 2381–5. Bibcode:2002Sci...298.2381R. doi:10.1126/science.1078311. PMID 12493913.
- ↑ Lewontin, R.C. "Confusions About Human Races".
- ↑ Kittles RA, Weiss KM (2003). "Race, ancestry, and genes: implications for defining disease risk". Annual Review of Genomics and Human Genetics. 4: 33–67. doi:10.1146/annurev.genom.4.070802.110356. PMID 14527296.
- 1 2 3 Rosenberg NA, Mahajan S, Ramachandran S, Zhao C, Pritchard JK, Feldman MW (December 2005). "Clines, Clusters, and the Effect of Study Design on the Inference of Human Population Structure". PLoS Genetics. 1 (6): e70. doi:10.1371/journal.pgen.0010070. PMC 1310579. PMID 16355252.
- ↑ Ramachandran, S; Deshpande, O; Roseman, CC; Rosenberg, NA; Feldman, MW; Cavalli-Sforza, LL (November 2005). "Support from the relationship of genetic and geographic distance in human populations for a serial founder effect originating in Africa". Proc. Natl. Acad. Sci. U.S.A. 102: 15942–7. doi:10.1073/pnas.0507611102. PMC 1276087. PMID 16243969.
- 1 2 3 4 5 6 Genes, peoples, and languages, Luigi Luca Cavalli-Sforza, Proceedings of the National Academy of Sciences, 1997, vol.94, pp.7719–7724, doi=10.1073/pnas.94.15.7719 http://www.pnas.org/cgi/content/full/94/15/7719
- ↑ Li, J. Z.; Absher, D. M.; Tang, H.; Southwick, A. M.; Casto, A. M.; Ramachandran, S.; Cann, H. M.; Barsh, G. S.; Feldman, M.; Cavalli-Sforza, L. L.; Myers, R. M. (2008). "Worldwide Human Relationships Inferred from Genome-Wide Patterns of Variation". Science. 319 (5866): 1100–1104. Bibcode:2008Sci...319.1100L. doi:10.1126/science.1153717. PMID 18292342.
- ↑ Jakobsson, M.; Scholz, S. W.; Scheet, P.; Gibbs, J. R.; Vanliere, J. M.; Fung, H. C.; Szpiech, Z. A.; Degnan, J. H.; Wang, K.; Guerreiro, R.; Bras, J. M.; Schymick, J. C.; Hernandez, D. G.; Traynor, B. J.; Simon-Sanchez, J.; Matarin, M.; Britton, A.; Van De Leemput, J.; Rafferty, I.; Bucan, M.; Cann, H. M.; Hardy, J. A.; Rosenberg, N. A.; Singleton, A. B. (2008). "Genotype, haplotype and copy-number variation in worldwide human populations". Nature. 451 (7181): 998–1003. Bibcode:2008Natur.451..998J. doi:10.1038/nature06742. PMID 18288195.
- ↑ Xing, J.; Watkins, W. S.; Witherspoon, D. J.; Zhang, Y.; Guthery, S. L.; Thara, R.; Mowry, B. J.; Bulayeva, K.; Weiss, R. B.; Jorde, L. B. (2009). "Fine-scaled human genetic structure revealed by SNP microarrays". Genome Research. 19 (5): 815–825. doi:10.1101/gr.085589.108. PMC 2675970. PMID 19411602.
- ↑ López Herráez, D.; Bauchet, M.; Tang, K.; Theunert, C.; Pugach, I.; Li, J.; Nandineni, M. R.; Gross, A.; Scholz, M.; Stoneking, M. (2009). Hawks, John, ed. "Genetic Variation and Recent Positive Selection in Worldwide Human Populations: Evidence from Nearly 1 Million SNPs". PLoS ONE. 4 (11): e7888. Bibcode:2009PLoSO...4.7888L. doi:10.1371/journal.pone.0007888. PMC 2775638. PMID 19924308.
- ↑ "Do Races Differ? Not Really, DNA Shows". The New York Times. 22 August 2000.
- ↑ McDonald, J; Lehman, DC (Spring 2012). "Forensic DNA analysis.". Clinical Laboratory Science. 25 (2): 109–13. PMID 22693781.
- ↑ Butler, John. "Genetics and Genomics of Core STR Loci Used in Human Identity Testing*" (PDF).
- ↑ Redd, AJ; Chamberlain, VF; Kearney, VF; Stover, D; Karafet, T; Calderon, K; Walsh, B; Hammer, MF (May 2006). "Genetic structure among 38 populations from the United States based on 11 U.S. core Y chromosome STRs.". Journal of forensic sciences. 51 (3): 580–5. doi:10.1111/j.1556-4029.2006.00113.x. PMID 16696705.
- ↑ Hammer, MF; Chamberlain, VF; Kearney, VF; Stover, D; Zhang, G; Karafet, T; Walsh, B; Redd, AJ (Dec 1, 2006). "Population structure of Y chromosome SNP haplogroups in the United States and forensic implications for constructing Y chromosome STR databases.". Forensic Science International. 164 (1): 45–55. doi:10.1016/j.forsciint.2005.11.013. PMID 16337103.
- ↑ Sims, LM; Ballantyne, J (March 2008). "The golden gene (SLC24A5) differentiates US sub-populations within the ethnically admixed Y-SNP haplogroups." (PDF). Legal medicine (Tokyo, Japan). 10 (2): 72–7. doi:10.1016/j.legalmed.2007.06.004. PMID 17720606.
- 1 2 3 4 Jordge, Lynn B.; Wooding, Stephen P. (2004). "Genetic Variation, classification and 'race'". Nature Genetics. 36: 28. doi:10.1038/ng1435. PMID 15508000.
- ↑ Long, Jeffrey C.; Li, Jie; Healy, Meghan E. (2009). "Human DNA sequences: More variation and less race". American Journal of Physical Anthropology. 139 (1): 23–34. doi:10.1002/ajpa.21011. PMID 19226648.
- ↑ Lewontin, Richard (1972). "The Apportionment of Human Diversity". Evolutionary Biology. Springer. 6: 381–398. doi:10.1007/978-1-4684-9063-3_14. Archived (PDF) from the original on 25 November 2010. Retrieved 23 November 2013.
- ↑ Risch, Neil; Burchard, Esteban; Ziv, Elad; Tang, Hua (2002). "Categorization of humans in biomedical research: genes, race and disease". Genome Biology. 3 (7): comment2007.1. doi:10.1186/gb-2002-3-7-comment2007. ISSN 1465-6906. PMC 139378. PMID 12184798.
- ↑ Templeton, Alan R. (2003). "Human Races in the Context of Recent Human Evolution: A Molecular Genetic Perspective". In Goodman, Alan H.; Heath, Deborah; Lindee, M. Susan. Genetic nature/culture: anthropology and science beyond the two-culture divide. Berkeley: University of California Press. pp. 234–257. ISBN 0-520-23792-7. Retrieved 232 September 2014. Check date values in:
|access-date=(help) - ↑ Ossorio P, Duster T (January 2005). "Race and genetics: controversies in biomedical, behavioral, and forensic sciences". The American Psychologist. 60 (1): 115–28. doi:10.1037/0003-066X.60.1.115. PMID 15641926.
- ↑ Lewontin, R. C. (2005). Confusions About Human Races from Race and Genomics, Social Sciences Research Council. Retrieved 28 December 2006.
- 1 2 Long, Jeffrey C.; Kittles, Rick A. (2009). "Human Genetic Diversity and the Nonexistence of Biological Races". Human Biology. 81 (5): 777–798. doi:10.3378/027.081.0621. ISSN 1534-6617. PMID 20504196. Retrieved 2016-01-13.
- ↑ Edwards AW (August 2003). "Human genetic diversity: Lewontin's fallacy". BioEssays. 25 (8): 798–801. doi:10.1002/bies.10315. PMID 12879450.
- ↑ Dawkins, Richard; Wong, Yan (2005). The Ancestor's Tale: A Pilgrimage to the Dawn of Evolution. Houghton Mifflin Harcourt. pp. 406–407. ISBN 978-0-618-61916-0. Retrieved July 13, 2011.
- 1 2 Long, J.C. & Kittles, R.A. (2009). "Human genetic diversity and the nonexistence of biological races". Human Biology. 81 (5/6): 777–798. doi:10.3378/027.081.0621. PMID 20504196.
- 1 2 Mountain, J.L. & Risch, N (2004). "Assessing genetic contributions to phenotypic differences among 'racial' and 'ethnic' groups". Nature Genetics. 36 (11 Suppl): S48 – S53. doi:10.1038/ng1456. PMID 15508003.
- 1 2 Pearse, D. E., & Crandall, K. A. "Beyond FST: analysis of population genetic data for conservation". Conservation Genetics. 5 (5): 585–602. doi:10.1007/s10592-003-1863-4.
- ↑ Hunley, Keith L.; Cabana, Graciela S.; Long, Jeffrey C. (2015-12-01). "The apportionment of human diversity revisited". American Journal of Physical Anthropology. 160: –. doi:10.1002/ajpa.22899. ISSN 1096-8644. Retrieved 2016-01-23.
- ↑ Brace, C. Loring (2005). "Race" is a Four-letter Word: The Genesis of the Concept. Oxford: Oxford University Press. ISBN 978-0-19-517351-2. Lay summary (27 November 2010).
- ↑ Graves, Joseph L (2001). The Emperor's New Clothes: Biological Theories of Race at the Millennium. Rutgers University Press.
- ↑ Weiss, Kenneth M.; Fullerton, Stephanie M. (2005). "Racing around, getting nowhere". Evolutionary Anthropology: Issues, News, and Reviews. 14 (5): 165–169. doi:10.1002/evan.20079. ISSN 1060-1538.
- ↑ Kaplan, Jonathan Michael (17 January 2011). "'Race': What Biology Can Tell Us about a Social Construct". Encyclopedia of Life Sciences (ELS). doi:10.1002/9780470015902.a0005857. Retrieved 23 September 2014.
- ↑ Paschou, Peristera; Lewis, Jamey; Javed, Asif; Drineas, Petros. "Ancestry informative markers for fine-scale individual assignment to worldwide populations". J Med Genet. 47: 835–847. doi:10.1136/jmg.2010.078212.
- ↑ Pena, Sérgio D. J.; Di Pietro, Giuliano; Fuchshuber-Moraes, Mateus; Genro, Julia Pasqualini; Hutz, Mara H.; Kehdy, Fernanda de Souza Gomes; Kohlrausch, Fabiana; Magno, Luiz Alexandre Viana; Montenegro, Raquel Carvalho; Moraes, Manoel Odorico; de Moraes, Maria Elisabete Amaral; de Moraes, Milene Raiol; Ojopi, Élida B.; Perini, Jamila A.; Racciopi, Clarice; Ribeiro-dos-Santos, Ândrea Kely Campos; Rios-Santos, Fabrício; Romano-Silva, Marco A.; Sortica, Vinicius A.; Suarez-Kurtz, Guilherme (2011). Harpending, Henry, ed. "The Genomic Ancestry of Individuals from Different Geographical Regions of Brazil is More Uniform Than Expected". PLoS ONE. 6 (2): e17063. Bibcode:2011PLoSO...6E7063P. doi:10.1371/journal.pone.0017063. PMC 3040205. PMID 21359226.
- ↑ Parra, F. C. (2002). "Color and genomic ancestry in Brazilians". Proceedings of the National Academy of Sciences. 100 (1): 177–82. Bibcode:2002PNAS..100..177P. doi:10.1073/pnas.0126614100. PMC 140919. PMID 12509516.
- ↑ http://www.nature.com/articles/srep09812
- ↑ Back with a Vengeance: the Reemergence of a Biological Conceptualization of Race in Research on Race/Ethnic Disparities in Health Reanne Frank
- ↑ Bolnick, Deborah A. (2008). "Individual Ancestry Inference and the Reification of Race as a Biological Phenomenon". In Koenig, Barbara A.; Richardson, Sarah S.; Lee, Sandra Soo-Jin. Revisiting race in a genomic age. Rutgers University Press. ISBN 978-0-8135-4324-6.
- ↑ Patterson, Nick; Price, Alkes L.; Reich, David (2006). "Population Structure and Eigenanalysis". PLoS Genetics. 2 (12): e190. doi:10.1371/journal.pgen.0020190. PMC 1713260. PMID 17194218.
- ↑ Witherspoon DJ, Wooding S, Rogers AR, et al. (May 2007). "Genetic Similarities Within and Between Human Populations". Genetics. 176 (1): 351–9. doi:10.1534/genetics.106.067355. PMC 1893020. PMID 17339205.
- ↑ Witherspoon DJ, Wooding S, Rogers AR, et al. (May 2007). "Genetic Similarities Within and Between Human Populations". Genetics. 176 (1): 358. doi:10.1534/genetics.106.067355. PMC 1893020. PMID 17339205.
- ↑ Sauer, NJ (January 1992). "Forensic anthropology and the concept of race: if races don't exist, why are forensic anthropologists so good at identifying them?". Social science & medicine (1982). 34 (2): 107–11. doi:10.1016/0277-9536(92)90086-6. PMID 1738862.
- ↑ Risch N (July 2005). "The whole side of it--an interview with Neil Risch by Jane Gitschier". PLoS Genetics. 1 (1): e14. doi:10.1371/journal.pgen.0010014. PMID 17411332.
- ↑ Malaria and the Red Cell, Harvard University. 2002.
- ↑ Högenauer C, Santa Ana CA, Porter JL, et al. (December 2000). "Active intestinal chloride secretion in human carriers of cystic fibrosis mutations: an evaluation of the hypothesis that heterozygotes have subnormal active intestinal chloride secretion". Am. J. Hum. Genet. 67 (6): 1422–7. doi:10.1086/316911. PMC 1287919. PMID 11055897.
- ↑ "Racial Differences in the Response to Drugs — Pointers to Genetic Differences". New England Journal of Medicine. 344 (18): 1393–1396. 2001. doi:10.1056/NEJM200105033441810.
- ↑ Bloche, Gregg M (2004). "Race-Based Therapeutics". New England Journal of Medicine. 351 (20): 2035–2037. doi:10.1056/nejmp048271.
- ↑ Drug information for the drug Crestor. Warnings for this drug state, "People of Asian descent may absorb rosuvastatin at a higher rate than other people. Make sure your doctor knows if you are Asian. You may need a lower than normal starting dose."
- ↑ Risch, N.; Burchard, E.; Ziv, E.; Tang, H. (2002). "Categorization of humans in biomedical research: genes, race and disease". Genome Biol. 3 (7): 1–12. doi:10.1186/gb-2002-3-7-comment2007. PMC 139378. PMID 12184798.
- ↑ "Census, Race and Science". Nature Genetics. 24 (2): 97–98. 2000. doi:10.1038/72884.
Further reading
- Helms JE, Jernigan M, Mascher J (January 2005). "The meaning of race in psychology and how to change it: a methodological perspective". The American Psychologist. 60 (1): 27–36. doi:10.1037/0003-066X.60.1.27. PMID 15641919.
- Keita SO, Kittles RA, Royal CD, et al. (November 2004). "Conceptualizing human variation". Nature Genetics. 36 (11 Suppl): S17–20. doi:10.1038/ng1455. PMID 15507998.
- Koenig, Barbara A.; Lee, Sandra Soo-jin; Richardson, Sarah S., eds. (2008). Revisiting Race in a Genomic Age. New Brunswick (NJ): Rutgers University Press. ISBN 978-0-8135-4324-6. Lay summary (24 November 2010). This review of current research includes chapters by Jonathan Marks, John Dupré, Sally Haslanger, Deborah A. Bolnick, Marcus W. Feldman, Richard C. Lewontin, Sarah K. Tate, David B. Goldstein, Jonathan Kahn, Duana Fullwiley, Molly J. Dingel, Barbara A. Koenig, Mark D. Shriver, Rick A. Kittles, Henry T. Greely, Kimberly Tallbear, Alondra Nelson, Pamela Sankar, Sally Lehrman, Jenny Reardon, Jacqueline Stevens, and Sandra Soo-Jin Lee.
- Lieberman, Leonard; Kirk, Rodney C.; Corcoran, Michael (2003). "The Decline of Race in American Physical Anthropology" (PDF). Przegląd Antropologiczny – Anthropological Review. 66: 3–21. ISSN 0033-2003.
- Long JC, Kittles RA (August 2003). "Human genetic diversity and the nonexistence of biological races". Human Biology. 75 (4): 449–71. doi:10.1353/hub.2003.0058. PMID 14655871.
- Miththapala, Sriyanie; Seidensticker, John; O'Brien, Stephen J. (1996). "Phylogeographic Subspecies Recognition in Leopards (Panthera pardus): Molecular Genetic Variation". Conservation Biology. 10 (4): 1115–1132. doi:10.1046/j.1523-1739.1996.10041115.x.
- Ossorio P, Duster T (January 2005). "Race and genetics: controversies in biomedical, behavioral, and forensic sciences". The American Psychologist. 60 (1): 115–28. doi:10.1037/0003-066X.60.1.115. PMID 15641926.
- Parra EJ, Kittles RA, Shriver MD (November 2004). "Implications of correlations between skin color and genetic ancestry for biomedical research". Nature Genetics. 36 (11 Suppl): S54–60. doi:10.1038/ng1440. PMID 15508005.
- Sawyer SL, Mukherjee N, Pakstis AJ, et al. (May 2005). "Linkage disequilibrium patterns vary substantially among populations". European Journal of Human Genetics. 13 (5): 677–86. doi:10.1038/sj.ejhg.5201368. PMID 15657612.
- Rohde DL, Olson S, Chang JT (September 2004). "Modelling the recent common ancestry of all living humans". Nature. 431 (7008): 562–6. Bibcode:2004Natur.431..562R. doi:10.1038/nature02842. PMID 15457259.
- Serre D, Pääbo S (September 2004). "Evidence for Gradients of Human Genetic Diversity Within and Among Continents". Genome Research. 14 (9): 1679–85. doi:10.1101/gr.2529604. PMC 515312. PMID 15342553.
- Smedley A, Smedley BD (January 2005). "Race as biology is fiction, racism as a social problem is real: Anthropological and historical perspectives on the social construction of race". The American Psychologist. 60 (1): 16–26. doi:10.1037/0003-066X.60.1.16. PMID 15641918.