Upper Darby School District
| Upper Darby School District | |
|---|---|
|
Official Logo of the Upper Darby School District | |
| Address | |
|
4611 Bond Ave Drexel Hill, Pennsylvania, Delaware County 19026-4592 United States | |
| Information | |
| Type | Public |
| Superintendent | Mr Daniel Nerelli (Acting Superintendent) |
| School number | (610) 789-7200 |
| Assistant Superintendent for Curriculum and Instruction | Daniel P. McGarry |
| Faculty | 839.25 teachers (2010) |
| Grades | K-12 |
| Age | 5 years to 21 years old for Special education |
| Pupils | 12,057 (2010–11)[1] |
| • Kindergarten | 896 |
| • Grade 1 | 960 |
| • Grade 2 | 964 |
| • Grade 3 | 939 |
| • Grade 4 | 907 |
| • Grade 5 | 931 |
| • Grade 6 | 929 |
| • Grade 7 | 967 |
| • Grade 8 | 953 |
| • Grade 9 | 964 |
| • Grade 10 | 919 |
| • Grade 11 | 936 |
| • Grade 12 | 844 |
| • Other | Enrollment projected to be 14, 081 in 2019[2] |
| Budget | $160 million (2012),[3] $156.2 million (2011) |
| Tuition | for nonresident and charter school students ES - $9,101.79, HS - $9,596.12[4] |
| Per pupil spending | $13,524 (2008) |
| Per Pupil Spending | $12,501.23 (2010) |
| Website | http://www.upperdarbysd.org/ |
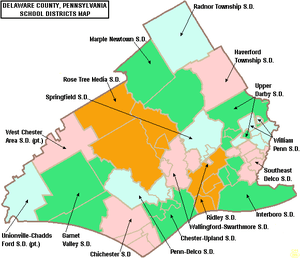
Upper Darby School District (UDSD) is a large public school district of approximately 12,000 students in Upper Darby Township, Delaware County, Pennsylvania. It consists of an 8.3-square-mile (21 km2) area including Upper Darby Township, Clifton Heights borough, and Millbourne borough. According to 2009 local census data, it serves a resident population of 90,000. In 2009, the district residents’ per capita income was $20,699, while the median family income was $51,965.[5] In the Commonwealth, the median family income was $49,501[6] and the United States median family income was $49,445, in 2010.[7] According to District officials, in school year 2007–08, Upper Darby School District provided basic educational services to 11,700 pupils.
Upper Darby schools serve an increasingly diverse population: 41% of students are White, 42% are African American, 13% are Asian/Pacific Islander, 3% are Hispanic and 1% are other. In 2010, there are 877 Limited English Proficient (LEP) students speaking over 70 languages, including Punjabi, Vietnamese, Chinese, Korean, Albanian, Greek, and Urdu. Over 350 students also meet the state criteria for immigrant status. In addition, the district annually educates more than 380 students who have refugee status and/or limited formal schooling. In the past seven years, the percentage of students who meet the low-income status set by the Federal Free/Reduced Lunch Program has risen from 23% to almost 50%.[8]
In 2010, the District employed: 960 teachers, 237 full-time and part-time support personnel, and 46 administrators. Upper Darby School District received more than $45.4 million in state funding in school year 2007–08.
Schools
Upper Darby School District operates one high school, two middle schools, ten elementary schools and a kindergarten center.
- Middle schools
- Beverly Hills Middle School
- Drexel Hill Middle School
- Elementary schools
- Aronimink Elementary
- Bywood Elementary
- Charles Kelly Elementary
- Garrettford Elementary
- Highland Park Elementary
- Hillcrest Elementary
- Primos Elementary
- Stonehurst Hills Elementary
- Upper Darby Kindergarten Center
- Walter M. Senkow Elementary
- Westbrook Park Elementary
Governance
The school district is governed by 9 individually elected board members (serve four-year terms), the Pennsylvania State Board of Education, the Pennsylvania Department of Education and the Pennsylvania General Assembly.[9] The federal government controls programs it funds like Title I funding for low-income children in the Elementary and Secondary Education Act and the No Child Left Behind Act, which mandates the district focus resources on student success in acquiring on grade level reading and math skills.
Academic achievement
In July 2012, the Pennsylvania Department of Education (PDE) released a report identifying three Upper Darby School District schools as among the lowest-achieving schools for the number of students who are on grade level in reading and mathematics in 2011. Bywood Elementary School, Charles Kelly Elementary School and Stonehurst Elementary School are all three listed as in the bottom 15% lowest-achieving schools in the Commonwealth. Parents and students may be eligible for scholarships to transfer to another public or nonpublic school through the state's Opportunity Scholarship Tax Credit Program passed in June 2012.[10] The scholarships are limited to those students whose family's income is less than $60,000 annually, with another $12,000 allowed per dependent. Maximum scholarship award is $8,500, with special education students receiving up to $15,000 for a year's tuition. Parents pay any difference between the scholarship amount and the receiving school's tuition rate. Students may seek admission to neighboring public school districts. Each year the PDE publishes the tuition rate for each individual public school district.[11] Fifty three public schools in Allegheny County are among the lowest-achieving schools in 2011. According to the report, parents in 414 public schools (74 school districts) were offered access to these scholarships. For the 2012–13 school year, eight public school districts in Pennsylvania had all of their schools placed on the list, including: Sto-Rox School District, Chester Upland School District, Clairton City School District, Duquesne City School District, Farrell Area School District, Wilkinsburg Borough School District, William Penn School District and Steelton-Highspire School District.[12] Funding for the scholarships comes from donations by businesses which receive a state tax credit for donating.
- Statewide Academic Ranking
Upper Darby School District was ranked 448th out of 498 Pennsylvania school districts by the Pittsburgh Business Times in 2012.[13] The ranking was based on student academic achievement as demonstrated on the last three years of the PSSAs for: reading, writing math and science.[14] The PSSAs are given to all children in grades 3rd through 8th and the 11th grade in high school. Adapted examinations are given to children in the special education programs. In 2012, Upper Darby School District ranked 11th out of the 15 public school districts operating in Delaware County, Pennsylvania, with Radnor Township School District ranking highest in student academic achievement.
- 2011 - 449th[15]
- 2010 - 453rd[16]
- 2009 - 460th
- 2008 - 465th
- 2007 - 468th out of 501 school districts.[17]
- Overachiever statewide ranking
In 2012, the Pittsburgh Business Times also reported an Overachievers Ranking for 498 Pennsylvania school districts. Upper Darby School District ranked 442nd. In 2011, the district was 406th.[18] The editor describes the ranking as: "a ranking answers the question - which school districts do better than expectations based upon economics? This rank takes the Honor Roll rank and adds the percentage of students in the district eligible for free and reduced-price lunch into the formula. A district finishing high on this rank is smashing expectations, and any district above the median point is exceeding expectations."[19] Among Delaware County public schools, Upper Darby SD ranked 13th out of 15 districts with Radnor Township School District ranking first.[20]
- District Adequate Yearly Progress (AYP) history
In 2011, Upper Darby School District declined to Warning status due to lagging student academic achievement in both reading and mathematics.[21] In 2011, 94 percent of the 500 Pennsylvania public school districts achieved the No Child Left Behind Act progress level of 72% of students reading on grade level and 67% of students demonstrating on grade level math. In 2011, 46.9 percent of Pennsylvania school districts achieved Adequate Yearly Progress (AYP) based on student performance. An additional 37.8 percent of school districts made AYP based on a calculated method called safe harbor, 8.2 percent on the growth model and 0.8 percent on a two-year average performance.
- 2010 - achieved AYP status under the federal No Child Left Behind Act.
- 2009 - achieved AYP
- 2008 - Making Progress - Corrective Action 1
- 2007 - Corrective Action 1
- 2006 - Making Progress School Improvement II
- 2005 - School Improvement II
- 2004 - School Improvement I
- 2003 - Warning status
Graduation rate
In 2011, Upper Darby School District's graduation rate was 92%.[22] In 2010, the Pennsylvania Department of Education issued a new, 4-year cohort graduation rate. Upper Darby Senior High School's rate was 80.99% for 2010.[23]
- According to traditional graduation rate calculations
High school
Upper Darby Senior High School is located at 601 North Lansdowne Avenue, Drexel Hill. According to the National Center for Education Statistics, in 2010, the school reported an enrollment of 3,762 pupils in grades 9th through 12th, with 1408 pupils eligible for a federal free or reduced-price lunch. The school employed 257 teachers, yielding a student–teacher ratio of 14:1.[28] According to a report by the Pennsylvania Department of Education, 4 teachers were rated "Non‐Highly Qualified" under No Child Left Behind.[29] Upper Darby Senior High School is one of the largest high schools in Pennsylvania by enrollment. The High School is also home to the Upper Darby Performing Arts Center, and the Summer Stage program.
In 2011, Upper Darby Senior High School declined to Corrective Action II 5th Year AYP status due to poor achievement in reading and mathematics. The school met just one metric.[30] Under the federal No Child Left Behind Act, the school administration was required to notify parents of the school's poor achievement outcomes and to offer the parents the opportunity to transfer their child to a successful school within the District. Additionally, the school administration was required by the Pennsylvania Department of Education, to develop a School Improvement Plan to address the school's low student achievement. Under the Pennsylvania Accountability System, the school must pay for additional tutoring for struggling students.[31]
- 2010 - Corrective Action II 4th Year
- 2009 - Corrective Action II 3rd Year
- 2008 - Corrective Action II 2nd Year
- 2007 - Corrective Action II 1st Year
- 2006 - School Improvement II
- 2005 - School Improvement I - 2nd year
- 2004 - School Improvement I
- 2003 - Warning status
- PSSA Results:
11th Grade Reading
- 2011 - 56% on grade level, (23% below basic). State - 69.1% of 11th graders are on grade level.[32]
- 2010 - 53% (26% below basic). State - 66%[33]
- 2009 - 53% (24.8% below basic). State - 65%[34]
- 2008 - 51% (25% below basic). State - 65%[35]
- 2007 - 57% (22% below basic). State - 65%[36]
11th Grade Math:
- 2011 - 58% on grade level (26% below basic). In Pennsylvania, 60.3% of 11th graders are on grade level.[37]
- 2010 - 54% (30% below basic). State - 59%[38]
- 2009 - 50% (30% below basic). State - 56%.[39]
- 2008 - 51% (30% below basic). State - 56%[40]
- 2007 - 44% (33% below basic). State - 53%[41]
11th Grade Science:
- 2011 - 20% on grade level (32% below basic). State - 40% of 11th graders were on grade level.[42]
- 2010 - 20% (34% below basic). State - 39%
- 2009 - 21% (34% below basic). State - 40%[43]
- 2008 - 20% (32% below basic). State - 39%[44]
College remediation rate
According to a Pennsylvania Department of Education study released in January 2009, 59% of the Upper Darby Senior High School graduates required remediation in mathematics and or reading before they were prepared to take college level courses in the Pennsylvania State System of Higher Education or community colleges.[45] Less than 66% of Pennsylvania high school graduates, who enroll in a four-year college in Pennsylvania, will earn a bachelor's degree within six years. Among Pennsylvania high school graduates pursuing an associate degree, only one in three graduate in three years.[46] Per the Pennsylvania Department of Education, one in three recent high school graduates who attend Pennsylvania's public universities and community colleges takes at least one remedial course in math, reading or English.
Dual enrollment
Upper Darby Senior High School offers a dual enrollment program. This state program permits high school students to take courses, at local higher education institutions, to earn college credits. Students remain enrolled at their high school. The courses count towards high school graduation requirements and towards earning a college degree. The students continue to have full access to activities and programs at their high school. The college credits are offered at a deeply discounted rate. The state offered a small grant to assist students in costs for tuition, fees and books.[47] Under the Pennsylvania Transfer and Articulation Agreement, many Pennsylvania colleges and universities accept these credits for students who transfer to their institutions.[48]
For the 2009–10 funding year, the school district received a state grant of $5,023 for the program.[49]
SAT scores
From January to June 2011, 581 Upper Darby School District students took the SAT exams. The district's Verbal Average Score was 440. The Math average score was 464. The Writing average score was 423.[50] Pennsylvania ranked 40th among states with SAT scores: Verbal - 493, Math - 501, Writing - 479.[51] In the United States, 1.65 million students took the exam in 2011. They averaged 497 (out of 800) verbal, 514 math and 489 in writing.[52]
Graduation requirements
Upper Darby School Board has determined that a pupil must earn 135 credits to graduate, including: a required class every year in Mathematics, English, Social Studies, Science, Physical Education 4 years, Computer Course 1 and electives. Core academic courses are worth 5 credits each and AP courses are worth 7.5 credits.[53]
By law, all Pennsylvania secondary school students must complete a project as a part of their eligibility to graduate from high school. The type of project, its rigor and its expectations are set by the individual school district.[54]
By Pennsylvania School Board regulations, for the graduating class of 2017, students must demonstrate successful completion of secondary level course work in Algebra I, Biology, English Composition, and Literature for which the Keystone Exams serve as the final course exams. Students’ Keystone Exam scores shall count for at least one-third of the final course grade.[55][56][57] In 2011, Pennsylvania high school students field tested the Algebra 1, Biology and English Lit exams. The statewide results were: Algebra 1 38% on grade level, Biology 35% on grade level and English Lit - 49% on grade level.[58] Individual student, school or district reports were not made public, although they were reported to district officials by the Pennsylvania Department of Education.
Middle schools
Beverly Hills Middle School is located at 1400 Garrett Road, Upper Darby. According to the National Center for Education Statistics, in 2010, the school reported an enrollment of 1,456 pupils in grades 6th through 8th, with 877 pupils receiving a federal free or reduced-price lunch due to family poverty. The school employed 104.5 teachers, yielding a student–teacher ratio of 14:1.[59] According to a report by the Pennsylvania Department of Education, 17 teachers were rated "Non‐Highly Qualified" under No Child Left Behind.[60]
In 2011, Beverly Hills Middle School declined to Corrective Action II 3rd Year due to its chronically low student achievement in reading and mathematics.[61] In 2010, Beverly Middle School was in Corrective Action II 2nd Year due to ongoing low student achievement in reading and mathematics. In 2009, Beverly Middle School was in Corrective Action II First Year due to lagging student achievement in reading and mathematics. Under the federal No Child Left Behind Act the school was required to notify parents of its poor performance and to offer them the opportunity to transfer their child to a successful school in the District. Additionally, the Pennsylvania Department of Education required the School's Administration to write a plan to improve students achievement. The plan was submitted to the Pennsylvania Department of Education for approval.
- PSSA Results:
|
8th Grade Reading
|
8th Grade Math:
|
8th Grade Science:
- 2011 - 40% on grade level (38% below basic). State – 58.3% of 8th graders were on grade level.
- 2010 - 34% (40% below basic). State – 57%
- 2009 - 39% (31% below basic). State - 55%
- 2008 - 31% (35% below basic). State - 52%
- 2007 - tested, but results not made public.
|
7th Grade Reading
|
7th Grade Math:
|
|
6th Grade Reading:
|
6th Grade Math:
|
Drexel Hill Middle School is located at 3001 State Road, Drexel Hill. According to the National Center for Education Statistics, in 2010, the school reported an enrollment of 1,220 pupils in grades 6th through 8th, with 343 pupils receiving a federal free or reduced-price lunch due to family poverty. The school employed 101.5 teachers, yielding a student–teacher ratio of 12:1.[63] According to a report by the Pennsylvania Department of Education, 5 teachers were rated "Non‐Highly Qualified" under No Child Left Behind.[64]
In 2011, Drexel Hill Middle School declined to Warning status.[65] In 2010, Drexel Hill Middle School achieved AYP status under No Child Left Behind.
- PSSA Results:
|
8th Grade Reading
|
8th Grade Math:
|
8th Grade Science:
- 2011 - 56% on grade level (24% below basic). State – 58.3% of 8th graders were on grade level.
- 2010 - 56% (24% below basic). State – 57%
- 2009 - 50% (23% below basic). State - 55%
- 2008 - 45% (24% below basic). State - 52%
- 2007 - tested, but results not made public.
|
7th Grade Reading
|
7th Grade Math:
|
|
6th Grade Reading:
|
6th Grade Math:
|
Elementary schools
Aronimink Elementary School is located at 4611 Bond Avenue, Drexel Hill. According to the National Center for Education Statistics, in 2010, the school reported an enrollment of 280 pupils in grades first through 5th, with 31 pupils receiving a federal free or reduced-price lunch due to family poverty. The school employed 23 teachers, yielding a student–teacher ratio of 12:1.[67] According to a report by the Pennsylvania Department of Education, 100% of its teachers were rated "Highly Qualified" under No Child Left Behind.[68] In 2010 and 2011, Aronimink Elementary School achieved AYP status.[69] In 2011, only 82% of the students were reading on grade level in grades 3rd through 5th. In math, 88% of the students in 3rd through 5th grades were on grade level and 60% scored advanced. In 4th grade science, 95% of the pupils were on grade level with 63% achieving Advanced.[70]
Bywood Elementary School is located at 330 Avon Road, Upper Darby. According to the National Center for Education Statistics, in 2010, the school reported an enrollment of 656 pupils in grades first through 5th, with 438 pupils receiving a federal free or reduced-price lunch due to family poverty. The school employed 50 teachers, yielding a student–teacher ratio of 13:1.[71] According to a report by the Pennsylvania Department of Education, 100% of its teachers were rated "Highly Qualified" under No Child Left Behind.[72] In 2011, Bywood Elementary School was in Making Progress: in Corrective Action I AYP status.[73] In 2010, the school was in Corrective Action I AYP status. In 2011, only 53% of the students were reading on grade level in grades 3rd through 5th. In math, 63% of the students in 3rd through 5th grades were on grade level and 20% scored advanced. In 4th grade science, 63% of the pupils were on grade level.[74] Bywood Elementary School was identified by the Pennsylvania Department of Education as one of the lowest-performing schools in the Commonwealth in 2012. This makes low-income students eligible for an Opportunity Scholarship to attend a school in a neighboring school district or private school. For the past several years, the school administration was mandated under No Child Left Behind to notify parents that they could transfer their child to a successful school within the District. Additionally, the PDE required the school's administration to write a School Improvement Plan to raise student academic achievement in reading and mathematics.
Charles Kelly Elementary School is located at 3400 Dennison Avenue, Drexel Hill. According to the National Center for Education Statistics, in 2010, the school reported an enrollment of 320 pupils in grades first through 5th, with 342 pupils receiving a federal free or reduced-price lunch due to family poverty. The school is Title I. The school employed 23 teachers, yielding a student–teacher ratio of 13:1.[75] According to a report by the Pennsylvania Department of Education, 100% of its teachers were rated "Highly Qualified" under No Child Left Behind.[76] In 2011, Charles Kelly Elementary School was in Making Progress: in School Improvement II AYP status.[77] In 2010, the school declined to School Improvement II status. In 2011, only 50% of the students were reading on grade level in grades 3rd through 5th. In math, just 59% of the students in 3rd through 5th grades were on grade level and 20% scored advanced. In 4th grade science, 47% of the pupils were on grade level.[78] Charles Kelly School was identified by the Pennsylvania Department of Education as one of the lowest-performing schools in the Commonwealth in 2012. This makes low-income students eligible for an Opportunity Scholarship to attend a school in a neighboring school district or private school. For the past several years, the school administration was mandated under No Child Left Behind to notify parents that they could transfer their child to a successful school within the District. Additionally, the PDE required the school's administration to write a School Improvement Plan to raise student academic achievement in reading and mathematics.
Garrettford Elementary School is located at 3830 Garrett Road, Drexel Hill. According to the National Center for Education Statistics, in 2010, the school reported an enrollment of 564 pupils in grades first through 5th, with 144 pupils receiving a federal free or reduced-price lunch due to family poverty. The school employed 38 teachers, yielding a student–teacher ratio of 14:1.[79] According to a report by the Pennsylvania Department of Education, teachers were rated "Highly Qualified" under No Child Left Behind.[80] In 2011, Garrettford Elementary School declined to Warning status. In 2010, the school achieved AYP status.[81] In 2011, only 74% of the students were reading on grade level in grades 3rd through 5th. In math, just 77% of the students in 3rd through 5th grades were on grade level and 39% scored advanced. In 4th grade science, 83% of the pupils were on grade level.[82]
Highland Park Elementary School is located at 8301 West Chester Pike, Upper Darby. According to the National Center for Education Statistics, in 2010, the school reported an enrollment of 608 pupils in grades first through 6th, with 368 pupils receiving a federal free or reduced-price lunch due to family poverty. The school is Title I. The school employed 45 teachers, yielding a student–teacher ratio of 13:1.[83] According to a report by the Pennsylvania Department of Education, 100% of its teachers were rated "Highly Qualified" under No Child Left Behind.[84] In 2010 and 2011, Highland Park Elementary School achieved Warning AYP status.[85] In 2011, only 72% of the students were reading on grade level in grades 3rd through 5th. In math, just 75% of the students in 3rd through 5th grades were on grade level and 40% scored advanced. In 4th grade science, 74% of the pupils were on grade level.[86]
Hillcrest Elementary School is located at 2601 Bond Avenue, Drexel Hill. According to the National Center for Education Statistics, in 2010, the school reported an enrollment of 644 pupils in grades kindergarten through 5th, with 171 pupils receiving a federal free or reduced-price lunch due to family poverty. The school employed 43 teachers, yielding a student–teacher ratio of 15:1.[87] According to a report by the Pennsylvania Department of Education, 4 teachers were rated "Non‐Highly Qualified" under No Child Left Behind.[88] In 2010 and 2011, Hillcrest Elementary School achieved AYP status.[89] In 2011, 87% of the students were reading on grade level in grades 3rd through 5th. In math, 90% of the students in 3rd through 5th grades were on grade level and 60% scored advanced. In 4th grade science, 91% of the pupils were on grade level.[90]
Primos Elementary School is located at 861 Bunting Lane, Primos. According to the National Center for Education Statistics, in 2010, the school reported an enrollment of 434 pupils in grades kindergarten through 5th, with 157 pupils receiving a federal free or reduced-price lunch due to family poverty. The school employed 36 teachers, yielding a student–teacher ratio of 12:1.[91] According to a report by the Pennsylvania Department of Education, 100% of its teachers were rated "Highly Qualified" under No Child Left Behind.[92] In 2010 and 2011, Primos Elementary School achieved AYP status.[93] In 2011, only 70% of the students were reading on grade level in grades 3rd through 5th. In math, just 76% of the students in 3rd through 5th grades were on grade level and 31% scored advanced. In 4th grade science, 85% of the pupils were on grade level.[94]
Stonehurst Hills Elementary School is located at 7051 Ruskin Lane Upper Darby. According to the National Center for Education Statistics, in 2010, the school reported an enrollment of 563 pupils in grades first through 5th, with 463 pupils receiving a federal free or reduced-price lunch due to family poverty. The school is Title I. The school employed 48 teachers, yielding a student–teacher ratio of 13:1.[95] According to a report by the Pennsylvania Department of Education, 100% of its teachers were rated "Highly Qualified" under No Child Left Behind.[96] In 2010 and 2011, Stonehurst Hills Elementary School was in Warning AYP status due to declining student achievement in reading and mathematics.[97] In 2011, only 57% of the students were reading on grade level in grades 3rd through 5th. In math, 58% of the students in 3rd through 5th grades were on grade level and 19% scored advanced. In 4th grade science, 75% of the pupils were on grade level.[98] Stonehurst Hills Elementary School was identified by the Pennsylvania Department of Education as one of the lowest-performing public schools in the Commonwealth in 2012. This makes low-income students eligible for an Opportunity Scholarship to attend a school in a neighboring school district or private school.
Upper Darby Kindergarten Center is located at 3200 State Road, Drexel Hill. According to the National Center for Education Statistics, in 2010, the school reported an enrollment of 594 pupils in kindergarten, with 221 pupils receiving a federal free or reduced-price lunch due to family poverty. The school is Title I status. The school employed 22 teachers, yielding a student–teacher ratio of 26:1.[99]
Walter M. Senkow Elementary School is located at 15 East Lamont Avenue, Glenolden. According to the National Center for Education Statistics, in 2010, the school reported an enrollment of 230 pupils in grades first through 5th, with 141 pupils receiving a federal free or reduced-price lunch due to family poverty. The school employed 17 teachers, yielding a student–teacher ratio of 13:1.[100] According to a report by the Pennsylvania Department of Education, 100% of it teachers were rated "Highly Qualified" under No Child Left Behind.[101] In 2010 and 2011, Walter M. Senkow Elementary School achieved AYP status.[102] In 2011, only 78% of the students were reading on grade level in grades 3rd through 5th. In math, 88% of the students in 3rd through 5th grades were on grade level and 61% scored advanced. In 4th grade science, 91% of the pupils were on grade level.[103]
Westbrook Park Elementary School is located at 199 Westbrook Drive, Clifton Heights. According to the National Center for Education Statistics, in 2010, the school reported an enrollment of 465 pupils in grades kindergarten through 5th, with 211 pupils receiving a federal free or reduced-price lunch due to family poverty. The school is a Title I school. The school employed 33 teachers, yielding a student–teacher ratio of 14:1.[104] According to a report by the Pennsylvania Department of Education, 100% of its teachers were rated "Highly Qualified" under No Child Left Behind.[105] In 2010 and 2011, Westbrook Park Elementary School achieved AYP status.[106] In 2011, only 65% of the students were reading on grade level in grades 3rd through 5th. In math, just 71% of the students in 3rd through 5th grades were on grade level and 33% scored advanced. In 4th grade science, 81% of the pupils were on grade level.[107]
Special education
In December 2010, the district administration reported that 1,852 pupils or 14.9% of the district's pupils received Special Education services, with 51% of the identified students having a specific learning disability. In December 2009, the district administration reported that 1,856 pupils or 15% of the district's pupils received Special Education services.[108]
In 2010, the state of Pennsylvania provided $1,026,815,000 for special education services. This funding is in addition to the state's basic education per pupil funding, as well as, all other state and federal funding.[109] The Pennsylvania Special Education funding system assumes that 16% of the district’s students receive special education services. It also assumes that each student’s needs accrue the same level of costs.[110] The state requires each district to have a three-year special education plan to meet the unique needs of its special education students.[111] Overidentification of students, in order to increase state funding, has been an issue in the Commonwealth. Some districts have more than 20% of its students receiving special education services while others have 10% supported through special education.[112]
The School District received a $6,800,755 supplement for special education services in 2010.[113] For the 2011–12 and 2012–13 school year, all Pennsylvania public school districts received the same level of funding for special education that they received in 2010–11. This level funding is provided regardless of changes in the number of pupils who need special education services and regardless of the level of services the respective students required.[114][115]
In 2009, Upper Darby School District was identified by the Pennsylvania Department of Education for Least Restrictive Environment monitoring. One hundred ninety six schools districts were selected in 2008–09. The district received an alert letter from the PDE - Bureau of Special Education.[116] School districts were placed in one of three categories: Tier 1, Tier 2 or Tier 3. The district was placed in Tier 2 due to students spending more than 60% of the school day, outside of regular education. The monitoring is a product of the PDE addressing its voluntary settlement in Gaskin V. Pennsylvania which ordered that special education students spend most of their school day (80%) in regular education classrooms with supplementary aids and services to assist funded by the taxpayers.[117][118][119] In 2010, the district was assigned to the Tier 1 monitoring list, due to students spending less than 40% of their day in a regular education classroom. The district received a letter of “Warning” letter from the Pennsylvania Department of Education. Tier 1 districts received on-site LRE monitoring in spring 2010.[120]
Gifted education
The District Administration reported that 166 or 1.33% of its students were gifted in 2009. The highest percentage of gifted students reported among all 500 school districts and 100 public charter schools in Pennsylvania was North Allegheny School District with 15.5% of its students identified as gifted.[121] By law, the district must provide mentally gifted programs at all grade levels. The referral process for a gifted evaluation can be initiated by teachers or parents by contacting the student’s building principal and requesting an evaluation. All requests must be made in writing. To be eligible for mentally gifted programs in Pennsylvania, a student must have a cognitive ability of at least 130 as measured on a standardized ability test by a certified school psychologist. Other factors that indicate giftedness will also be considered for eligibility.[122][123]
School safety and bullying
Upper Darby School District Administration reported there were five incidents of bullying in the district in 2009. Seventy school safety incidents resulted in police intervention with 40 arrests. There were 27 incidents of sexual harassment and 84 assaults on students.[124] In 2011, a video tape of an assault of a 13-year-old student by 7 Upper Darby High School students was widely reported. The video became a national symbol of school bullying.[125] In October 2011, the District announced establishing a School Safety Committee to address the school's serious safety issues.[126]
The Upper Darby School Board has provided the district's antibully cyberbullying policy online.[127] All Pennsylvania schools are required to have an anti-bullying policy incorporated into their Code of Student Conduct beginning in 2006. The policy must identify disciplinary actions for bullying and designate a school staff person to receive complaints of bullying. The policy must be available on the school's website and posted in every classroom. All Pennsylvania public schools must provide a copy of its anti-bullying policy to the Office for Safe Schools every year, and shall review their policy every three years. Additionally, the district must conduct an annual review of that policy with students.[128] The Center for Schools and Communities works in partnership with the Pennsylvania Commission on Crime & Delinquency and the Pennsylvania Department of Education to assist schools and communities as they research, select and implement bullying prevention programs and initiatives.[129][130]
Education standards relating to student safety and antiharassment programs are described in the 10.3. Safety and Injury Prevention in the Pennsylvania Academic Standards for Health, Safety and Physical Education.[131]
Wellness policy
Upper Darby School Board established a district wellness policy in 2010.[132] The policy deals with nutritious meals served at school, the control of access to some foods and beverages during school hours, age appropriate nutrition education for all students, and physical education for students K-12. The policy is in response to state mandates and federal legislation (P.L. 108 – 265). The law dictates that each school district participating in a program authorized by the Richard B. Russell National School Lunch Act (42 U.S.C. 1751 et seq) or the Child Nutrition Act of 1966 (42 U.S.C. 1771 et seq) "shall establish a local school wellness policy by School Year 2006." Most districts identified the superintendent and school foodservice director as responsible for ensuring local wellness policy implementation.[133] e
The legislation placed the responsibility of developing a wellness policy at the local level so the individual needs of each district can be addressed. According to the requirements for the Local Wellness Policy, school districts must set goals for nutrition education, physical activity, campus food provision, and other school-based activities designed to promote student wellness. Additionally, districts were required to involve a broad group of individuals in policy development and to have a plan for measuring policy implementation. Districts were offered a choice of levels of implementation for limiting or prohibiting low nutrition foods on the school campus. In final implementation these regulations prohibit some foods and beverages on the school campus.[134] The Pennsylvania Department of Education required the district to submit a copy of the policy for approval.
At Upper Darby School District nutrition education is provided within the sequential, comprehensive health education program, in accordance with State Board of Education curriculum regulations and the academic standards for Health, Safety and Physical Education, and Family and Consumer Sciences mandated by the Commonwealth. Additionally, foods provided through the National School Lunch or School Breakfast Programs are required to comply with federal nutrition standards under the School Meals Initiative.
Budget
In 2011, the average teacher salary in Upper Darby School District was $59,534.90 a year, while the cost of the benefits teachers receive was $17,637.37 per employee, for a total annual average teacher compensation of $77,172.28.[135] According to a study conducted at the American Enterprise Institute, in 2011, public school teachers’ total compensation is roughly 50 percent higher than they would likely receive in the private sector. The study found that the most generous benefits that teachers receive are not accounted for in many studies of compensation, including: pension, retiree health benefits and job security.[136]
In 2009, the district reported employing 1,272 teachers and administrators with a median salary of $61,505 and a top salary of $185,000.[137] The teacher’s work day begins 20 minutes before students arrive and ends 20 minutes after dismissal with 188 days in the contract year. Teachers receive a 30-minute duty-free lunch and a planning period each school day. Teachers receive extra pay for any extra duty or additional hours worked. Additionally, the teachers receive a defined benefit pension, health insurance, professional development reimbursement, paid personal days, 10 paid sick days, and other benefits. Retirees receive health insurance at taxpayer expense until the age of 65 years plus a retirement bonus.[138][139]
Upper Darby School District administrative costs per pupil in 2008 was $570.95 per pupil. The lowest administrative cost per pupil in Pennsylvania was $398 per pupil.[140] The Pennsylvania School Boards Association collects and maintains statistics on salaries of public school district employees in Pennsylvania. According to the association's report, the average salary for a superintendent, for the 2007–08 school year, was $122,165. Superintendents and administrators receive a benefit package commensurate with that offered to the district's teachers' union.[141]
In 2008 the district administration reported that per pupil spending was $11,441 which ranked 220th among Pennsylvania's 501 school districts. In 2010 the per pupil spending had increased to $12,501.23[142] Among the states, Pennsylvania’s total per pupil revenue (including all sources) ranked 11th at $15,023 per student, in 2008–09.[143] In 2007, the Pennsylvania per pupil total expenditures was $12,759.[144] The U.S. Census Bureau reports that Pennsylvania spent $8,191 per pupil in school year 2000–01.[145]
Reserves In 2008, the district reported a balance of $4,598,798 in an unreserved-designated fund. The unreserved-undesignated fund balance was reported as $5,363,244. [146] In 2010, Upper Darby School District Administration reported an increase to $8,342,416 in the unreserved-undesignated fund balance and $4,539,979 in an unreserved-designated fund. Pennsylvania school district reserve funds are divided into two categories – designated and undesignated. The undesignated funds are not committed to any planned project. Designated funds and any other funds, such as capital reserves, are allocated to specific projects. School districts are required by state law to keep 5 percent of their annual spending in the undesignated reserve funds to preserve bond ratings. According to the Pennsylvania Department of Education, from 2003 to 2010, as a whole, Pennsylvania school districts amassed nearly $3 billion in reserved funds.[147]
In September 2010, the Pennsylvania Auditor General conducted a performance audit of the District. The findings were reported to the School Board and the District’s administration.[148]
The district is funded by a combination of: a local earned income tax, a property tax, a real estate transfer tax 0.5%, coupled with substantial funding from the Commonwealth of Pennsylvania and the federal government.[149] Interest earnings on accounts also provide nontax income to the district. In the Commonwealth of Pennsylvania, pension income and Social Security income are exempted from state personal income tax and local earned income tax, regardless of the level of the individual’s personal wealth.[150]
State basic education funding
For the 2012–13 school year, the district will receive $31,207,723.[151] The Governor's Executive Budget for 2012–2013 includes $9.34 billion for kindergarten through 12th grade public education, including $5.4 billion in basic education funding, which is an increase of $49 million over the 2011–12 budget. The state also provides $100 million for the Accountability Block grant. The state will also provide $544.4 million for School Employees’ Social Security and $856 million for School Employees’ Retirement fund called PSERS.[152] This amount is a $21,823,000 increase (0.34%) over the 2011–2012 appropriations for Basic Education Funding, School Employees' Social Security, Pupil Transportation, Nonpublic and Charter School Pupil Transportation. Since taking office, Corbett’s first two budgets have restored more than $918 million in support of public schools, compensating for the $1 billion in federal stimulus dollars lost at the end of the 2010–11 school year.
In 2011–12, the district received a $28,476,001 allocation, of state Basic Education Funding.[153][154] Additionally, the School District received $727,700 in Accountability Block Grant funding. The enacted Pennsylvania state Education budget included $5,354,629,000 for the 2011–2012 Basic Education Funding appropriation. This amount was a $233,290,000 increase (4.6%) over the enacted State appropriation for 2010–2011.[155] The highest increase in state basic education funding was awarded to Duquesne City School District, which got a 49% increase in state funding for 2011–12.[156] In 2010, Upper Darby School District reported that 6,049 students received free or reduced-price lunches, due to the family meeting the federal poverty level.[157]
In the 2010–2011 budget year, the Commonwealth of Pennsylvania provided a 3.77% increase in Basic Education Funding for a total of $31,189,577 . Among the districts in County, the highest increase went to School District which got a % increase. One hundred fifty Pennsylvania school districts received the base 2% increase. The highest increase in 2010–11 went to Kennett Consolidated School District in Chester County which received a 23.65% increase in state funding.[158] The state's hold harmless policy regarding state basic education funding continued where each district received at least the same amount as it received the prior school year, even where enrollment had significantly declined. The amount of increase each school district received was set by Governor Edward Rendell and then Secretary of Education Gerald Zahorchak, as a part of the state budget proposal given each February. This was the second year of Governor Rendell’s policy to fund some districts at a far greater rate than others.
In the 2009–2010 budget year, the Commonwealth of Pennsylvania provided UDSD an 11.61% increase in Basic Education Funding for a total of $30,057,689 this was the highest increase among public school districts in Delaware County. The state Basic Education Funding to the district in 2008–09 was $26,932,119.05 Ninety school districts received a 2% increase. Muhlenberg School District in Berks County received a 22.31% increase in state basic education funding in 2009.[159] The amount of increase each school district received was set by Governor Edward G. Rendell and the Secretary of Education Gerald Zahorchak, as a part of the state budget proposal.[160] According to the U.S. Census Bureau, Pennsylvania spent $7,824 Per Pupil in the year 2000. This amount increased up to $12,085 by the year 2008.[161][162]
Accountability Block Grants
Beginning in 2004–2005, the state launched the Accountability Block Grant school funding. This program has provided $1.5 billion to Pennsylvania’s school districts. The Accountability Block Grant program requires that its taxpayer dollars are focused on specific interventions that are most likely to increase student academic achievement. These interventions include: teacher training, all-day kindergarten, lower class size K-3rd grade, literacy and math coaching programs that provide teachers with individualized job-embedded professional development to improve their instruction, before or after school tutoring assistance to struggling students. For 2010–11, the district applied for and received $1,975,160 in addition to all other state and federal funding. The district uses the funding to hire math and teacher coaches who train teachers to provide effective instruction, to implement research-based improvement strategies and to pay for Social and Health Services.[163][164]
Classrooms for the Future grant
The Classroom for the Future state program provided districts with hundreds of thousands of extra state funding to buy laptop computers for each core curriculum high school class (English, Science, History, Math) and paid for teacher training to optimize the computers use. The program was funded from 2006 to 2009. The School District received $469,223 in 2006–07. In 2007–08, UDSD received $838,700. The district received $200,597 in 2008–09 for a total funding of $1,508,520.[165] In Delaware County the highest award was given to Upper Darby School District. The highest funding statewide was awarded to Philadelphia City School District in Philadelphia County - $9,409,073. In 2010, Classrooms for the Future funding was curtailed statewide due to a massive state financial crisis.
Education Assistance grant
The state's EAP funding provides for the continuing support of tutoring services and other programs to address the academic needs of eligible students. Funds are available to eligible school districts and full-time career and technology centers (CTC) in which one or more schools have failed to meet at least one academic performance target, as provided for in Section 1512-C of the Pennsylvania Public School Code. In 2010–11 the School District received $766,423.[166]
Science It’s Elementary grant
No Upper Darby Elementary School applied to participate in the State's Science It’s Elementary grant in 2008–09. For the 2008–09 school year, the program was funded in 143 schools reaching 2,847 teachers and 66,973 students across Pennsylvania.[167] In 2007, the Pennsylvania Department of Education initiated an effort to improve science instruction in the Commonwealth’s public elementary schools. Called Science: It’s Elementary, the program is a hands on instruction approach for elementary science classes that develops problem-solving and critical thinking skills.[168] To encourage schools to adopt the program’s standards aligned curriculum, the state provided a grant to cover the costs of materials and extensive mandatory teacher training.[169] The district was required to develop a three-year implementation plan for the participating school. They had to appoint a district liaison who was paid $3000 by PDE to serve as the conduit of all information between the district and the Department and its agents along with submitting orders and distributing supplies to implementing teachers. For the 2006–07 state education budget, $10 million was allocated. The 2006–07 State Education Budget provided $635 million in new spending for Pre-K through 12th grades for the 2006–07 school year. This marks an 8-percent increase over 2005–06 public school funding.[170] The grant program was expanded to $14.5 million in the 2008–09 budget.
Federal Stimulus grant
The district received an extra $12,637,217 in ARRA - Federal Stimulus money to be used in specific programs like special education and meeting the academic needs of low-income students.[171][172] The funding was limited to the 2009–10 and 2010–2011 school years.[173] Due to the temporary nature of the funding, schools were repeatedly advised to use the funds for one-time expenditures like acquiring equipment, making repairs to buildings, training teachers to provide more effective instruction or purchasing books and software.
Extracurriculars
The district offers a variety of clubs, activities and sports. Eligibility for participation is determined by school board policy.
By Pennsylvania law, all K-12 students residing in the district, including those who attend a private nonpublic school, cyber charter school, charter school and those homeschooled, are eligible to participate in the extracurricular programs, including all athletics. They must meet the same eligibility rules as the students enrolled in the district's schools.[174]
School Improvement Grant
In the summer of 2011, the district administration applied for School Improvement Grant funding, from the federal government (over $9.9 million available). The Bywood Elementary school, Charles Kelly Elementary were eligible for funding due to chronic low achievement. The District received $112,360. The grant stipulates the funds be used for improving student achievement using one of four federally dictated strategies. The strategies are: transformation, turnaround, restart with new faculty and administration or closure of failing schools.[175] The Pennsylvania Education Secretary awarded $66 million to reform Pennsylvania's lowest-achieving schools in August 2011. The funding is for three years.[176]
For the 2009–10 school year, Upper Darby School District administration applied for a School Improvement Grant. It was eligible for funding due to the chronic, low achievement at the Upper Darby Senior High School, at Kelly Elementary and at Bywood Elementary. The District received $102,640.[177]
In 2010, Pennsylvania received $141 million from the federal –US Department of Education, to turn around its worst-performing schools. The funds were disbursed via a competitive grant program.[178] The Pennsylvania Department of Education has identified 200 Pennsylvania schools as "persistently lowest-achieving," making them eligible for this special funding.[179] Pennsylvania required low performing schools to apply or provide documentation about why they had not applied. The funds must be used, by the district, to turn around schools in one of four ways: school closure, restart - close the school and reopen it as a charter school. The other two options involve firing the principal. One would require at least half the faculty in a chronically poor performing school be dismissed. The second involves intensive teacher training coupled with strong curriculum revision or a longer school day.[180]
Race to the Top grant
District officials applied for the federal Race to the Top grant which would have provided over one million dollars in additional federal funding to improve student academic achievement. Due to very low student achievement the district was identified as a turnaround district making it eligible for an additional $750 per child in the district.[181] Participation required the administration, the school board and the local teachers' union to sign an agreement to prioritize improving student academic success. In Pennsylvania, 120 public school districts and 56 charter schools agreed to participate.[182] Pennsylvania was not approved for the grant. The failure of districts to agree to participate was cited as one reason that Pennsylvania was not approved.[183][184][185]
21st Century learning grant
In July 2012, Upper Darby School District did not apply for a federal grant which is run by the PDE. The grant calls for the establishment and sustainability of community learning centers that provide additional educational services to students in high-poverty and low-performing schools. The grant was competitive. Applications for the grants were reviewed and scored by a panel of representatives from the educational field and professional grant writers. The school received $114,061. While 101 entities applied for the funding, only 66 were approved, including eight charter schools. The funding is for the 2012–13 fiscal year.[186]
Common Cents state initiative
The Upper Darby School Board elected to not participate in the Pennsylvania Department of Education Common Cents program.[187] The program called for the state to audit the district, at no cost to local taxpayers, to identify ways the district could save tax dollars.[188] After the review of the information, the district was not required to implement the recommended cost savings changes.
Real estate taxes
Property tax rates in 2012–13 were set by the school board at 32.84 mills. A mill is $1 of tax for every $1,000 of a property's assessed value. Irregular property reassessments have become a serious issue in the commonwealth as it creates a significant disparity in taxation within a community and across a region.[189] Property taxes, in the Commonwealth of Pennsylvania, apply only to real estate - land and buildings. The property tax is not levied on cars, business inventory, or other personal property. Certain types of property are exempt from property taxes, including: places of worship, places of burial, private social clubs, charitable and educational institutions and government property. Additionally, service related, disabled US military veterans may seek an exemption from paying property taxes. Pennsylvania school district revenues are dominated by two main sources: 1) Property tax collections, which account for the vast majority (between 75-85%) of local revenues; and 2) Act 511 tax collections, which are around 15% of revenues for school districts.[190] When the school district includes municipalities in two counties, each of which has different rates of property tax assessment, a state board equalizes the tax rates between the counties.[191] In 2010, miscalculations by the State Tax Equalization Board (STEB) were widespread in the Commonwealth and adversely impacted funding for many school districts, including those that did not cross county borders.[192]
- 2011–12 - 31.7300 mills.[193]
- 2010–11 - 30.9000 mills[194]
- 2009–10 - 29.7200 mills.[195]
- 2008–09 - 28.7400 mills.[196]
- 2007–08 - 27.7700 mills.[197]
- 2006–07 - 26.5500 mills.[198]
- 2005–06 - 25.2300 mills.[199]
Act 1 Adjusted Index
The Act 1 of 2006 Index regulates the rates at which each school district can raise property taxes in Pennsylvania. Districts are not permitted to raise property taxes above that Index unless they either: allow voters to vote by referendum or they seek an exception from the state Department of Education. The base index for the 2011–2012 school year is 1.4 percent, but the Act 1 Index can be adjusted higher, depending on a number of factors, such as property values and the personal income of district residents. Act 1 included 10 exceptions, including: increasing pension costs, increases in special education costs, a catastrophe like a fire or flood, increase in health insurance costs for contracts in effect in 2006 or dwindling tax bases. The base index is the average of the percentage increase in the statewide average weekly wage, as determined by the PA Department of Labor and Industry, for the preceding calendar year and the percentage increase in the Employment Cost Index for Elementary and Secondary Schools, as determined by the Bureau of Labor Statistics in the U.S. Department of Labor, for the previous 12-month period ending June 30. For a school district with a market value/personal income aid ratio (MV/PI AR) greater than 0.4000, its index equals the base index multiplied by the sum of .75 and its MV/PI AR for the current year.[200] In June 2011, the Pennsylvania General Assembly eliminated six of the ten exceptions to the Act 1 Index.[201] Several exceptions were maintained: 1) costs to pay interest and principal on indebtedness incurred prior to September 4, 2004 for Act 72 schools and prior to June 27, 2006 for non-Act 72 schools; 2) costs to pay interest and principal on electoral debt; 3) costs incurred in providing special education programs and services (beyond what is already paid by the State); and 4) costs due to increases of more than the Index in the school’s share of payments to PSERS (PA school employees pension fund) taking into account the state mandated PSERS contribution rate.[202][203]
The School District Adjusted Index for the School District 2006–2007 through 2011–2012.[204]
- 2006–07 - 5.3%, Base 3.9%
- 2007–08 - 4.6%, Base 3.4%
- 2008–09 - 6.0%, Base 4.4%
- 2009–10 - 5.6%, Base 4.1%
- 2010–11 - 4.0%, Base 2.9%
- 2011–12 - 1.9%, Base 1.4%
- 2012–13 - 2.3%, Base 1.7%[205]
For the 2012–13 budget year, Upper Darby School Board applied for 2 exceptions to exceed the Act 1 Index: special education costs and teacher pension costs. For 2012–2013, 274 school districts adopted a resolution certifying that tax rates would not be increased above their index; 223 school districts adopted a preliminary budget leaving open the option of exceeded the Index limit. For the exception for pension costs, 194 school districts received approval to exceed the Index. For special education costs, 129 districts received approval to exceed the tax limit. For the exception for pension costs, 194 school districts received approval to exceed the Index. For special education costs, 129 districts received approval to exceed the tax limit.[206]
For the 2011–12 school year, the Upper Darby School Board applied for exceptions to exceed the Act 1 Index, including Maintenance of Local Tax Revenue, teacher pension costs and special education costs. Each year, the Upper Darby School Board has the option of adopting either 1) a resolution in January certifying they will not increase taxes above their index or 2) a preliminary budget in February. A school district adopting the resolution may not apply for referendum exceptions or ask voters for a tax increase above the inflation index. A specific timeline for these decisions is published annually, by the Pennsylvania Department of Education.[207]
According to a state report, for the 2011–2012 school year budgets, 247 school districts adopted a resolution certifying that tax rates would not be increased above their index; 250 school districts adopted a preliminary budget. Of the 250 school districts that adopted a preliminary budget, 231 adopted real estate tax rates that exceeded their index. Tax rate increases in the other 19 school districts that adopted a preliminary budget did not exceed the school district’s index. Of the districts who sought exceptions: 221 used the pension costs exemption and 171 sought a Special Education costs exemption. Only 1 school district sought an exemption for Nonacademic School Construction Project, while 1 sought an exception for Electoral debt for school construction.[208]
Upper Darby School Board did not apply for any exceptions to exceed the Act 1 index for the budget in 2011.[209] For 2009–10 school budget, the board did not apply for exceptions to exceed the Index.[210] In the Spring of 2010, 135 Pennsylvania school boards asked to exceed their adjusted index. Approval was granted to 133 of them and 128 sought an exception for pension costs increases.[211]
Property tax relief
In 2012, Upper Darby School District approved homestead residents received $313.[212] In 2010, property tax relief for 16,571 approved residents of Upper Darby School District was set at $310.[213] The highest property tax relief, among Pennsylvania school districts, went to the homesteads of Chester Upland School District of Delaware County which received $632 per approved homestead in 2010. Chester-Upland School District has consistently been the top recipient since the programs inception.[214] The tax relief was subtracted from the total annual school property tax bill. Property owners apply for the relief through the county Treasurer's office. Farmers can qualify for a farmstead exemption on building used for agricultural purposes. The farm must be at least 10 contiguous acres (40,000 m2) and must be the primary residence of the owner. Farmers can qualify for both the homestead exemption and the farmstead exemption. In Delaware County, 68.22% of eligible property owners applied for property tax relief in 2009.[215]
Additionally, the Pennsylvania Property Tax/Rent Rebate program is provided for low income Pennsylvanians aged 65 and older; widows and widowers aged 50 and older; and people with disabilities age 18 and older. The income limit is $35,000 for homeowners. The maximum rebate for both homeowners and renters is $650. Applicants can exclude one-half (1/2) of their Social Security income, consequently people who have an income of substantially more than $35,000 may still qualify for a rebate. Individuals must apply annually for the rebate. This tax rebate can be taken in addition to Homestead/Farmstead Property Tax Relief. In 2012, Pennsylvania Secretary of the Treasury reported issuing more than half a million property tax rebates totaling $238 million.[216] The program is funded by the Pennsylvania Lottery. Property tax rebates are increased by an additional 50 percent for senior households in the state, so long as those households have incomes under $30,000 and pay more than 15% of their income in property taxes.[217]
Property taxes in Pennsylvania are relatively high on a national scale. According to the Tax Foundation, Pennsylvania ranked 11th in the U.S. in 2008 in terms of property taxes paid as a percentage of home value (1.34%) and 12th in the country in terms of property taxes as a percentage of income (3.55%).[218]
Sports
The District is assigned to Pennsylvania Interscholastic Athletic Association (PIAA) District 1
The District funds the following costly sports for high school students:
|
|
- According to PIAA directory July 2012[219]
References
- ↑ Pennsylvania Department of Education, Enrollment and Projections by LEA, July 20, 2011
- ↑ Pennsylvania Department of Education (July 2011). "Enrollment and Projections by school district".
- ↑ Moton, Kenneth., Upper Darby approves $160M budget, cuts, 6ABC.com, June 26, 2012
- ↑ Pennsylvania Department of Education, Pennsylvania Public School District Tuition Rates, May 2012
- ↑ US Census Bureau, American Fact Finder, 2009
- ↑ US Census Bureau (2010). "American Fact Finder, State and County quick facts".
- ↑ US Census Bureau (September 2011). "Income, Poverty, and Health Insurance Coverage in the United States: 2010" (PDF).
- ↑ Upper Darby School District Administration, Strategic Plan - Academic Standards and Assessment Midpoint Review, November 24, 2010
- ↑ Pennsylvania Public School Code Governance 2010
- ↑ Pennsylvania Department of Education (July 2012). "Opportunity Scholarship Tax Credit Program".
- ↑ Pennsylvania Department of Education (May 2012). "Tuition rate Fiscal Year 2011–2012".
- ↑ Olsen, Laura, State list of failing schools has 53 in county, Pittsburgh Post Gazette, July 26, 2012
- ↑ Pittsburgh Business Times (April 6, 2012). "Guide to Pennsylvania Schools Statewide ranking".
- ↑ "Statewide Honor Roll Rankings 2012". Pittsburgh Business Times. April 5, 2012.
- ↑ "Statewide Honor Roll Rankings 2011". Pittsburgh Business Times. April 2011.
- ↑ Pittsburgh Business Times (April 30, 2010). "Statewide Honor Roll Rankings 2010".
- ↑ "Three of top school districts in state hail from Allegheny County". Pittsburgh Business Times. May 23, 2007.
- ↑ Pittsburgh Business Times, Statewide Overachivers Ranking Information, April 6, 2012
- ↑ "Overachiever statewide ranking". Pittsburgh Business Times. May 6, 2010.
- ↑ Pittsburgh Business Times (April 6, 2012). "Statewide Overachivers Ranking Information for Delaware County".
- ↑ Pennsylvania Department of Education (September 29, 2011). "Upper Darby School District AYP Overview 2011".
- ↑ Pennsylvania Department of Education (September 29, 2011). "Upper Darby School District AYP Data Table 2011".
- ↑ Pennsylvania Department of Education (March 15, 2011). "New 4-year Cohort Graduation Rate Calculation Now Being Implemented".
- ↑ Pennsylvania Department of Education (October 20, 2010). "Upper Darby High School Academic Achievement Report Card Data table 2010".
- ↑ The Times-Tribune (June 27, 2010). "PA School District Statistical Snapshot Database 2008–09".
- ↑ The Times-Tribune (June 25, 2009). "County School Districts Graduation Rates 2008".
- ↑ Pennsylvania Partnerships for Children (2008). "High School Graduation rate 2007" (PDF).
- ↑ National Center for Education Statistics, Common Care Data - Upper Darby Senior High School, 2010
- ↑ Pennsylvania Department of Education, Professional Qualifications of Teachers Upper Darby Senior High School, September 29, 2011
- ↑ Pennsylvania Department of Education (September 29, 2011). "Upper Darby Senior High School AYP Overview".
- ↑ Pennsylvania Department of Education (2012). "Pennsylvania Accountability System Frequently Asked Questions".
- ↑ Pennsylvania Department of Education (September 29, 2011). "2010-2011 PSSA and AYP Results".
- ↑ Pennsylvania Department of Education (2010). "2009-2010 PSSA and AYP Results".
- ↑ The Times-Tribune (September 14, 2009). "Grading Our Schools database, 2009 PSSA results".
- ↑ Pennsylvania Department of Education (August 15, 2008). "2007-2008 PSSA and AYP Results".
- ↑ Pennsylvania Department of Education (2007). "PSSA Math and Reading results".
- ↑ Pennsylvania Department of Education (September 29, 2011). "Upper Darby Senior High School Academic Achievement Report Card 2011" (PDF).
- ↑ Pennsylvania Department of Education, Upper Darby Senior High School Academic Achievement Report Card 2010, October 20, 2010
- ↑ Pennsylvania Department of Education, Upper Darby Senior High School Academic Achievement Report Card 2009, September 14, 2009
- ↑ Pennsylvania Department of Education, Upper Darby Senior High School Academic Achievement Report Card 2008, August 15, 2008
- ↑ Pennsylvania Department of Education, Upper Darby Senior High School Academic Achievement Report Card, 2007
- ↑ Pennsylvania Department of Education (September 29, 2011). "2010-2011 PSSA results in Science".
- ↑ The Times-Tribune (2009). "Grading Our Schools database, 2009 Science PSSA results".
- ↑ Pennsylvania Department of Education (2008). "Report on PSSA Science results by school and grade 2008".
- ↑ Pennsylvania Department of Education (January 20, 2009). "Pennsylvania College Remediation Report,".
- ↑ National Center for Education Statistics, IPEDS Integrated Postsecondary Education Data System, 2008
- ↑ Pennsylvania Department of Education (2010). "Dual Enrollment Guidelines".
- ↑ Commonwealth of Pennsylvania (March 2010). "Pennsylvania Transfer and Articulation Agreement".
- ↑ Pennsylvania Department of Education (2009). "Dual Enrollment Grants 2009 10 Fall Grants by School District".
- ↑ Pennsylvania Department of Education (2011). "Public School SAT Scores 2011".
- ↑ College Board (September 2011). "SAT Scores State By State - Pennsylvania".
- ↑ "While U.S. SAT scores dip across the board, N.J. test-takers hold steady". September 2011.
- ↑ Upper Darby High School Administration, Upper Darby High School Course Selection Guide, 2012
- ↑ Pennsylvania State Board of Education. "Pennsylvania Code §4.24 (a) High school graduation requirements".
- ↑ Pennsylvania Department of Education (2010). "Keystone Exam Overview" (PDF).
- ↑ Pennsylvania Department of Education (September 2011). "Pennsylvania Keystone Exams Overview".
- ↑ Pennsylvania State Board of Education (2010). "Rules and Regulation Title 22 PA School Code Chapter 4".
- ↑ Pennsylvania Department of Education (2011). "Keystone Exams".
- ↑ National Center for Education Statistics, Common Care Data – Beverly Hills Middle School, 2010
- ↑ Pennsylvania Department of Education, Professional Qualifications of Teachers Beverly Hills Middle School, September 29, 2011
- ↑ Pennsylvania Department of Education (September 29, 2011). "Beverly Hills Middle School AYP Overview 2011 & 2010".
- ↑ Pennsylvania Department of Education (September 29, 2011). "Beverly Hills Middle School Academic Achievement Report Card 2011" (PDF).
- ↑ National Center for Education Statistics, Common Care Data – Drexel Hill Middle School, 2010
- ↑ Pennsylvania Department of Education, Professional Qualifications of Teachers Drexel Hill Middle School, September 29, 2011
- ↑ Pennsylvania Department of Education (September 29, 2011). "Drexel Hill Middle School AYP Overview AYP Overview 2011".
- ↑ Pennsylvania Department of Education (September 29, 2011). "Drexel Hill Middle School Academic Achievement Report Card 2011" (PDF).
- ↑ National Center for Education Statistics, Common Care Data – Aronimink Elementary School, 2010
- ↑ Pennsylvania Department of Education, Professional Qualifications of Teachers Aronimink Elementary School, September 29, 2011
- ↑ Pennsylvania Department of Education, Aronimink Elementary School AYP Overview, September 29, 2011
- ↑ Pennsylvania Department of Education (September 29, 2011). "Aronimink Elementary School Report Card 2011" (PDF).
- ↑ National Center for Education Statistics, Common Care Data – Bywood Elementary School, 2010
- ↑ Pennsylvania Department of Education, Professional Qualifications of Teachers Bywood Elementary School, September 29, 2011
- ↑ Pennsylvania Department of Education, (September 29, 2011). "Bywood Elementary School AYP Overview 2010 and 2011,".
- ↑ Pennsylvania Department of Education (September 29, 2011). "Bywood Elementary School Report Card 2011" (PDF).
- ↑ National Center for Education Statistics, Common Care Data – Charles Kelly Elementary School, 2010
- ↑ Pennsylvania Department of Education, Professional Qualifications of Teachers Charles Kelly Elementary School, September 29, 2011
- ↑ Pennsylvania Department of Education, Charles Kelly Elementary School AYP Overview, September 29, 2011
- ↑ Pennsylvania Department of Education (September 29, 2011). "Charles Kelly Elementary School Report Card 2011" (PDF).
- ↑ National Center for Education Statistics, Common Care Data – Garrettford Elementary School, 2010
- ↑ Pennsylvania Department of Education, Professional Qualifications of Teachers Garrettford Elementary School, September 29, 2011
- ↑ Pennsylvania Department of Education, Garrettford Elementary School AYP Overview, September 29, 2011
- ↑ Pennsylvania Department of Education (September 29, 2011). "Garrettford Elementary School Report Card 2011".
- ↑ National Center for Education Statistics, Common Care Data – Highland Park Elementary School, 2010
- ↑ Pennsylvania Department of Education, Professional Qualifications of Teachers Highland Park Elementary School, September 29, 2011
- ↑ Pennsylvania Department of Education, Highland Park Elementary School AYP Overview, September 29, 2011
- ↑ Pennsylvania Department of Education (September 29, 2011). "Highland Park Elementary School Report Card 2011" (PDF).
- ↑ National Center for Education Statistics, Common Care Data – Hillcrest Elementary School, 2010
- ↑ Pennsylvania Department of Education, Professional Qualifications of Teachers Hillcrest Elementary School, September 29, 2011
- ↑ Pennsylvania Department of Education, Hillcrest Elementary School AYP Overview, September 29, 2011
- ↑ Pennsylvania Department of Education (September 29, 2011). "Hillcrest Elementary School Report Card 2011" (PDF).
- ↑ National Center for Education Statistics, Common Care Data – Primos Elementary School, 2010
- ↑ Pennsylvania Department of Education, Professional Qualifications of Teachers Primos Elementary School, September 29, 2011
- ↑ Pennsylvania Department of Education, Primos Elementary School AYP Overview, September 29, 2011
- ↑ Pennsylvania Department of Education (September 29, 2011). "Primos Elementary School Report Card 2011" (PDF).
- ↑ National Center for Education Statistics, Common Care Data – Stonehurst Hills Elementary School, 2010
- ↑ Pennsylvania Department of Education, Professional Qualifications of Teachers Stonehurst Hills Elementary School, September 29, 2011
- ↑ Pennsylvania Department of Education, Stonehurst Hills Elementary School AYP Overview, September 29, 2011
- ↑ Pennsylvania Department of Education (September 29, 2011). "Stonehurst Hills Elementary School Report Card 2011" (PDF).
- ↑ National Center for Education Statistics, Common Care Data – Upper Darby Kindergarten Center, 2010
- ↑ National Center for Education Statistics, Common Care Data – Walter M Senkow Elementary School, 2010
- ↑ Pennsylvania Department of Education, Professional Qualifications of Teachers Walter M. Senkow Elementary School, September 29, 2011
- ↑ Pennsylvania Department of Education, Walter M Senkow Elementary School AYP Overview, September 29, 2011
- ↑ Pennsylvania Department of Education (September 29, 2011). "Walter M. Senkow Elementary School Report Card 2011" (PDF).
- ↑ National Center for Education Statistics, Common Care Data – Westbrook Park Elementary School, 2010
- ↑ Pennsylvania Department of Education, Professional Qualifications of Teachers Westbrook Park Elementary School, September 29, 2011
- ↑ Pennsylvania Department of Education, Westbrook Park Elementary School AYP Overview, September 29, 2011
- ↑ Pennsylvania Department of Education (September 29, 2011). "Westbrook Park Elementary School Report Card 2011" (PDF).
- ↑ Pennsylvania Bureau of Special Education Services (2009–2010). "Area School District Special Education Data Report LEA Performance on State Performance Plan (SPP) Targets".
- ↑ Pennsylvania Department of Education. "Pennsylvania Special Education Funding".
- ↑ Senator Patrick Browne (November 1, 2011). "Senate Education Committee Holds Hearing on Special Education Funding & Accountability".
- ↑ Pennsylvania Department of Education Amy Morton, Executive Deputy Secretary (November 11, 2011). "Public Hearing: Special Education Funding & Accountability Testimony".
- ↑ Baruch Kintisch Education Law Center (November 11, 2011). "Public Hearing: Special Education Funding & Accountability Testimony" (PDF).
- ↑ Pennsylvania Department of Education (July 2010). "Special Education Funding from Pennsylvania State_2010-2011".
- ↑ Pennsylvania Department of Education (2011). "Special Education Funding 2011–2012 Fiscal Year".
- ↑ Pennsylvania Department of Education, Investing in PA kids, April 2012
- ↑ Pennsylvania Department of Education (2010). "LRE Index Scores and Identification for Monitoring".
- ↑ Martin Elks (June 3, 2010). "FINAL REPORT OF THE BUREAU DIRECTOR'S ADVISORY PANEL ON LEAST RESTRICTIVE ENVIRONMENT FOLLOWING GASKIN V. DEPARTMENT OF EDUCATION SEPTEMBER, 2005—JUNE, 2010" (PDF).
- ↑ Pennsylvania Department of Education (July 1, 2002). "Least Restrictive Environment (LRE) and Educational Placement for Students with Individualized Education Programs (IEPs)".
- ↑ Pennsylvania Department of Education (September 1, 1997). "Placement Options for Special Education".
- ↑ Pennsylvania Department of Education Bureau of Special Education (2010). "LRE Index Scores".
- ↑ Pennsylvania Department of Education (Revised December 1, 2009 Child Count (Collected July 2010)). "Gifted Students as Percentage of Total Enrollment by School District/Charter School" (PDF). Check date values in:
|date=(help) - ↑ Pennsylvania Department of Education and Pennsylvania School Board. "CHAPTER 16. Special Education For Gifted Students". Retrieved February 4, 2011.
- ↑ Pennsylvania Department of Education (March 26, 2010). "Special Education for Gifted Students Notice of Parental rights" (PDF).
- ↑ Commonwealth of Pennsylvania Safe School Center (2009). "Pennsylvania Safe Schools Online Reports".
- ↑ Behrendt, Taylor & Canning, Andrea (Feb 1, 2011). "Caught on Tape: 13-Year-Old Attacked By 7 Classmates".
- ↑ Reilly, Linda, Members of Upper Darby School Safety Committee announced, October 28, 2011
- ↑ Upper Darby School Board, Bullying Cyber Bullying Policy 249, August 10, 2010
- ↑ Pennsylvania General Assembly (2006). "Regular Session 2007–2008 House Bill 1067, Act 61 Section 6 page 8".
- ↑ Center for Safe Schools of Pennsylvania (2006). "Bullying Prevention advisory".
- ↑ Pennsylvania Department of Education (2012). "Bullying, Hazing, and Harassment Resources".
- ↑ Pennsylvania State Board of Education (January 11, 2003). "Pennsylvania Academic Standards Health, Safety and Physical Education".
- ↑ School Board Policy Manual, Student Wellness Policy 246, 2010
- ↑ Probart C, McDonnell E, Weirich JE, Schilling L, Fekete V (September 2008). "Statewide assessment of local wellness policies in Pennsylvania public school districts.". J Am Diet Assoc. 108 (9): 1497–502. doi:10.1016/j.jada.2008.06.429. PMID 18755322.
- ↑ Pennsylvania Department of Education – Division of Food and Nutrition. (July 2008). "Nutrition Standards for Competitive Foods in Pennsylvania Schools for the School Nutrition Incentive".
- ↑ Pennsylvania Department of Education (2012). "Investing in Pennsylvania Students".
- ↑ American Enterprise Institute, (2011). "Assessing the Compensation of Public School Teachers".
- ↑ Asbury Park Press (2009). "PA. Public School Salaries".
- ↑ Upper Darby School Board. "Upper Darby School District Teacher Union Employment Contract 2010".
- ↑ "Pennsylvania Public Schools Teachers' Union Contracts". April 27, 2012.
- ↑ Fenton, Jacob.., Pennsylvania School District Data: Will School Consolidation Save Money?, The Morning Call, February 2009
- ↑ Pennsylvania School Board Association (October 2009). "Public School Salaries 11th Annual".
- ↑ Pennsylvania Department of Education (2010). "2009-10 Selected Data - 2009–10 Total Expenditures per ADM".
- ↑ United States Census Bureau (2009). "States Ranked According to Per Pupil Elementary-Secondary Public School System Finance Amounts: 2008–09" (PDF).
- ↑ US Census Bureau (2009). "Total and current expenditures per pupil in fall enrollment in public elementary and secondary education, by function and state or jurisdiction: 2006–07".
- ↑ US Census Bureau (March 2003). "Public Education Finances 2000–01 Annual Survey of Local Government Finances" (PDF).
- ↑ Pennsylvania Department of Education. "Fund Balances by Local Education Agency 1997 to 2008".
- ↑ Murphy, Jan., Pennsylvania's public schools boost reserves, CentreDaily Times, September 22, 2010
- ↑ Pennsylvania Auditor General (September 2010). "Upper Darby School District Delaware County, Pennsylvania Performance Audit Report".
- ↑ Penn State Cooperative Extension (2010). "What are the Local Taxes in Pennsylvania?, Local Tax Reform Education Project,".
- ↑ Pennsylvania Department of Revenue (April 2010). "Personal Income Taxation Guidelines".
- ↑ Senator Jake Corman (June 28, 2012). "Pennsylvania Education funding by Local School District" (PDF).
- ↑ Pennsylvania General Assembly Sen Jake Corman (June 29, 2012). "SB1466 of 2012 General Fund Appropriation".
- ↑ PA Senate Appropriations Committee (June 28, 2011). "School District 2011–12 Funding Report".
- ↑ Pennsylvania Department of Education (July 2011). "Basic Education Funding".
- ↑ Pennsylvania Department of Education (June 30, 2011). "Basic Education Funding".
- ↑ Pennsylvania Department of Education (June 30, 2011). "Basic Education Funding 2011–2012 Fiscal Year".
- ↑ Pennsylvania Department of Education, District Allocations Report 2009, 2009–10
- ↑ Pennsylvania House Appropriations Committee Education Budget information (June 30, 2010). "PA Basic Education Funding-Printout2 2010–2011" (PDF).
- ↑ Pennsylvania Department of Education (October 2009). "Funding Allocations by district".
- ↑ Pennsylvania Office of Budget (February 2009). "Governor's Budget Proposal 2009 Pennsylvania Department of Education Budget Proposal 2009".
- ↑ U.S. Census Bureau., Annual Survey of Local Government Finances., 2000
- ↑ U.S. Census Bureau., 2008 Survey of Local Government Finances – School Systems, 2010
- ↑ Pennsylvania Department of Education (2010). "Accountability Block Grant report Grantee list 2010".
- ↑ Pennsylvania Department of Education (2008). "Accountability Block Grant Mid Year report".
- ↑ Pennsylvania Auditor General (December 22, 2008). "Classrooms for the Future grants audit" (PDF).
- ↑ Pennsylvania Department of Education (2010). "Educational Assistance Program Funding 2010–2011 Fiscal Year".
- ↑ Pennsylvania Department of Education, Science: It’s Elementary Grantees Students in 143 Schools Benefit from Intensive Science Curriculum, July 22, 2008
- ↑ Patricia Vathis Pennsylvania Department of Education, Grants and Subsidies Science: It’s Elementary, 2006
- ↑ Pennsylvania Department of Education, 2010 – 2011 Science: It’s Elementary Application Guidelines, July 2010
- ↑ Pennsylvania Department of Education, Governor Rendell Commends Teachers for Enhancing Science Education in Pennsylvania, August 10, 2006
- ↑ Commonwealth of Pennsylvania (2009). "County ARRA FUNDING Report".
- ↑ ProPublica (2009). "Recovery Tracker Eye on the stimulus".
- ↑ "School stimulus money". Pittsburgh Post-Gazette. March 12, 2009.
- ↑ Pennsylvania Office of the Governor Press Release, (November 10, 2005). "Home-Schooled, Charter School Children Can Participate in School District Extracurricular Activities".
- ↑ Pennsylvania Department of Education (2011). "Pennsylvania School Improvement Planning".
- ↑ Pennsylvania Department of Education (August 23, 2011). "Education Secretary Announces $66 Million Awarded to Reform Pennsylvania Lowest-Achieving Schools".
- ↑ Pennsylvania Department of Education (2010). "School Improvement grants 2010".
- ↑ Pennsylvania Department of Education. "School Improvement information".
- ↑ Pennsylvania Department of Education. "Pennsylvania School Improvement Grant Components_Stat_Requirements".
- ↑ Pennsylvania Department of Education (June 9, 2010). "Pennsylvania School Improvement Grant Components_Stat_Requirements" (PDF).
- ↑ Pennsylvania Department of Education (December 9, 2009). "Race To The Top Webinar powerpoint for districts December 2009" (PDF).
- ↑ Governor's Press Office release (January 20, 2010). "Pennsylvania's 'Race to the Top' Fueled by Effective Reforms, Strong Local Support,".
- ↑ Race to the Top Fund, U.S. Department of Education, March 29, 2010.
- ↑ Gerald Zahorchak (December 2008). "Pennsylvania Race to the Top Letter to Superintendents" (PDF).
- ↑ Pennsylvania Department of Education (January 19, 2009). "Pennsylvania Race to the Top -School Districts Title I Allocations 2009–10".
- ↑ Pennsylvania Department of Education, Education Secretary Announces $19.78 Million Awarded to Enhance Academic Opportunities for At-Risk Students, July 11, 2012
- ↑ Governor Office Press release (March 12, 2008). "PA Education Department Announces 39 Districts to Take Part in 'Common Cents' Cost-Saving".
- ↑ Pennsylvania Department of Education (2007). "Common Cents program - Making Every Dollar Count".
- ↑ Pennsylvania Department of Education (2011). "Real Estate Tax Rates by School District 2011–12 Real Estate Mills".
- ↑ Pennsylvania Department of Education (2004). "Act 511 Tax Report".
- ↑ State Tax Equalization Board (2011). "State Tax Equalization Board About US".
- ↑ Pennsylvania Auditor General office - Bureau of Audits (February 2011). "A Special Performance Audit of the Pennsylvania State Tax Equalization Boards" (PDF).
- ↑ Pennsylvania Department of Education (2011). "Real Estate Tax Millage by School District,".
- ↑ Pennsylvania Department of Education (2010). "Real Estate Tax Millage by School District,".
- ↑ Pennsylvania Department of Education (2010). "Financial Elements Reports".
- ↑ Pennsylvania Department of Education (2009). "Financial Elements Reports 2008–09 Real Estate Mills".
- ↑ Pennsylvania Department of Education (2008). "Real Estate Tax Millage by School District,".
- ↑ Pennsylvania Department of Education (2006). "Real Estate Tax Millage by School District,".
- ↑ Pennsylvania Department of Education (2005). "Real Estate Tax Millage by School District,".
- ↑ Pennsylvania Department of Education (2010). "2010-11 Act 1 of 2006 Referendum Exception Guidelines".
- ↑ Kaitlynn Riely (August 4, 2011). "Law could restrict school construction projects". Pittsburgh Post-Gazette.
- ↑ Pennsylvania General Assembly (June 29, 2011). "SB330 of 2011".
- ↑ Eric Boehm (July 1, 2011). "Property tax reform final piece of state budget". PA Independent.
- ↑ Pennsylvania Department of Education (May 2010). "Special Session Act 1 of 2006 School District Adjusted Index for 2006–2007 through 2010–2011".
- ↑ Pennsylvania Department of Education, 2012–2013 School District Adjusted Index, May 2012
- ↑ Pennsylvania Department of Education, Report on Referendum Exceptions For School Year 2012–2013, March 30, 2012
- ↑ Pennsylvania Department of Education (2011). "Special Session Act 1 of 2006 the Taxpayer Relief Act information".
- ↑ Pennsylvania Department of Education (April 2011). "Report on Exceptions".
- ↑ Pennsylvania Department of Education (May 2010). "Report on Referendum Exceptions for 2010–2011".
- ↑ Pennsylvania Department of Education (May 2009). "Report on Referendum Exceptions for 2009–2010".
- ↑ Scarcella, Frank & Pursell, Tricia (May 25, 2010). "Local school tax assessments exceed state averages". The Daily Item.
- ↑ Pennsylvania Department of Education (May 1, 2012). "2012-2013 Estimated State Property Tax Relief per Homestead".
- ↑ Pennsylvania Department of Education, Tax Relief per Homestead, May 1, 2010
- ↑ Tax Relief per Homestead 2009, Pennsylvania Department of Education Report, May 1, 2009
- ↑ Pennsylvania Auditor General Office, Special Report Pennsylvania Property Tax Relief, 2-23-2010.
- ↑ Elias, Joe., Pennsylvania Treasury Department to issue $238 million in property tax rebates, The Harrisburg Patriot-News, |June 30, 2012
- ↑ Pennsylvania Department of Revenue., Property Tax/Rent Rebate Program, June 2012
- ↑ New Census Data on Property Taxes on Homeowners, Tax Foundation, September 22, 2009.
- ↑ Pennsylvania Interscholastic Athletics Association, PIAA School Directory, 2012
Further reading
External links
- Upper Darby School District website
- Upper Darby School District website (Archive)
- Delaware County Youth Initiative
- Upper Darby Performing Arts Center
- Delaware County IU 25
- Delaware County Technical High School
- Delaware County Workforce Investment Board
Founded 1736 | ||
| Communities |
|   |
| Education | ||
| Historic Sites | ||
| Infrastructure | ||
| Regional Rail Stations | ||
| Trolley/Subway Station |
| |
Delaware County, Pennsylvania schools | |||||||||||||||||||||||||||||||||||||||||||||||||||||||||||||||||
|---|---|---|---|---|---|---|---|---|---|---|---|---|---|---|---|---|---|---|---|---|---|---|---|---|---|---|---|---|---|---|---|---|---|---|---|---|---|---|---|---|---|---|---|---|---|---|---|---|---|---|---|---|---|---|---|---|---|---|---|---|---|---|---|---|---|
| |||||||||||||||||||||||||||||||||||||||||||||||||||||||||||||||||
| |||||||||||||||||||||||||||||||||||||||||||||||||||||||||||||||||
Coordinates: 39°55′45″N 75°16′05″W / 39.929287°N 75.267935°W