Demographics of Benin
The demographics of Benin include population density, ethnicity, education level, health of the populace, economic status, religious affiliations and other aspects of the population.
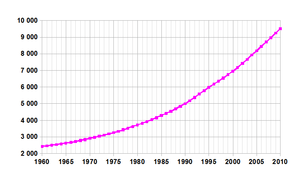
The majority of Benin’s 9.32 million people live in the south. The population is young, with a life expectancy of 50 years.
About 42 African ethnic groups live in this country; these various groups settled in Benin at different times and also migrated within the country. Ethnic groups include:
- the Yoruba in the southeast (migrated from what is now Nigeria in the 12th century);
- the Dendi in the north-central area (they came from what is now Mali in the 16th century);
- the Bariba and the Fula (or Fulani) (Fula: Fulɓe; French: Peul) in the northeast;
- the Betammaribe and the Somba in the Atacora Range;
- the Fon in the area around Abomey in the South Central; and
- the Mina, Xueda, and Aja (who came from what is now Togo in the 12th century) on the coast.
French is the official language but is spoken more in urban than in rural areas. The literacy rate is 52.2% adult males and 23.6% adult females, and slowly growing. Recent migrations have brought other African Nationals to Benin: Nigerians, Togolese, Malians, etc. The foreign community also includes many Lebanese and Indians involved in trade and commerce. The personnel of the many European Embassies and Foreign Aid Missions and of nongovernmental organizations and various missionary groups account for a large number of the 5,500 European population.
Several religions are practiced in Benin. African Traditional Religion is widespread (50%), and its practices vary from one ethnic group to the other. Arab merchants introduced Islam in the north and among the Yoruba. European missionaries brought Christianity to the south and central areas of Benin. Muslims account for 20% of the population and Christians for 30%. Many nominal Muslims and Christians continue to practice African Traditional Religion traditions. It is believed that West African Vodun originated in Benin and was introduced to Brazil and the Caribbean Islands by slaves taken from this particular area of the Slave Coast.
Population
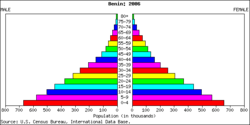
According to the 2010 revision of the World Population Prospects the total population was 8 850 000 in 2010, compared to only 2 255 000 in 1950. The proportion of children below the age of 15 in 2010 was 43.7%, 53.3% were between 15 and 65 years of age, while 3% were of 65 years or older .[1]
| Total population (x 1000) | Population aged 0–14 (%) | Population aged 15–64 (%) | Population aged 65+ (%) | |
|---|---|---|---|---|
| 1950 | 2 255 | 35.2 | 57 | 7.8 |
| 1955 | 2 302 | 37.0 | 56.6 | 6.3 |
| 1960 | 2 420 | 38.4 | 56.1 | 5.5 |
| 1965 | 2 602 | 40.7 | 54.3 | 5 |
| 1970 | 2 850 | 42.7 | 52.7 | 4.6 |
| 1975 | 3 182 | 44.2 | 51.4 | 4.4 |
| 1980 | 3 611 | 45.2 | 50.7 | 4.0 |
| 1985 | 4 140 | 45.9 | 50.4 | 3.7 |
| 1990 | 4 773 | 46.2 | 50.4 | 3.4 |
| 1995 | 5 651 | 45.5 | 51.3 | 3.1 |
| 2000 | 6 518 | 45.6 | 51.4 | 3.0 |
| 2005 | 7 634 | 44.6 | 52.4 | 3.0 |
| 2010 | 8 850 | 43.7 | 53.3 | 3.0 |
Vital statistics
Registration of vital events is in Benin not complete. The Population Departement of the United Nations prepared the following estimates.[1]
| Period | Live births per year | Deaths per year | Natural change per year | CBR* | CDR* | NC* | TFR* | IMR* |
|---|---|---|---|---|---|---|---|---|
| 1950–1955 | 93 000 | 79 000 | 14 000 | 41.0 | 34.8 | 6.1 | 5.86 | 210 |
| 1955–1960 | 103 000 | 75 000 | 28 000 | 43.6 | 31.7 | 11.9 | 6.13 | 195 |
| 1960–1965 | 116 000 | 74 000 | 41 000 | 46.2 | 29.7 | 16.5 | 6.42 | 184 |
| 1965–1970 | 129 000 | 75 000 | 54 000 | 47.5 | 27.6 | 19.9 | 6.65 | 173 |
| 1970–1975 | 144 000 | 73 000 | 71 000 | 47.8 | 24.1 | 23.7 | 6.84 | 152 |
| 1975–1980 | 163 000 | 73 000 | 90 000 | 47.9 | 21.5 | 26.4 | 7.00 | 136 |
| 1980–1985 | 185 000 | 77 000 | 108 000 | 47.7 | 19.8 | 27.9 | 7.01 | 126 |
| 1985–1990 | 210 000 | 82 000 | 128 000 | 47.2 | 18.4 | 28.8 | 6.88 | 120 |
| 1990–1995 | 240 000 | 85 000 | 155 000 | 46.0 | 16.3 | 29.7 | 6.56 | 108 |
| 1995–2000 | 268 000 | 89 000 | 179 000 | 44.0 | 14.6 | 29.5 | 6.16 | 98 |
| 2000–2005 | 298 000 | 95 000 | 203 000 | 42.2 | 13.4 | 28.7 | 5.79 | 91 |
| 2005–2010 | 336 000 | 103 000 | 233 000 | 40.7 | 12.4 | 28.3 | 5.49 | 85 |
| * CBR = crude birth rate (per 1000); CDR = crude death rate (per 1000); NC = natural change (per 1000); IMR = infant mortality rate per 1000 births; TFR = total fertility rate (number of children per woman) | ||||||||
Births and deaths [2]
| Year | Population | Live births | Deaths | Natural increase | Crude birth rate | Crude death rate | Rate of natural increase | TFR |
|---|---|---|---|---|---|---|---|---|
| 2012* | 376 439 | 79 116 | 297 323 | 40,2 | 8,4 | 31,8 | ||
- Data are projections presented in Annuaire Statistique 2010.
Fertility and Births
Total Fertility Rate (TFR) (Wanted Fertility Rate) and Crude Birth Rate (CBR):[3][4] [5]
| Year | CBR (Total) | TFR (Total) | CBR (Urban) | TFR (Urban) | CBR (Rural) | TFR (Rural) |
|---|---|---|---|---|---|---|
| 1996 | 42,2 | 6,32 (5,0) | 37,8 | 5,24 (4,0) | 44,8 | 7,02 (5,6) |
| 2001 | 41,1 | 5,6 (4,6) | 36,0 | 4,4 (3,6) | 43,8 | 6,4 (5,3) |
| 2006 | 41,5 | 5,7 (4,8) | 38,7 | 4,9 (4,1) | 43,0 | 6,3 (5,3) |
| 2011–12 | 33,3 | 4,9 (4,0) | 33,1 | 4,3 (3,6) | 33,3 | 5,4 (4,4) |
Ethnic groups
There are several dozen ethnolinguistic groups in Benin, representing three of Africa's language families: Niger–Congo, Nilo-Saharan, and Afroasiatic. The latter is represented by Hausa living mostly as merchants in the north, while Nilo-Saharan is represented by the Dɛndi, descending from the Songhai Empire. The Dɛndi language predominates along the Niger River in the far north, and is used as a lingua franca in Muslim areas throughout the north, in Alibori, Borgou, and Donga provinces. Of the Niger–Congo family, five branches are represented:
- Mande by the Boko or Busa, now in the far eastern corner (southern Alibori-northern Borgou), but previously more widely spread before being largely absorbed by the Bariba
- Senegambian by the nomadic Fulani scattered across the northeast
- Benue–Congo by the Yoruba such as those of the old kingdom of Sakete, and the capital city of Porto-Novo, having expanded west from the Yoruba cities of Oyo and Ife in the 12th to 19th centuries
- Gur (Voltaic) languages predominate in the four northern provinces, with the Batɔmbu (Bariba) of the old Borgou (Bariba) Kingdom occupying most of the countryside in its successor provinces of Borgou and Alibori, as well as the provincial capital of Parakou; the Yom throughout much of Donga province and its capital Djougou; and several groups in the Atakora, including the Bɛtamaribɛ of the Otammari country around the provincial capital of Natitingou, the Biali, the Waama of Tanguiéta, and the Gulmàceba.
- Kwa, especially the Gbe languages spoken by the Tado peoples in the southern and central provinces: the Aja who established themselves in Kouffo province from neighboring Togo and gave rise to the other Tado peoples of Benin, except for the Mina of Mono province, who arrived separately from Togo or Ghana: The Fɔn culture centered in Zou province around the old Fɔn capital of Abomey, but also dominant in Cotonou and southern Atlantique areas such as Ouidah; the Maxi in central Collines, especially around Savalou; the Ayizɔ of central Atlantique (Allada); the Xwla and Xueda in the lagoons of the coast; the Tɔfin of Ouémé; and the Gun. Other Kwa languages are spoken by the Anii in southern Donga in the region of Bassila, and the Fooɖo in western Donga near the town of Ouaké.
The largest ethnic group are the Fon, with 1.7 million speakers of the Fon language (2001), followed by the various Yoruba groups (1.2 million), the Aja (600,000), the Bariba (460,000), the Ayizo (330,000), the Fulani (310,000), and the Gun (240,000). Near the ports in the south can be found many people who are descended from returned Brazilian slaves. There are also small numbers of Europeans, principally French, and people from the western Asia, mainly Lebanese, and East Asia, chiefly Indians.
CIA World Factbook demographic statistics
The following demographic statistics are from the CIA World Factbook, unless otherwise indicated.
Population
- 9,325,032
- Note: estimates for this country explicitly take into account the effects of excess mortality due to AIDS; this can result in lower life expectancy, higher infant mortality and death rates, lower population and growth rates, and changes in the distribution of population by age and sex than would otherwise be expected (July 2011 est.)
Age structure
- 0-14 years: 44.7% (male 2,126,973/female 2,042,340)
- 15-64 years: 52.6% (male 2,443,370/female 2,461,421)
- 65 years and over: 2.7% (male 101,640/female 149,288) (2011 est.)
Median age
- Total:17.2 years
- Male: 16.8 years
- Female: 17.7 years (2009 est.)
Population growth rate
- 2.911% (2011 est.)
Urbanization
- Urban population: 42% of total population (2010)
- Rate of urbanization: 4% annual rate of change (2005-10 est.)
Sex ratio
- At birth: 1.05 male(s)/female
- Under 15 years: 1.04 male(s)/female
- 15-64 years: 0.99 male(s)/female
- 65 years and over: 0.70 male(s)/female
- Total population: 1.0 male(s)/female (2009 est.)
Life expectancy at birth
- Total population: 59 years
- Male: 57.83 years
- Female: 60.23 years (2009 est.)
HIV/AIDS
- Adult prevalence rate: 1.2% (2007 est.)
- People living with HIV/AIDS: 64,000 (2007 est.)
- Deaths: 3,300 (2007 est.)
Major infectious diseases
- Degree of risk: very high
- Food or waterborne diseases: bacterial and protozoal diarrhea, hepatitis A, and typhoid fever
- Vectorborne diseases: malaria, yellow fever, and others are high risks in some locations
- Respiratory disease: meningococcal meningitis
- Animal contact disease: rabies (2009)
Nationality
English :Noun: Beninese (singular and plural) English :Adjective: Beninese
However, French is widely spoken throughout Benin while English speakers are few and far between. From a practical standpoint the only terms one is likely to hear while in country are Béninois (for men) and Béninoise (for women). Pronunciation (Ben-een-w-ah) is the same for both terms.
French: Noun (Male): Béninois French: Noun (Female): Béninoise
Ethnic groups
- Fon and related 39.2%, Adja and related 15.2%, Yoruba and related 12.3%, Bariba and related 9.2%, Fulani and related 7%, Ottamari and related 6.1%, Yoa-Lokpa and related 4%, Dendi and related 2.5%, Other 1.6%, Unspecified 2.9% (2002 est.) [6]
Religions
- Roman Catholic 27.1%, Islam 24.4%, Vodoun 17.3%, Protestant 10.4% (Celestial 5%, Methodist 3.2%, other Protestant 2.2%), other Traditional Religions 6%, other Christian 5.3%, Other 1.9%, None 6.5%, Unspecified 1.1% (2002 est.) [6]
Languages
Over 50 languages are spoken in Benin. The official language is French. Of the many indigenous African languages, Fon and Yoruba are the most important in southern Benin, and in the north there are at least six major languages, including Baatonum and Fulani.
Literacy
- Definition: age 15 and over can read and write
- Total population: 34.7%
- Male: 47.9%
- Female: 23.3% (2002 census)
Education expenditure
- 4.4% of total GDP
- country comparison to the world: 91
References
| Wikimedia Commons has media related to Demographics of Benin. |
- 1 2 Population Division of the Department of Economic and Social Affairs of the United Nations Secretariat, World Population Prospects: The 2010 Revision
- ↑ http://unstats.un.org/unsd/demographic/products/vitstats/serATab3.pdf
- ↑ http://dhsprogram.com/pubs/pdf/FR81/FR81.pdf
- ↑ http://dhsprogram.com/pubs/pdf/FR133/FR133.pdf
- ↑ http://dhsprogram.com/pubs/pdf/FR197/FR197.pdf
- 1 2 "Africa :: BENIN". CIA The World Factbook.
![]() This article incorporates public domain material from the CIA World Factbook document "2009 edition". and the 2003 U.S. Department of State website.
This article incorporates public domain material from the CIA World Factbook document "2009 edition". and the 2003 U.S. Department of State website.