Effects of global warming
The effects of global warming are the environmental and social changes caused (directly or indirectly) by human emissions of greenhouse gases. There is a scientific consensus that climate change is occurring, and that human activities are the primary driver.[1] Many impacts of climate change have already been observed, including glacier retreat,[2] changes in the timing of seasonal events[2] (e.g., earlier flowering of plants),[3] and changes in agricultural productivity.[2]
Future effects of climate change will vary depending on climate change policies[4] and social development.[5] The two main policies to address climate change are reducing human greenhouse gas emissions (climate change mitigation) and adapting to the impacts of climate change.[6] Geoengineering is another policy option.[6]
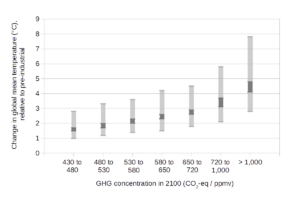
Near-term climate change policies could significantly affect long-term climate change impacts.[4][7] Stringent mitigation policies might be able to limit global warming (in 2100) to around 2 °C or below, relative to pre-industrial levels.[8] Without mitigation, increased energy demand and extensive use of fossil fuels[9] might lead to global warming of around 4 °C.[10][11] Higher magnitudes of global warming would be more difficult to adapt to,[12] and would increase the risk of negative impacts.[13]
Definitions
In this article, "climate change" means a change in climate that persists over a sustained period of time.[14][15] The World Meteorological Organization defines this time period as 30 years.[14] Examples of climate change include increases in global surface temperature (global warming), changes in rainfall patterns, and changes in the frequency of extreme weather events. Changes in climate may be due to natural causes, e.g., changes in the sun's output, or due to human activities, e.g., changing the composition of the atmosphere.[16] Any human-induced changes in climate will occur against a background of natural climatic variations[16] and of variations in human activity such as population growth on shores or in arid areas which increase or decrease climate vulnerability.[17]
Also, the term "anthropogenic forcing" refers to the influence exerted on a habitat or chemical environment by humans, as opposed to a natural process.[18]
Temperature changes
.png)
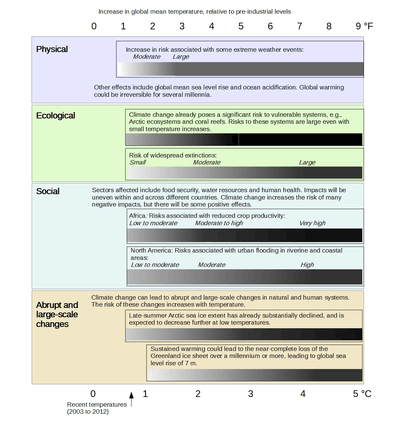
This article breaks down some of the impacts of climate change according to different levels of future global warming. This way of describing impacts has, for instance, been used in the IPCC (Intergovernmental Panel on Climate Change) Assessment Reports on climate change.[20] The instrumental temperature record shows global warming of around 0.6 °C during the 20th century.[21]
SRES emissions scenarios
The future level of global warming is uncertain, but a wide range of estimates (projections) have been made.[22] The IPCC's "SRES" scenarios have been frequently used to make projections of future climate change.[23]:22–24 The SRES scenarios are "baseline" (or "reference") scenarios, which means that they do not take into account any current or future measures to limit GHG emissions (e.g., the UNFCCC's Kyoto Protocol and the Cancún agreements).[24] Emissions projections of the SRES scenarios are broadly comparable in range to the baseline emissions scenarios that have been developed by the scientific community.[22][25]
In the IPCC Fourth Assessment Report, changes in future global mean temperature were projected using the six SRES "marker" emissions scenarios.[26] Emissions projections for the six SRES "marker" scenarios are representative of the full set of forty SRES scenarios.[27] For the lowest emissions SRES marker scenario ("B1" - see the SRES article for details on this scenario), the best estimate for global mean temperature is an increase of 1.8 °C (3.2 °F)[26] by the end of the 21st century. This projection is relative to global temperatures at the end of the 20th century.[28] The "likely" range (greater than 66% probability, based on expert judgement)[29] for the SRES B1 marker scenario is 1.1–2.9 °C (2.0–5.2 °F).[26] For the highest emissions SRES marker scenario (A1FI), the best estimate for global mean temperature increase is 4.0 °C (7.2 °F), with a "likely" range of 2.4–6.4 °C (4.3–11.5 °F).[26]
The range in temperature projections partly reflects (1) the choice of emissions scenario, and (2) the "climate sensitivity".[23]:22–24 For (1), different scenarios make different assumptions of future social and economic development (e.g., economic growth, population level, energy policies), which in turn affects projections of greenhouse gas (GHG) emissions.[23]:22–24 The projected magnitude of warming by 2100 is closely related to the level of cumulative emissions over the 21st century (i.e. total emissions between 2000-2100).[30] The higher the cumulative emissions over this time period, the greater the level of warming is projected to occur.[30]
(2) reflects uncertainty in the response of the climate system to past and future GHG emissions, which is measured by the climate sensitivity).[23]:22–24 Higher estimates of climate sensitivity lead to greater projected warming, while lower estimates of climate sensitivity lead to less projected warming.[31]
Over the next several millennia, projections suggest that global warming could be irreversible.[32] Even if emissions were drastically reduced, global temperatures would remain close to their highest level for at least 1,000 years (see the later section on irreversibilities).[33][34]
Projected warming in context
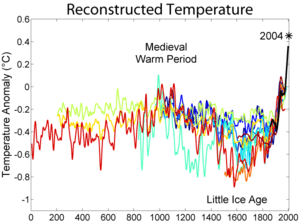 Two millennia of mean surface temperatures according to different reconstructions from climate proxies, each smoothed on a decadal scale, with the instrumental temperature record overlaid in black. |
.png)
Scientists have used various "proxy" data to assess past changes in Earth's climate (paleoclimate).[36] Sources of proxy data include historical records (such as farmers' logs), tree rings, corals, fossil pollen, ice cores, and ocean and lake sediments.[36] Analysis of these data suggest that recent warming is unusual in the past 400 years, possibly longer.[37] By the end of the 21st century, temperatures may increase to a level not experienced since the mid-Pliocene, around 3 million years ago.[38] At that time, models suggest that mean global temperatures were about 2–3 °C warmer than pre-industrial temperatures.[38] Even a 2 °C rise above the pre-industrial level would be outside the range of temperatures experienced by human civilization.[35][39]
Physical impacts
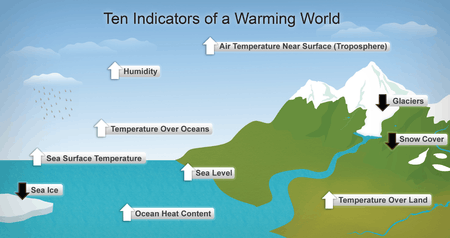 Seven of these indicators would be expected to increase in a warming world and observations show that they are, in fact, increasing. Three would be expected to decrease and they are, in fact, decreasing.[40] |
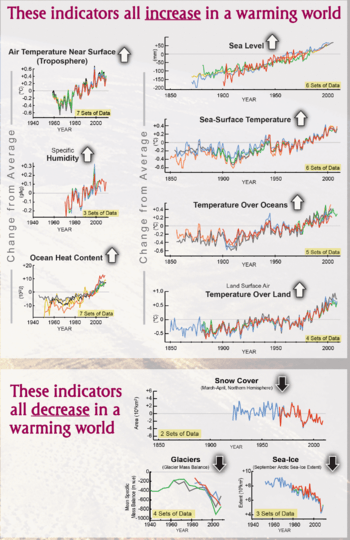
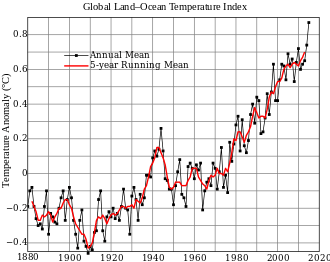
A broad range of evidence shows that the climate system has warmed.[42] Evidence of global warming is shown in the graphs opposite. Some of the graphs show a positive trend, e.g., increasing temperature over land and the ocean, and sea level rise. Other graphs show a negative trend, e.g., decreased snow cover in the Northern Hemisphere, and declining Arctic sea ice extent. Evidence of warming is also apparent in living (biological) systems.[43]
Human activities have contributed to a number of the observed changes in climate.[44] This contribution has principally been through the burning of fossil fuels, which has led to an increase in the concentration of GHGs in the atmosphere.[45] Another human influence on the climate are sulfur dioxide emissions, which are a precursor to the formation of sulfate aerosols in the atmosphere.[46]
Human-induced warming could lead to large-scale, irreversible, and/or abrupt changes in physical systems.[47][48] An example of this is the melting of ice sheets, which contributes to sea level rise.[49] The probability of warming having unforeseen consequences increases with the rate, magnitude, and duration of climate change.[50]
Effects on weather
Observations show that there have been changes in weather.[51] As climate changes, the probabilities of certain types of weather events are affected.
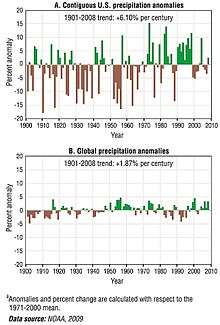
Changes have been observed in the amount, intensity, frequency, and type of precipitation.[23]:18 Widespread increases in heavy precipitation have occurred, even in places where total rain amounts have decreased. With medium confidence (see footnote 1), IPCC (2012)[54] concluded that human influences had contributed to an increase in heavy precipitation events at the global scale.
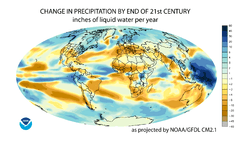
Projections of future changes in precipitation show overall increases in the global average, but with substantial shifts in where and how precipitation falls.[23]:24 Projections suggest a reduction in rainfall in the subtropics, and an increase in precipitation in subpolar latitudes and some equatorial regions.[53] In other words, regions which are dry at present will in general become even drier, while regions that are currently wet will in general become even wetter.[53] This projection does not apply to every locale, and in some cases can be modified by local conditions.[53]
Extreme weather
Over most land areas since the 1950s, it is very likely that there have been fewer or warmer cold days and nights.[55] Hot days and nights have also very likely become warmer or more frequent.[55] Human activities have very likely contributed to these trends.[55] There may have been changes in other climate extremes (e.g., floods, droughts and tropical cyclones) but these changes are more difficult to identify.[55]
Projections suggest changes in the frequency and intensity of some extreme weather events.[55] Confidence in projections varies over time.[55]
- Near-term projections (2016–2035)
Some changes (e.g., more frequent hot days) will probably be evident in the near term, while other near-term changes (e.g., more intense droughts and tropical cyclones) are more uncertain.[55]
- Long-term projections (2081–2100)
Future climate change will be associated with more very hot days and fewer very cold days.[55] The frequency, length and intensity of heat waves will very likely increase over most land areas.[55] Higher growth in anthropogenic GHG emissions will be associated with larger increases in the frequency and severity of temperature extremes.[56]
Assuming high growth in GHG emissions (IPCC scenario RCP8.5), presently dry regions may be affected by an increase in the risk of drought and reductions in soil moisture.[57] Over most of the mid-latitude land masses and wet tropical regions, extreme precipitation events will very likely become more intense and frequent.[55]
- Tropical cyclones
At the global scale, the frequency of tropical cyclones will probably decrease or be unchanged.[58] Global mean tropical cyclone maximum wind speed and precipitation rates will likely increase.[58] Changes in tropical cyclones will probably vary by region, but these variations are uncertain.[58]
- Effects of climate extremes
The impacts of extreme events on the environment and human society will vary. Some impacts will be beneficial—e.g., fewer cold extremes will probably lead to fewer cold deaths.[59] Overall, however, impacts will probably be mostly negative.[60][61]
Cryosphere
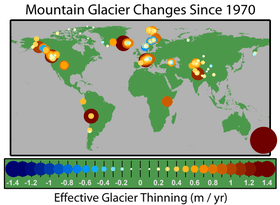
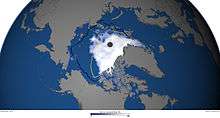
The cryosphere is made up of areas of the Earth which are covered by snow or ice.[62] Observed changes in the cryosphere include declines in Arctic sea ice extent,[63] the widespread retreat of alpine glaciers,[64] and reduced snow cover in the Northern Hemisphere.[65]
Solomon et al. (2007)[66] assessed the potential impacts of climate change on summertime Arctic sea ice extent. Assuming high growth in greenhouse gas emissions (SRES A2), some models projected that Arctic sea ice in the summer could largely disappear by the end of the 21st century.[66] More recent projections suggest that the Arctic summers could be ice-free (defined as ice extent less than 1 million square km) as early as 2025-2030.[67]
During the 21st century, glaciers[68] and snow cover are projected to continue their widespread retreat.[69] In the western mountains of North America, increasing temperatures and changes in precipitation are projected to lead to reduced snowpack.[70] Snowpack is the seasonal accumulation of slow-melting snow.[71] The melting of the Greenland and West Antarctic ice sheets could contribute to sea level rise, especially over long time-scales (see the section on Greenland and West Antarctic Ice sheets).[49]
Changes in the cryosphere are projected to have social impacts.[72] For example, in some regions, glacier retreat could increase the risk of reductions in seasonal water availability.[73] Barnett et al. (2005)[74] estimated that more than one-sixth of the world's population rely on glaciers and snowpack for their water supply.
Oceans
The role of the oceans in global warming is complex. The oceans serve as a sink for carbon dioxide, taking up much that would otherwise remain in the atmosphere, but increased levels of CO
2 have led to ocean acidification. Furthermore, as the temperature of the oceans increases, they become less able to absorb excess CO
2. The ocean have also acted as a sink in absorbing extra heat from the atmosphere.[75]:4 The increase in ocean heat content is much larger than any other store of energy in the Earth’s heat balance over the two periods 1961 to 2003 and 1993 to 2003, and accounts for more than 90% of the possible increase in heat content of the Earth system during these periods.[76]
Global warming is projected to have a number of effects on the oceans. Ongoing effects include rising sea levels due to thermal expansion and melting of glaciers and ice sheets, and warming of the ocean surface, leading to increased temperature stratification. Other possible effects include large-scale changes in ocean circulation.
Acidification
.png)
About one-third of the carbon dioxide emitted by human activity has already been taken up by the oceans.[78] As carbon dioxide dissolves in sea water, carbonic acid is formed, which has the effect of acidifying the ocean, measured as a change in pH. The uptake of human carbon emissions since the year 1750 has led to an average decrease in pH of 0.1 units.[79] Projections using the SRES emissions scenarios suggest a further reduction in average global surface ocean pH of between 0.14 and 0.35 units over the 21st century.
The effects of ocean acidification on the marine biosphere have yet to be documented.[79] Laboratory experiments suggest beneficial effects for a few species, with potentially highly detrimental effects for a substantial number of species.[78] With medium confidence, Fischlin et al. (2007)[80] projected that future ocean acidification and climate change would impair a wide range of planktonic and shallow benthic marine organisms that use aragonite to make their shells or skeletons, such as corals and marine snails (pteropods), with significant impacts particularly in the Southern Ocean.
Oxygen depletion
The amount of oxygen dissolved in the oceans may decline, with adverse consequences for ocean life.[81][82]
Sea level rise
.png)
There is strong evidence that global sea level rose gradually over the 20th century.[84] With high confidence, Bindoff et al. (2007)[85] concluded that between the mid-19th and mid-20th centuries, the rate of sea level rise increased. Authors of the IPCC Fourth Assessment Synthesis Report (IPCC AR4 SYR, 2007)[21] reported that between the years 1961 and 2003, global average sea level rose at an average rate of 1.8 mm per year (mm/yr), with a range of 1.3–2.3 mm/yr. Between 1993 and 2003, the rate increased above the previous period to 3.1 mm/yr (range of 2.4–3.8 mm/yr). Authors of IPCC AR4 SYR (2007)[21] were uncertain whether the increase in rate from 1993 to 2003 was due to natural variations in sea level over the time period, or whether it reflected an increase in the underlying long-term trend.
There are two main factors that have contributed to observed sea level rise.[84] The first is thermal expansion: as ocean water warms, it expands.[86] The second is from the contribution of land-based ice due to increased melting. The major store of water on land is found in glaciers and ice sheets. Anthropogenic forces very likely (greater than 90% probability, based on expert judgement)[29] contributed to sea level rise during the latter half of the 20th century.[44]
There is a widespread consensus that substantial long-term sea level rise will continue for centuries to come.[87] In their Fourth Assessment Report, the IPCC[88] projected sea level rise to the end of the 21st century using the SRES emissions scenarios. Across the six SRES marker scenarios, sea level was projected to rise by 18 to 59 cm (7.1 to 23.2 in), relative to sea level at the end of the 20th century.[89] Thermal expansion is the largest component in these projections, contributing 70-75% of the central estimate for all scenarios.[90] Due to a lack of scientific understanding, this sea level rise estimate does not include all of the possible contributions of ice sheets (see the section on Greenland and West Antarctic Ice sheets).
An assessment of the scientific literature on climate change was published in 2010 by the US National Research Council (US NRC, 2010).[91] NRC (2010)[91] described the projections in AR4 (i.e. those cited in the above paragraph) as "conservative", and summarized the results of more recent studies. Cited studies suggested a great deal of uncertainty in projections.[91] A range of projections suggested possible sea level rise by the end of the 21st century of between 0.56 and 2 m, relative to sea levels at the end of the 20th century.[91]
Ocean temperature rise
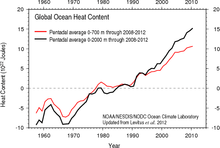
From 1961 to 2003, the global ocean temperature has risen by 0.10 °C from the surface to a depth of 700 m. There is variability both year-to-year and over longer time scales, with global ocean heat content observations showing high rates of warming for 1991–2003, but some cooling from 2003 to 2007.[92] The temperature of the Antarctic Southern Ocean rose by 0.17 °C (0.31 °F) between the 1950s and the 1980s, nearly twice the rate for the world's oceans as a whole.[93] As well as having effects on ecosystems (e.g. by melting sea ice, affecting algae that grow on its underside), warming reduces the ocean's ability to absorb CO
2. It is likely (greater than 66% probability, based on expert judgement)[29] that anthropogenic forcing contributed to the general warming observed in the upper several hundred metres of the ocean during the latter half of the 20th century.[44]
Regions
_and_the_1980s_(right)%2C_as_compared_to_average_temperatures_from_1951_to_1980_(US_EPA).jpg)
.jpg)
Regional effects of global warming vary in nature. Some are the result of a generalised global change, such as rising temperature, resulting in local effects, such as melting ice. In other cases, a change may be related to a change in a particular ocean current or weather system. In such cases, the regional effect may be disproportionate and will not necessarily follow the global trend.
There are three major ways in which global warming will make changes to regional climate: melting or forming ice, changing the hydrological cycle (of evaporation and precipitation) and changing currents in the oceans and air flows in the atmosphere. The coast can also be considered a region, and will suffer severe impacts from sea level rise.
Observed impacts
With very high confidence, Rosenzweig et al. (2007)[43] concluded that physical and biological systems on all continents and in most oceans had been affected by recent climate changes, particularly regional temperature increases. Impacts include earlier leafing of trees and plants over many regions; movements of species to higher latitudes and altitudes in the Northern Hemisphere; changes in bird migrations in Europe, North America and Australia; and shifting of the oceans' plankton and fish from cold- to warm-adapted communities.[95]
The human influence on the climate can be seen in the geographical pattern of observed warming, with greater temperature increases over land and in polar regions rather than over the oceans.[96]:6 Using models, it is possible to identify the human "signal" of global warming over both land and ocean areas.[96]:6
Projected impacts
Projections of future climate changes at the regional scale do not hold as high a level of scientific confidence as projections made at the global scale.[96]:9 It is, however, expected that future warming will follow a similar geographical pattern to that seen already, with greatest warming over land and high northern latitudes, and least over the Southern Ocean and parts of the North Atlantic Ocean.[97] Nearly all land areas will very likely warm more than the global average.[98]
The Arctic, Africa, small islands and Asian megadeltas are regions that are likely to be especially affected by climate change.[99] Low-latitude, less-developed areas are at most risk of experiencing negative impacts due to climate change.[100] Developed countries are also vulnerable to climate change.[101] For example, developed countries will be negatively affected by increases in the severity and frequency of some extreme weather events, such as heat waves.[101] In all regions, some people can be particularly at risk from climate change, such as the poor, young children and the elderly.[99][100][102]
Social systems
The impacts of climate change can be thought of in terms of sensitivity and vulnerability. "Sensitivity" is the degree to which a particular system or sector might be affected, positively or negatively, by climate change and/or climate variability. "Vulnerability" is the degree to which a particular system or sector might be adversely affected by climate change.[103]
The sensitivity of human society to climate change varies. Sectors sensitive to climate change include water resources, coastal zones, human settlements, and human health. Industries sensitive to climate change include agriculture, fisheries, forestry, energy, construction, insurance, financial services, tourism, and recreation.[104][105]
Food supply
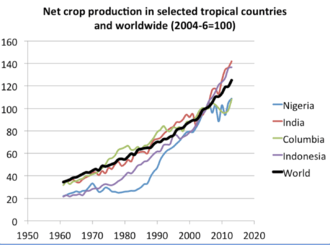
Climate change will impact agriculture and food production around the world due to: the effects of elevated CO2 in the atmosphere, higher temperatures, altered precipitation and transpiration regimes, increased frequency of extreme events, and modified weed, pest, and pathogen pressure.[106] In general, low-latitude areas are at most risk of having decreased crop yields.[107]
As of 2007, the effects of regional climate change on agriculture have been small.[43] Changes in crop phenology provide important evidence of the response to recent regional climate change.[108] Phenology is the study of natural phenomena that recur periodically, and how these phenomena relate to climate and seasonal changes.[109] A significant advance in phenology has been observed for agriculture and forestry in large parts of the Northern Hemisphere.[43]
Projections
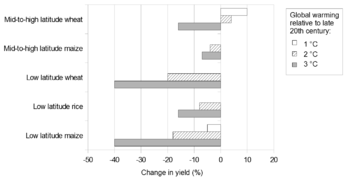
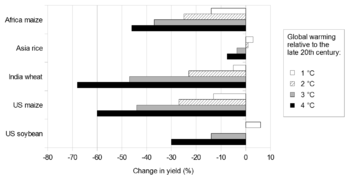
With low to medium confidence, Schneider et al. (2007)[20] projected that for about a 1 to 3 °C increase in global mean temperature (by the years 2090-2100, relative to average temperatures in the years 1990–2000), there would be productivity decreases for some cereals in low latitudes, and productivity increases in high latitudes. With medium confidence, global production potential was projected to:[20]
- increase up to around 3 °C,
- very likely decrease above about 3 °C.
Most of the studies on global agriculture assessed by Schneider et al. (2007)[107] had not incorporated a number of critical factors, including changes in extreme events, or the spread of pests and diseases. Studies had also not considered the development of specific practices or technologies to aid adaptation to climate change.[107]
The graphs opposite show the projected effects of climate change on selected crop yields.[111] Actual changes in yields may be above or below these central estimates.[111]
The projections above can be expressed relative to pre-industrial (1750) temperatures.[112] 0.6 °C of warming is estimated to have occurred between 1750 and 1990-2000. Add 0.6 °C to the above projections to convert them from a 1990-2000 to pre-industrial baseline.
Food security
Easterling et al. (2007)[113] assessed studies that made quantitative projections of climate change impacts on food security. It was noted that these projections were highly uncertain and had limitations. However, the assessed studies suggested a number of fairly robust findings. The first was that climate change would likely increase the number of people at risk of hunger compared with reference scenarios with no climate change. Climate change impacts depended strongly on projected future social and economic development. Additionally, the magnitude of climate change impacts was projected to be smaller compared to the impact of social and economic development. In 2006, the global estimate for the number of people undernourished was 820 million.[114] Under the SRES A1, B1, and B2 scenarios (see the SRES article for information on each scenario group), projections for the year 2080 showed a reduction in the number of people undernourished of about 560-700 million people, with a global total of undernourished people of 100-240 million in 2080. By contrast, the SRES A2 scenario showed only a small decrease in the risk of hunger from 2006 levels. The smaller reduction under A2 was attributed to the higher projected future population level in this scenario.
Droughts and agriculture
Some evidence suggests that droughts have been occurring more frequently because of global warming and they are expected to become more frequent and intense in Africa, southern Europe, the Middle East, most of the Americas, Australia, and Southeast Asia.[115] However, other research suggests that there has been little change in drought over the past 60 years.[116] Their impacts are aggravated because of increased water demand, population growth, urban expansion, and environmental protection efforts in many areas.[117] Droughts result in crop failures and the loss of pasture grazing land for livestock.[118]
Health
Human beings are exposed to climate change through changing weather patterns (temperature, precipitation, sea-level rise and more frequent extreme events) and indirectly through changes in water, air and food quality and changes in ecosystems, agriculture, industry and settlements and the economy (Confalonieri et al., 2007:393).[59] According to an assessment of the scientific literature by Confalonieri et al. (2007:393),[59] the effects of climate change to date have been small, but are projected to progressively increase in all countries and regions.
A study by the World Health Organization (WHO, 2009)[119] estimated the effect of climate change on human health. Not all of the effects of climate change were included in their estimates, for example, the effects of more frequent and extreme storms were excluded. Climate change was estimated to have been responsible for 3% of diarrhoea, 3% of malaria, and 3.8% of dengue fever deaths worldwide in 2004. Total attributable mortality was about 0.2% of deaths in 2004; of these, 85% were child deaths.
Projections
With high confidence, authors of the IPCC AR4 Synthesis report[120]:48 projected that climate change would bring some benefits in temperate areas, such as fewer deaths from cold exposure, and some mixed effects such as changes in range and transmission potential of malaria in Africa. Benefits were projected to be outweighed by negative health effects of rising temperatures, especially in developing countries.
With very high confidence, Confalonieri et al. (2007)[59]:393 concluded that economic development was an important component of possible adaptation to climate change. Economic growth on its own, however, was not judged to be sufficient to insulate the world's population from disease and injury due to climate change. Future vulnerability to climate change will depend not only on the extent of social and economic change, but also on how the benefits and costs of change are distributed in society.[121] For example, in the 19th century, rapid urbanization in western Europe lead to a plummeting in population health.[121] Other factors important in determining the health of populations include education, the availability of health services, and public-health infrastructure.[59]:393
Water resources
A number of climate-related trends have been observed that affect water resources. These include changes in precipitation, the crysosphere and surface waters (e.g., changes in river flows).[122] Observed and projected impacts of climate change on freshwater systems and their management are mainly due to changes in temperature, sea level and precipitation variability.[123] Sea level rise will extend areas of salinization of groundwater and estuaries, resulting in a decrease in freshwater availability for humans and ecosystems in coastal areas. In an assessment of the scientific literature, Kundzewicz et al. (2007)[123] concluded, with high confidence, that:
- the negative impacts of climate change on freshwater systems outweigh the benefits. All of the regions assessed in the IPCC Fourth Assessment Report (Africa, Asia, Australia and New Zealand, Europe, Latin America, North America, Polar regions (Arctic and Antarctic), and small islands) showed an overall net negative impact of climate change on water resources and freshwater ecosystems.
- Semi-arid and arid areas are particularly exposed to the impacts of climate change on freshwater. With very high confidence, it was judged that many of these areas, e.g., the Mediterranean basin, Western United States, Southern Africa, and north-eastern Brazil, would suffer a decrease in water resources due to climate change.
Migration and conflict
General circulation models project that the future climate change will bring wetter coasts, drier mid-continent areas, and further sea level rise.[124] Such changes could result in the gravest effects of climate change through human migration.[125] Millions might be displaced by shoreline erosions, river and coastal flooding, or severe drought.
Migration related to climate change is likely to be predominantly from rural areas in developing countries to towns and cities.[124]:407[126] In the short term climate stress is likely to add incrementally to existing migration patterns rather than generating entirely new flows of people.[126]:110
It has been argued that environmental degradation, loss of access to resources (e.g., water resources),[127] and resulting human migration could become a source of political and even military conflict.[128] Factors other than climate change may, however, be more important in affecting conflict. For example, Wilbanks et al. (2007)[129] suggested that major environmentally influenced conflicts in Africa were more to do with the relative abundance of resources, e.g., oil and diamonds, than with resource scarcity. Scott et al. (2001) placed only low confidence in predictions of increased conflict due to climate change.[128]
A 2013 study found that significant climatic changes were associated with a higher risk of conflict worldwide, and predicted that "amplified rates of human conflict could represent a large and critical social impact of anthropogenic climate change in both low- and high-income countries."[130] Similarly, a 2014 study found that higher temperatures were associated with a greater likelihood of violent crime, and predicted that global warming would cause millions of such crimes in the United States alone during the 21st century.[131]
Military planners are concerned that global warming is a "threat multiplier". "Whether it is poverty, food and water scarcity, diseases, economic instability, or threat of natural disasters, the broad range of changing climatic conditions may be far reaching. These challenges may threaten stability in much of the world".[132]
Aggregate impacts
Aggregating impacts adds up the total impact of climate change across sectors and/or regions.[133] Examples of aggregate measures include economic cost (e.g., changes in gross domestic product (GDP) and the social cost of carbon), changes in ecosystems (e.g., changes over land area from one type of vegetation to another),[134] human health impacts, and the number of people affected by climate change.[135] Aggregate measures such as economic cost require researchers to make value judgements over the importance of impacts occurring in different regions and at different times.
Observed impacts
Global losses reveal rapidly rising costs due to extreme weather-related events since the 1970s.[136] Socio-economic factors have contributed to the observed trend of global losses, e.g., population growth, increased wealth.[137] Part of the growth is also related to regional climatic factors, e.g., changes in precipitation and flooding events. It is difficult to quantify the relative impact of socio-economic factors and climate change on the observed trend.[137] The trend does, however, suggest increasing vulnerability of social systems to climate change.[137][138]
Projected impacts
The total economic impacts from climate change are highly uncertain.[139] With medium confidence, Smith et al. (2001)[140] concluded that world GDP would change by plus or minus a few percent for a small increase in global mean temperature (up to around 2 °C relative to the 1990 temperature level). Most studies assessed by Smith et al. (2001)[140] projected losses in world GDP for a medium increase in global mean temperature (above 2-3 °C relative to the 1990 temperature level), with increasing losses for greater temperature increases. This assessment is consistent with the findings of more recent studies, as reviewed by Hitz and Smith (2004).[141]
Economic impacts are expected to vary regionally.[141][142] For a medium increase in global mean temperature (2-3 °C of warming, relative to the average temperature between 1990–2000), market sectors in low-latitude and less-developed areas might experience net costs due to climate change.[20] On the other hand, market sectors in high-latitude and developed regions might experience net benefits for this level of warming. A global mean temperature increase above about 2-3 °C (relative to 1990-2000) would very likely result in market sectors across all regions experiencing either declines in net benefits or rises in net costs.[49]
Aggregate impacts have also been quantified in non-economic terms. For example, climate change over the 21st century is likely to adversely affect hundreds of millions of people through increased coastal flooding, reductions in water supplies, increased malnutrition and increased health impacts.[61]
Biological systems
Observed impacts on biological systems
.png)
With very high confidence, Rosenzweig et al. (2007) concluded that recent warming had strongly affected natural biological systems.[43] Hundreds of studies have documented responses of ecosystems, plants, and animals to the climate changes that have already occurred.[143] For example, in the Northern Hemisphere, species are almost uniformly moving their ranges northward and up in elevation in search of cooler temperatures.[144] Humans are very likely causing changes in regional temperatures to which plants and animals are responding.[144]
Projected impacts on biological systems
By the year 2100, ecosystems will be exposed to atmospheric CO
2 levels substantially higher than in the past 650,000 years, and global temperatures at least among the highest of those experienced in the past 740,000 years.[145] Significant disruptions of ecosystems are projected to increase with future climate change.[146] Examples of disruptions include disturbances such as fire, drought, pest infestation, invasion of species, storms, and coral bleaching events. The stresses caused by climate change, added to other stresses on ecological systems (e.g., land conversion, land degradation, harvesting, and pollution), threaten substantial damage to or complete loss of some unique ecosystems, and extinction of some critically endangered species.[146][147]
Climate change has been estimated to be a major driver of biodiversity loss in cool conifer forests, savannas, mediterranean-climate systems, tropical forests, in the Arctic tundra, and in coral reefs.[148] In other ecosystems, land-use change may be a stronger driver of biodiversity loss at least in the near-term.[148] Beyond the year 2050, climate change may be the major driver for biodiversity loss globally.[148]
A literature assessment by Fischlin et al. (2007)[145] included a quantitative estimate of the number of species at increased risk of extinction due to climate change. With medium confidence, it was projected that approximately 20 to 30% of plant and animal species assessed so far (in an unbiased sample) would likely be at increasingly high risk of extinction should global mean temperatures exceed a warming of 2 to 3 °C above pre-industrial temperature levels.[145] The uncertainties in this estimate, however, are large: for a rise of about 2 °C the percentage may be as low as 10%, or for about 3 °C, as high as 40%, and depending on biota (all living organisms of an area, the flora and fauna considered as a unit)[149] the range is between 1% and 80%.[148] As global average temperature exceeds 4 °C above pre-industrial levels, model projections suggested that there could be significant extinctions (40-70% of species that were assessed) around the globe.[148]
Assessing whether future changes in ecosystems will be beneficial or detrimental is largely based on how ecosystems are valued by human society.[150] For increases in global average temperature exceeding 1.5 to 2.5 °C (relative to global temperatures over the years 1980-1999)[151] and in concomitant atmospheric CO
2 concentrations, projected changes in ecosystems will have predominantly negative consequences for biodiversity and ecosystems goods and services, e.g., water and food supply.[152]
Abrupt or irreversible changes
Physical, ecological and social systems may respond in an abrupt, non-linear or irregular way to climate change.[153] This is as opposed to a smooth or regular response. A quantitative entity behaves "irregularly" when its dynamics are discontinuous (i.e., not smooth), nondifferentiable, unbounded, wildly varying, or otherwise ill-defined.[153] Such behaviour is often termed "singular". Irregular behaviour in Earth systems may give rise to certain thresholds, which, when crossed, may lead to a large change in the system.
Some singularities could potentially lead to severe impacts at regional or global scales.[154] Examples of "large-scale" singularities are discussed in the articles on abrupt climate change, climate change feedback and runaway climate change. It is possible that human-induced climate change could trigger large-scale singularities, but the probabilities of triggering such events are, for the most part,[155] poorly understood.[154]
With low to medium confidence, Smith et al. (2001)[153] concluded that a rapid warming of more than 3 °C above 1990 levels would exceed thresholds that would lead to large-scale discontinuities in the climate system. Since the assessment by Smith et al. (2001), improved scientific understanding provides more guidance for two large-scale singularities: the role of carbon cycle feedbacks in future climate change (discussed below in the section on biogeochemical cycles) and the melting of the Greenland and West Antarctic ice sheets.[141]
Biogeochemical cycles
Climate change may have an effect on the carbon cycle in an interactive "feedback" process. A feedback exists where an initial process triggers changes in a second process that in turn influences the initial process. A positive feedback intensifies the original process, and a negative feedback reduces it.[120]:78 Models suggest that the interaction of the climate system and the carbon cycle is one where the feedback effect is positive.[156]:792
Using the A2 SRES emissions scenario, Schneider et al. (2007)[156]:789 found that this effect led to additional warming by the years 2090-2100 (relative to the 1990–2000) of 0.1–1.5 °C. This estimate was made with high confidence. The climate projections made in the IPCC Fourth Assessment Report summarized earlier of 1.1–6.4 °C account for this feedback effect. On the other hand, with medium confidence, Schneider et al. (2007)[156]:789 commented that additional releases of GHGs were possible from permafrost, peat lands, wetlands, and large stores of marine hydrates at high latitudes.
Greenland and West Antarctic Ice sheets
With medium confidence, authors of AR4[49] concluded that with a global average temperature increase of 1–4 °C (relative to temperatures over the years 1990–2000), at least a partial deglaciation of the Greenland ice sheet, and possibly the West Antarctic ice sheets would occur. The estimated timescale for partial deglaciation was centuries to millennia, and would contribute 4 to 6 metres (13 to 20 ft) or more to sea level rise over this period.
Atlantic Meridional Overturning Circulation
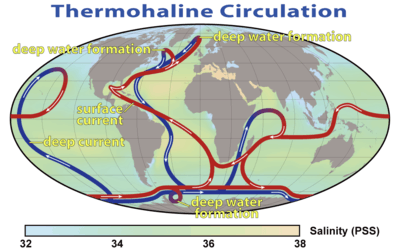
The Atlantic Meridional Overturning Circulation (AMOC) is an important component of the Earth's climate system, characterized by a northward flow of warm, salty water in the upper layers of the Atlantic and a southward flow of colder water in the deep Atlantic.[158]:5 The AMOC is equivalently known as the thermohaline circulation (THC).[141] Potential impacts associated with MOC changes include reduced warming or (in the case of abrupt change) absolute cooling of northern high-latitude areas near Greenland and north-western Europe, an increased warming of Southern Hemisphere high-latitudes, tropical drying, as well as changes to marine ecosystems, terrestrial vegetation, oceanic CO
2 uptake, oceanic oxygen concentrations, and shifts in fisheries.[159] According to an assessment by the US Climate Change Science Program (CCSP, 2008b),[158]:5 it is very likely (greater than 90% probability, based on expert judgement)[158]:12 that the strength of the AMOC will decrease over the course of the 21st century. Warming is still expected to occur over most of the European region downstream of the North Atlantic Current in response to increasing GHGs, as well as over North America. Although it is very unlikely (less than 10% probability, based on expert judgement)[158]:12 that the AMOC will collapse in the 21st century, the potential consequences of such a collapse could be severe.[158]:5
Irreversibilities
Commitment to radiative forcing
Emissions of GHGs are a potentially irreversible commitment to sustained radiative forcing in the future.[160] The contribution of a GHG to radiative forcing depends on the gas's ability to trap infrared (heat) radiation, the concentration of the gas in the atmosphere, and the length of time the gas resides in the atmosphere.[160]
CO
2 is the most important anthropogenic GHG.[161] While more than half of the CO
2 emitted is currently removed from the atmosphere within a century, some fraction (about 20%) of emitted CO
2 remains in the atmosphere for many thousands of years.[162] Consequently, CO
2 emitted today is potentially an irreversible commitment to sustained radiative forcing over thousands of years.
This commitment may not be truly irreversible should techniques be developed to remove CO
2 or other GHGs directly from the atmosphere, or to block sunlight to induce cooling.[32] Techniques of this sort are referred to as geoengineering. Little is known about the effectiveness, costs or potential side-effects of geoengineering options.[163] Some geoengineering options, such as blocking sunlight, would not prevent further ocean acidification.[163]
Irreversible impacts
Human-induced climate change may lead to irreversible impacts on physical, biological, and social systems.[164] There are a number of examples of climate change impacts that may be irreversible, at least over the timescale of many human generations.[165] These include the large-scale singularities described above – changes in carbon cycle feedbacks, the melting of the Greenland and West Antarctic ice sheets, and changes to the AMOC.[165] In biological systems, the extinction of species would be an irreversible impact.[165] In social systems, unique cultures may be lost due to climate change.[165] For example, humans living on atoll islands face risks due to sea-level rise, sea-surface warming, and increased frequency and intensity of extreme weather events.[166]
Benefits of global warming
In some locations and industries global warming may increase productivity, though the IPCC cautions that "Estimates agree on the size of the impact (small relative to economic growth), and 17 of the 20 impact estimates shown in Figure 10-1 are negative. Losses accelerate with greater warming, and estimates diverge."[167] The identified benefits are listed below.
CO2 fertilisation effect
CO2 is one of the substances which plants require to grow. Increasing its amount in the air contributes to:
- Improved agriculture in some high latitude regions [168]
- Increased growing season in Greenland [169]
- Increased productivity of sour orange trees [170]
- Increased vegetation activity in high northern latitudes [171]
- Increased plankton biomass in the North Pacific Subtropical Gyre [172]
- Recent increase in forest growth [173]
- Increased Arctic tundra plant reproduction [174]
Human health
- Winter deaths might decline as temperatures warm. However, this is disputed for at least some regions. For example [175] states "Although excess winter deaths evidently do exist, winter cold severity no longer predicts the numbers affected. We conclude that no evidence exists that excess winter deaths in England and Wales will fall if winters warm with climate change."
Ice-free Northwest Passage
- Ships will travel on a shorter route between the Pacific and Atlantic oceans [176]
Animal population changes
Some animals will benefit from the warming:
Scientific opinion
The Intergovernmental Panel on Climate Change (IPCC) has published several major assessments on the effects of global warming.[179] Its most recent comprehensive impact assessment was published in 2014.[180] Publications describing the effects of climate change have also been produced by the following organizations:
- American Association for the Advancement of Science (AAAS)[181]
- A report by the Netherlands Environmental Assessment Agency, the Royal Netherlands Meteorological Institute, and Wageningen University and Research Centre[182]
- UK AVOID research programme[183]
- A report by the UK Royal Society and US National Academy of Sciences[184]
- University of New South Wales Climate Change Research Centre[185]
- US National Research Council[186][187]
A report by Molina et al. (no date)[188] states:
The overwhelming evidence of human-caused climate change documents both current impacts with significant costs and extraordinary future risks to society and natural systems
NASA data and tools
NASA has released public data and tools to predict how temperature and rainfall patterns worldwide may change through to the year 2100 caused by increasing carbon dioxide in Earth’s atmosphere. The dataset shows projected changes worldwide on a regional level simulated by 21 climate models. The data can be viewed on a daily timescale for individual cities and towns and may be used to conduct climate risk assessments to predict the local and global effects of weather dangers, for example droughts, floods, heat waves and declines in agriculture productivity, and help plan responses to global warming effects.[189]
See also
Footnotes
1 The TAR[190] and AR4[29] that are referred to in this article use specific and quantitative language to describe uncertainty. This language is intended to provide an indication of the level of confidence that IPCC authors have about a particular finding. The qualitative language used to describe uncertainty has a quantitative scale associated with it. The quantitative values for qualitative terms are intended to ensure that confidence levels are interpreted correctly. The is because qualitative statements, e.g., using the word "likely", can be interpreted differently in quantitative terms.[191]:44
Confidence levels used in the TAR:[192]
- Very High = 95% or greater
- High = 67-95%
- Medium = 33-67%
- Low = 5-33%
- Very Low = 5% or less
Confidence statements made in AR4 are listed below:[29]
- Very high confidence: At least 9 out of 10 chance of being correct
- High confidence: About 8 out of 10 chance " " "
- Medium confidence: About 5 out of 10 chance " " "
- Low confidence: About 2 out of 10 chance " " "
- Very low confidence: Less than a 1 out of 10 chance " " "
IPCC (2012)[193] uses the following terms: "very low", "low", "medium", "high", and "very high confidence". Unlike the TAR and AR4, the scale is qualitative rather than quantitative.
The quantitative values used by IPCC authors are "subjective" probabilities,[29][190][194] also known as "personalist" or "Bayesian" probabilities,[195] and reflect the expert judgement of IPCC authors. In this formulation, probability is not only a function of an event, but also the state of information that is available to the person making the assessment.[195] In this framework, assigned probabilities may change as more or different information becomes available.[195]
The IPCC also uses another scale to describe the likelihood of a particular event occurring.[29] This is different from the confidence scales described above, and it is possible to assign confidence values to statements of likelihood. For example, the judgement that an event is improbable (e.g., rolling a dice twice and getting a six both times) may be assigned a high level of scientific confidence.[29] Also, the probability that an event has an even chance of occurring (e.g., a tossed coin coming up heads) may also be assigned a high level of confidence.[29]
Notes
- ↑ Joint-statement by leaders of 18 scientific organizations: American Association for the Advancement of Science, American Chemical Society, American Geophysical Union, American Institute of Biological Sciences, American Meteorological Society, American Society of Agronomy, American Society of Plant Biologists, American Statistical Association, Association of Ecosystem Research Centers, Botanical Society of America, Crop Science Society of America, Ecological Society of America, Natural Science Collections, Alliance Organization of Biological Field Stations, Society for Industrial and Applied Mathematics, Society of Systematic Biologists, Soil Science Society of America, University Corporation for Atmospheric Research (October 21, 2009), Joint-statement on climate change by leaders of 18 scientific organizations (PDF), Washington DC, USA: American Association for the Advancement of Science. Archived 14 July 2014.
- 1 2 3 Cramer, W., et al., Executive summary, in: Chapter 18: Detection and attribution of observed impacts (archived 18 October 2014), pp.982-984, in IPCC AR5 WG2 A 2014
- ↑ Settele, J., et al., Section 4.3.2.1: Phenology, in: Chapter 4: Terrestrial and inland water systems (archived 20 October 2014), p.291, in IPCC AR5 WG2 A 2014
- 1 2 Oppenheimer, M., et al., Section 19.7.1: Relationship between Adaptation Efforts, Mitigation Efforts, and Residual Impacts, in: Chapter 19: Emergent risks and key vulnerabilities (archived 20 October 2014), pp.1080-1085, in IPCC AR5 WG2 A 2014
- ↑ Oppenheimer, M., et al., Section 19.6.2.2. The Role of Adaptation and Alternative Development Pathways, in: Chapter 19: Emergent risks and key vulnerabilities (archived 20 October 2014), pp.1072-1073, in IPCC AR5 WG2 A 2014
- 1 2 Denton, F., et al., Section 20.3. Contributions to Resilience through Climate Change Responses, in: Chapter Climate-resilient pathways: adaptation, mitigation, and sustainable development (archived 20 October 2014), pp.1113-1118, in IPCC AR5 WG2 A 2014
- ↑ Field, C.B., et al., Section A-3. The Decision-making Context, in: Technical summary (archived 18 October 2014), p.55, in IPCC AR5 WG2 A 2014
- ↑ SPM.4.1 Long‐term mitigation pathways, in: Summary for Policymakers, pp.11-15 (archived 2 July 2014), in IPCC AR5 WG3 2014
- ↑ Clarke, L., et al., Section 6.3.1.3 Baseline emissions projections from fossil fuels and industry (pp.17-18 of final draft), in: Chapter 6: Assessing Transformation Pathways (archived 20 October 2014), in: IPCC AR5 WG3 2014
- ↑ Greenhouse Gas Concentrations and Climate Implications, p.14, in Prinn & Reilly 2014. The range given by Prinn and Reilly is 3.3 to 5.5 °C, with a median of 3.9 °C.
- ↑ SPM.3 Trends in stocks and flows of greenhouse gases and their drivers, in: Summary for Policymakers, p.8 (archived 2 July 2014), in IPCC AR5 WG3 2014. The range given by the Intergovernmental Panel on Climate Change is 3.7 to 4.8 °C, relative to pre-industrial levels (2.5 to 7.8 °C including climate uncertainty).
- ↑ Field, C.B., et al., Box TS.8: Adaptation Limits and Transformation, in: Technical summary (archived 18 October 2014), p.89, in IPCC AR5 WG2 A 2014
- ↑ Field, C.B., et al., Section B-1. Key Risks across Sectors and Regions, in: Technical summary (archived 18 October 2014), p.62, in IPCC AR5 WG2 A 2014
- 1 2 IPCC, Glossary A-D "climate" and "climate change", in IPCC AR4 WG1 2007
- ↑ US Environmental Protection Agency (US EPA) (14 June 2012), Climate Change Science Overview, US EPA, Click on the image to open a pop-up that explains the differences between climate change and global warming.
- 1 2 Albritton; et al., "Technical Summary", Box 1: What drives changes in climate?, , in IPCC TAR WG1 2001
- ↑ Pielke, Roger; Gwyn Prins; Steve Rayner; Daniel Sarewitz (2007-02-08). "Lifting the taboo on adaptation" (PDF). Nature. 445: 597–8. doi:10.1038/445597a. Retrieved 2012-08-09.
- ↑ "Definition of Anthropogenic Forcing – Chemistry Dictionary and Glossary".
- 1 2 Herring, D. (March 6, 2012). "ClimateWatch Magazine » Global Temperature Projections". NOAA Climate Portal.
- 1 2 3 4 Schneider; et al., "Chapter 19: Assessing key vulnerabilities and the risk from climate change", Sec. 19.3.1 Introduction to Table 19.1 Missing or empty
|title=(help), in IPCC AR4 WG2 2007. - 1 2 3 IPCC, "Summary for Policymakers", Sec. 1. Observed changes in climate and their effects Missing or empty
|title=(help), p. 5, in IPCC AR4 SYR 2007. - 1 2 Fisher; et al., "Chapter 3: Issues related to mitigation in the long-term context", Sec. 3.1 Emissions scenarios Missing or empty
|title=(help), in IPCC AR4 WG3 2007 - 1 2 3 4 5 6 Karl 2009 (eds.). "Global Climate Change". (PDF) http://downloads.globalchange.gov/usimpacts/pdfs/climate-impacts-report.pdf. Missing or empty
|title=(help) - ↑ Morita; et al., "Chapter 2, Greenhouse Gas Emission Mitigation Scenarios and Implications", Sec. 2.5.1.1 IPCC Emissions Scenarios and the SRES Process Missing or empty
|title=(help), in IPCC TAR WG3 2001. - ↑ IPCC, "Synthesis report", Sec. 3.1 Emissions scenarios Missing or empty
|title=(help), in IPCC AR4 SYR 2007. - 1 2 3 4 IPCC, "Summary for Policymakers", Sec. 1 3. Projected climate change and its impacts: Table SPM.1 Missing or empty
|title=(help), in IPCC AR4 SYR 2007. - ↑ Morita; et al., "Chapter 2, Greenhouse Gas Emission Mitigation Scenarios and Implications", Sec. 2.5.1.4 Emissions and Other Results of the SRES Scenarios Missing or empty
|title=(help), in IPCC TAR WG3 2001. - ↑ Temperature change in years 2090-2099 relative to years 1980-1999
- 1 2 3 4 5 6 7 8 9 Solomon; et al., "Technical Summary", Box TS.1: Treatment of Uncertainties in the Working Group I Assessment Missing or empty
|title=(help), in IPCC AR4 WG1 2007. - 1 2 United Nations Environment Programme (UNEP) (November 2010), "Ch 2: Which emissions pathways are consistent with a 2 °C or a 1.5 °C temperature limit?: Sec 2.2 What determines long-term temperature?", The Emissions Gap Report: Are the Copenhagen Accord pledges sufficient to limit global warming to 2 °C or 1.5 °C? A preliminary assessment (advance copy) (PDF), UNEP, p.28. This publication is also available in e-book format
- ↑ "Box 8.1 Likelihood of exceeding a temperature increase at equilibrium, in: Ch 8: The Challenge of Stabilisation" (PDF), Missing or empty
|title=(help), in Stern 2006, p. 195 - 1 2 Solomon, S.; et al. (January 28, 2009). "Irreversible climate change due to carbon dioxide emissions" (PDF). Proceedings of the National Academy of Sciences of the United States of America. US National Academy of Sciences. 106 (6): 1704–9. Bibcode:2009PNAS..106.1704S. doi:10.1073/pnas.0812721106. PMC 2632717
 . PMID 19179281.
 - ↑ "Question 5", Figure 5-2 Missing or empty
|title=(help), in IPCC TAR SYR 2001, p. 89 - ↑ Meehl, G.A.; et al., "Ch 10: Global Climate Projections", Sec 10.7.2 Climate Change Commitment to Year 3000 and Beyond to Equilibrium Missing or empty
|title=(help), in IPCC AR4 WG1 2007 - 1 2 Hansen, J.E.; M. Sato (July 2011), NASA GISS: Science Briefs: Earth's Climate History: Implications for Tomorrow, New York City, New York, USA: NASA GISS
- 1 2 Overpeck, J.T. (20 August 2008), NOAA Paleoclimatology Global Warming - The Story: Proxy Data, NOAA Paleoclimatology Program - NCDC Paleoclimatology Branch
- ↑ Committee on Surface Temperature Reconstructions for the Last 2,000 Years, US National Research Council (2006), "Summary", Surface Temperature Reconstructions for the Last 2,000 Years, Washington, D.C., USA: National Academy Press, ISBN 0-309-66144-7 External link in
|publisher=(help), p.3 - 1 2 Jansen; et al., "Chapter 6: Palaeoclimate", Sec. 6.3.2 What Does the Record of the Mid-Pliocene Show? Missing or empty
|title=(help), in IPCC AR4 WG1 2007. - ↑ Smith, J.B.; et al., "Ch 19. Vulnerability to Climate Change and Reasons for Concern: A Synthesis", Footnote 4, in Sec 19.8.2. What does Each Reason for Concern Indicate? Missing or empty
|title=(help), in IPCC TAR WG2 2001, p. 957 - ↑ NOAA 2010, p. 2
- ↑ NOAA 2010, p. 3
- ↑ Solomon; et al., "Technical Summary", TS.3.4 Consistency Among Observations Missing or empty
|title=(help), in IPCC AR4 WG1 2007. - 1 2 3 4 5 Rosenzweig; et al., "Chapter 1: Assessment of Observed Changes and Responses in Natural and Managed Systems", Executive summary Missing or empty
|title=(help), in IPCC AR4 WG2 2007. - 1 2 3 Hegerl; et al., "Chapter 9: Understanding and Attributing Climate Change", Executive Summary Missing or empty
|title=(help), in IPCC AR4 WG1 2007. - ↑ IPCC, "Summary for Policymakers", Human and Natural Drivers of Climate Change Missing or empty
|title=(help), in IPCC AR4 WG1 2007. - ↑ Committee on the Science of Climate Change, US National Research Council (2001). "3. Human Caused Forcings". Climate Change Science: An Analysis of Some Key Questions. Washington, D.C., USA: National Academy Press. p. 12. ISBN 0-309-07574-2. External link in
|publisher=(help) - ↑ IPCC, "Summary for Policymakers", Sec. 3. Projected climate change and its impacts Missing or empty
|title=(help), in IPCC AR4 SYR 2007. - ↑ ESRL web team (26 January 2009). "ESRL News: New Study Shows Climate Change Largely Irreversible" (Press release). US Department of Commerce, NOAA, Earth System Research Laboratory (ESRL).
- 1 2 3 4 IPCC, "Summary for Policymakers", Magnitudes of impact Missing or empty
|title=(help), p.17, IPCC AR4 WG2 2007. - ↑ Executive Summary (PHP). Abrupt Climate Change: Inevitable Surprises. United States National Academy of Sciences. June 2002.
- ↑ Le Treut; et al., "Chapter 1: Historical Overview of Climate Change Science", FAQ 1.2 What is the Relationship between Climate Change and Weather? Missing or empty
|title=(help), in IPCC AR4 WG1 2007. - ↑ NOAA Geophysical Fluid Dynamics Laboratory (GFDL) (9 October 2012), GFDL Climate Modeling Research Highlights: Will the Wet Get Wetter and the Dry Drier, NOAA GFDL
- 1 2 3 4 NOAA (February 2007), "Will the wet get wetter and the dry drier?" (PDF), GFDL Climate Modeling Research Highlights, Princeton, NJ, USA: National Oceanic and Atmospheric Administration (NOAA) Geophysical Fluid Dynamics Laboratory (GFDL), 1 (5). Revision 10/15/2008, 4:47:16 PM.
- ↑ "Summary for policymakers", https://docs.google.com/file/d/0B1gFp6Ioo3akYklZcWkwWHJud00/edit?pli=1 Missing or empty
|title=(help), in IPCC SREX 2012, p. 8 - 1 2 3 4 5 6 7 8 9 10 IPCC (2013), Table SPM.1, in Summary for Policymakers, p. 5 (archived PDF), in IPCC AR5 WG1 2013
- ↑ Stocker, T.F., et al. (2013), Temperature Extremes, Heat Waves and Warm Spells, in: TFE.9, in: Technical Summary, p. 111 (archived PDF), in IPCC AR5 WG1 2013
- ↑ Stocker, T.F., et al. (2013), Floods and Droughts, in: TFE.9, in: Technical Summary, p. 112 (archived PDF), in IPCC AR5 WG1 2013
- 1 2 3 Christensen, J.H.,et al. (2013), Cyclones, in: Executive Summary, in: Chapter 14: Climate Phenomena and their Relevance for Future Regional Climate Change, p. 1220 (archived PDF), in IPCC AR5 WG1 2013
- 1 2 3 4 5 Confalonieri; et al., "Chapter 8: Human health", Executive summary Missing or empty
|title=(help), in IPCC AR4 WG2 2007. - ↑ IPCC, "Summary for Policymakers", Question 4 Missing or empty
|title=(help), p.14, in IPCC TAR SYR 2001. - 1 2 IPCC, "Synthesis Report, Topic 5: The long-term perspective", Sec. 5.2 Key vulnerabilities, impacts and risks – long-term perspectives Missing or empty
|title=(help), pp. 64–65, in IPCC AR4 SYR 2007. - ↑ "Cryosphere", in US EPA 2012
- ↑ 2011 Arctic Sea Ice Minimum, in Kennedy 2012
- ↑ Mass Balance of Mountain Glaciers in 2011, in Kennedy 2012
- ↑ 2011 Snow Cover in Northern Hemisphere, in Kennedy 2012
- 1 2 Solomon, S.; et al., "Technical summary", TS.5.2 Large-Scale Projections for the 21st Century Missing or empty
|title=(help), in IPCC AR4 WG1 2007 - ↑ Met Office, Arctic sea ice 2012, Exeter, UK: Met Office
- ↑ Meehl, G.A.; et al., "Ch 10: Global Climate Projections", Box 10.1: Future Abrupt Climate Change, ‘Climate Surprises’, and Irreversible Changes: Glaciers and ice caps Missing or empty
|title=(help), in IPCC AR4 WG1 2007, p. 776 - ↑ Meehl, G.A.; et al., "Ch 10: Global Climate Projections", Sec 10.3.3.2 Changes in Snow Cover and Frozen Ground Missing or empty
|title=(help), in IPCC AR4 WG1 2007, pp. 770, 772 - ↑ Field, C.B.; et al., "Ch 14: North America", Sec 14.4.1 Freshwater resources: Surface water Missing or empty
|title=(help), in IPCC AR4 WG2 2007, p. 627 - ↑ "Snowpack", in US EPA 2012
- ↑ Some of these impacts are included in table SPM.2: "Summary for Policymakers", 3 Projected climate change and its impacts: Table SPM.2 Missing or empty
|title=(help), in IPCC AR4 SYR 2007, pp. 11–12 - ↑ "Ch 3: Fresh Water Resources and their Management", Sec 3.4.3 Floods and droughts Missing or empty
|title=(help), in IPCC AR4 WG2 2007, p. 187 - ↑ Barnett, T.P.; et al. (17 November 2005), "Potential impacts of a warming climate on water availability in snow-dominated regions: Abstract" (PDF), Nature, 438, pp. 303–9, Bibcode:2005Natur.438..303B, doi:10.1038/nature04141, PMID 16292301
- ↑ State of the Climate in 2009, as appearing in the July 2010 issue (Vol. 91) of the Bulletin of the American Meteorological Society (BAMS). Supplemental and Summary Materials: Report at a Glance: Highlights. Website of the US National Oceanic and Atmospheric Administration: National Climatic Data Center. July 2010. Retrieved 2011-06-06.
- ↑ Bindoff, N.L.; et al., "Ch. 5: Observations: Oceanic Climate Change and Sea Level", Sec 5.2.2.3 Implications for Earth’s Heat Balance Missing or empty
|title=(help), in IPCC AR4 WG1 2007, referred to by: Climate Graphics by Skeptical Science: Global Warming Components:, Skeptical Science, Components of global warming for the period 1993 to 2003 calculated from IPCC AR4 5.2.2.3 - 1 2 3 4
 This article incorporates public domain material from the US EPA document: Climate Change Indicators in the United States, 2012, 2nd ed: Ocean Acidity: Figure 2. Changes in Aragonite Saturation of the World's Oceans, 1880-2012, US Environmental Protection Agency (EPA)
- 1 2 "Introduction". Ecological Impacts of Climate Change. p. 8., in NRC 2008b
- 1 2 IPCC, "Synthesis Report", Sec. 3.3.4 Ocean acidification Missing or empty
|title=(help), in IPCC AR4 SYR 2007. - ↑ Fischlin; et al., "Chapter 4: Ecosystems, their properties, goods, and services", Executive summary [??] Missing or empty
|title=(help), p. 213, in IPCC AR4 WG2 2007. - ↑ Crowley, T. J.; North, G. R. (May 1988). "Abrupt Climate Change and Extinction Events in Earth History". Science. 240 (4855): 996–1002. Bibcode:1988Sci...240..996C. doi:10.1126/science.240.4855.996. PMID 17731712.
- ↑ Shaffer, G. .; Olsen, S. M.; Pedersen, J. O. P. (2009). "Long-term ocean oxygen depletion in response to carbon dioxide emissions from fossil fuels". Nature Geoscience. 2 (2): 105–109. Bibcode:2009NatGe...2..105S. doi:10.1038/ngeo420.
- ↑ US Environmental Protection Agency (US EPA) (2010). "Sea Level: Climate Change: US EPA". US EPA.
- 1 2 Bindoff; et al., "Chapter 5: Observations: Oceanic Climate Change and Sea Level", FAQ 5.1 Is Sea Level Rising? Missing or empty
|title=(help), in IPCC AR4 WG1 2007. - ↑ Bindoff; et al., "Chapter 5: Observations: Oceanic Climate Change and Sea Level", Executive summary Missing or empty
|title=(help), in IPCC AR4 WG1 2007. - ↑ Albritton; et al., "Technical Summary", Box 2: What causes sea level to change? Missing or empty
|title=(help), in IPCC TAR WG1 2007. - ↑ "7 Sea Level Rise and the Coastal Environment", http://books.nap.edu/openbook.php?record_id=12782&page=245 Missing or empty
|title=(help), in NRC 2010, p. 245. - ↑ IPCC, "Section 3: Projected climate change and its impacts", Table SPM.1 Missing or empty
|title=(help), in IPCC AR4 SYR 2007. - ↑ change in sea level by 2090–99, relative to 1980–99
- ↑ Meehl; et al., "Chapter 10: Global Climate Projections", Executive summary Missing or empty
|title=(help), in IPCC AR4 WG1 2007. - 1 2 3 4 "7 Sea Level Rise and the Coastal Environment", pp. 243–245 http://books.nap.edu/openbook.php?record_id=12782&page=243 Missing or empty
|title=(help), in US NRC 2010. - ↑ Bindoff; et al., "Chapter 5: Observations: Oceanic Climate Change and Sea Level", Missing or empty
|title=(help), in IPCC AR4 WG1 2007. - ↑ Gille, Sarah T. (February 15, 2002). "Warming of the Southern Ocean Since the 1950s". Science. 295 (5558): 1275–7. Bibcode:2002Sci...295.1275G. doi:10.1126/science.1065863. PMID 11847337.
- ↑ US Environmental Protection Agency (14 June 2012). "Science: Climate Change: US EPA (Climate Change Science Overview)". US EPA.
- 1 2 Rosenzweig, C. (December 2008). "Science Briefs: Warming Climate is Changing Life on Global Scale". Website of the US National Aeronautics and Space Administration, Goddard Institute for Space Studies. Retrieved 2011-07-08.
- 1 2 3 US NRC (2008). Understanding and Responding to Climate Change. A brochure prepared by the US National Research Council (US NRC) (PDF). Washington DC, USA: Board on Atmospheric Sciences and Climate, National Academy of Sciences. External link in
|publisher=(help) - ↑ IPCC, "Summary for Policymakers", Projections of Future Changes in Climate Missing or empty
|title=(help), in IPCC AR4 WG1 2007. - ↑ IPCC, "Synthesis Report", Question 9: Table SPM-3 Missing or empty
|title=(help), in IPCC TAR SYR 2001. - 1 2 IPCC, "Synthesis report", Sec. 3.3.3 Especially affected systems, sectors and regions Missing or empty
|title=(help), in IPCC AR4 SYR 2007. - 1 2 Schneider, S.H.; et al., "Ch 19: Assessing Key Vulnerabilities and the Risk from Climate Change", Distribution of Impacts, in: Sec 19.3.7 Update on 'Reasons for Concern' Missing or empty
|title=(help), in IPCC AR4 WG2 2007, p. 796 - 1 2 Schneider, S.H.; et al., "Ch 19: Assessing Key Vulnerabilities and the Risk from Climate Change", Sec 19.3.3 Regional vulnerabilities Missing or empty
|title=(help), in IPCC AR4 WG2 2007, p. 792 - ↑ Wilbanks, T.J.; et al., "Ch 7: Industry, Settlement and Society", Sec 7.4.2.5 Social issues and Sec 7.4.3 Key vulnerabilities Missing or empty
|title=(help), in IPCC AR4 WG2 2007, pp. 373–376 - ↑ IPCC, Glossary P-Z: "sensitivity" and "vulnerability", in IPCC AR4 WG2 2007.
- ↑ IPCC, "Summary for Policymakers", Sec. 2.4. Many Human Systems are Sensitive to Climate Change, and Some are Vulnerable Missing or empty
|title=(help), in IPCC TAR WG2 2001. - ↑ Schneider; et al., "Chapter 19: Assessing key vulnerabilities and the risk from climate change", 19.3.2.2 Other market sectors Missing or empty
|title=(help), in IPCC AR4 WG2 2007. - ↑ Easterling; et al., "Chapter 5: Food, Fibre, and Forest Products", 5.4.1 Primary effects and interactions Missing or empty
|title=(help), in IPCC AR4 WG2 2007, p. 282. - 1 2 3 Schneider; et al., "Chapter 19: Assessing Key Vulnerabilities and the Risk from Climate Change", Sec. 19.3.2.1 Agriculture Missing or empty
|title=(help), in IPCC AR4 WG2 2007, p. 790. - ↑ Rosenzweig; et al., "Chapter 1: Assessment of Observed Changes and Responses in Natural and Managed Systems", Sec. 1.3.6.1 Crops and livestock Missing or empty
|title=(help), in IPCC AR4 WG2 2007. - ↑ IPCC, Glossary P-Z: "phenology", in IPCC AR4 WG2 2007.
- 1 2 Figure 5.1, p.161, in: Sec 5.1 FOOD PRODUCTION, PRICES, AND HUNGER, in: Ch 5: Impacts in the Next Few Decades and Coming Centuries, in: US NRC 2011
- 1 2 Sec 5.1 FOOD PRODUCTION, PRICES, AND HUNGER, pp.160-162, in: Ch 5: Impacts in the Next Few Decades and Coming Centuries, in US NRC 2011
- ↑ Schneider, S.H.; et al., "Chapter 19: Assessing Key Vulnerabilities and the Risk from Climate Change", Box 19.2. Reference for temperature levels Missing or empty
|title=(help), in IPCC AR4 WG2 2007, p. 783. - ↑ Easterling; et al., "Chapter 5: Food, Fibre, and Forest Products", Sec. 5.6.5 Food security and vulnerability Missing or empty
|title=(help), in IPCC AR4 WG2 2007. - ↑ "World hunger increasing". Food and Agriculture Organization (FAO) Newsroom. 30 October 2006. Retrieved 2011-07-07.
- ↑ Dai, A. (2011). "Drought under global warming: A review". Wiley Interdisciplinary Reviews: Climate Change. 2: 45–65. doi:10.1002/wcc.81.
- ↑ Sheffield, J.; Wood, E. F.; Roderick, M. L. (2012). "Little change in global drought over the past 60 years". Nature. 491 (7424): 435–438. Bibcode:2012Natur.491..435S. doi:10.1038/nature11575.
- ↑ Mishra, A. K.; Singh, V. P. (2011). "Drought modeling – A review". Journal of Hydrology. 403: 157–175. Bibcode:2011JHyd..403..157M. doi:10.1016/j.jhydrol.2011.03.049.
- ↑ Ding, Y.; Hayes, M. J.; Widhalm, M. (2011). "Measuring economic impacts of drought: A review and discussion". Disaster Prevention and Management. 20 (4): 434–446. doi:10.1108/09653561111161752.
- ↑ WHO (2009). "Ch. 2, Results: 2.6 Environmental risks" (PDF). Global health risks: mortality and burden of disease attributable to selected major risks (PDF). Geneva, Switzerland: WHO Press. p. 24. ISBN 978 92 4 156387 1.
- 1 2 IPCC AR4 SYR 2007.
- 1 2 Confalonieri; et al., "Chapter 8: Human health", Sec. 8.3.2 Future vulnerability to climate change Missing or empty
|title=(help), in IPCC AR4 WG2 2007. - ↑ Kundzewicz; et al., "Chapter 3: Fresh Water Resources and their Management", Sec. 3.2 Current sensitivity/vulnerability Missing or empty
|title=(help), in IPCC AR4 WG2 2007. - 1 2 Kundzewicz; et al., "Chapter 3: Fresh Water Resources and their Management", Sec. 3.3 Executive summary Missing or empty
|title=(help), p. 175, in IPCC AR4 WG2 2007. - 1 2 Scott; et al., "Chapter 12: Human settlements in a changing climate: impacts and adaptation", Sec. 12.3.1 Population Migration Missing or empty
|title=(help), pp. 406—407, in IPCC SAR WG2 1996. - ↑ Special Report on Emissions Scenarios, 10.2.5.1. Human Settlements, https://www.ipcc.ch/ipccreports/sres/regional/275.htm
- 1 2 The World Bank, "Part One: Chapter 2: Reducing Human Vulnerability: Helping People Help Themselves" (PDF), Managing social risks: Empower communities to protect themselves, p. 109, WDR 2010.
- ↑ Desanker; et al., "Chapter 10: Africa", Executive summary Missing or empty
|title=(help), in IPCC TAR WG2 2001. - 1 2 Scott; et al., "Chapter 7: Human Settlements, Energy, and Industry", Sec. 7.2.2.3.1. Migration Missing or empty
|title=(help), in IPCC TAR WG2 2001. - ↑ Wilbanks; et al., "Chapter 7: Industry, settlement and society", Sec. 7.4.1 General effects: Box 7.2. Environmental migration Missing or empty
|title=(help), in IPCC AR4 WG2 2007. - ↑ Hsiang SM, Burke M, Miguel E (September 2013). "Quantifying the influence of climate on human conflict". Science. 341 (6151): 1235367. doi:10.1126/science.1235367. PMID 24031020.
- ↑ Ranson, M. (2014). "Crime, weather, and climate change". Journal of Environmental Economics and Management. 67: 274–302. doi:10.1016/j.jeem.2013.11.008.
- ↑ Spaner, J S; LeBali, H (October 2013). "The Next Security Frontier". Proceedings of the US Naval Institute. 139 (10): 30–35. Retrieved 23 Nov 2015.
- ↑ Glossary A-D: "Aggregate impacts", in IPCC AR4 SYR 2007, p. 76
- ↑ Smith; et al., "Chapter 19: Vulnerability to Climate Change and Reasons for Concern: A Synthesis", Sec. 19.5.3 Insights and Lessons: Vulnerability over Time: Table 19-5 Missing or empty
|title=(help), in IPCC TAR WG2 2001. - ↑ Smith; et al., "Chapter 19: Vulnerability to Climate Change and Reasons for Concern: A Synthesis", Sec. 19.5.2. Insights and Lessons: The Static Picture Missing or empty
|title=(help), in IPCC TAR WG2 2001. - ↑ Rosenzweig; et al., "Chapter 1: Assessment of observed changes and responses in natural and managed systems", Sec. 1.3.8.5 Summary of disasters and hazards Missing or empty
|title=(help), in IPCC AR4 WG2 2007. - 1 2 3 IPCC, "Synthesis Report", Question 2, Sections 2.25 and 2.26 Missing or empty
|title=(help), p. 55, IPCC TAR SYR 2001. - ↑ Billion-Dollar Weather and Climate Disasters
- ↑ Schneider; et al., "Chapter 19: Assessing key vulnerabilities and the risk from climate change", Sec. 19.3.2.3 Aggregate market impacts Missing or empty
|title=(help), p. 790, in IPCC AR4 WG2 2007. - 1 2 Smith; et al., "Chapter 19: Vulnerability to Climate Change and Reasons for Concern: A Synthesis", Sec. 19.8.2.3. Aggregate Impacts Missing or empty
|title=(help), in IPCC TAR WG2 2001. - 1 2 3 4 Schneider; et al., "Chapter 19: Assessing key vulnerabilities and the risk from climate change", Sec. 19.3.7 Update on ‘Reasons for Concern’ Missing or empty
|title=(help), p. 796, in IPCC AR4 WG2 2007. - ↑ Smith; et al., "Chapter 19: Vulnerability to Climate Change and Reasons for Concern: A Synthesis", Sec. 19.4.3. Distribution of Total Impacts Missing or empty
|title=(help), in IPCC TAR WG2 2001. - ↑ NRC 2008b. "Introduction". Ecological Impacts of Climate Change. p. 14.
- 1 2 NRC 2008b. "Introduction". Ecological Impacts of Climate Change. p. 16.
- 1 2 3 Fischlin; et al., "Chapter 4: Ecosystems, their properties, goods and services", Executive summary Missing or empty
|title=(help), pp. 213–214, in IPCC AR4 WG2 2007. - 1 2 IPCC, "Synthesis Report, Question 3", Sec. 3.18 http://www.grida.no/climate/ipcc_tar/vol4/english/026.htm Missing or empty
|title=(help), in IPCC TAR SYR 2001. - ↑ Van Riper, Charles. (2014) Projecting Climate Effects on Birds and Reptiles of the Southwestern United States. Reston, Va.: U.S. Department of the Interior, U.S. Geological Survey.
- 1 2 3 4 5 Fischlin; et al., "Chapter 4: Ecosystems, their properties, goods and services", Sec. 4.4.11 Global synthesis including impacts on biodiversity Missing or empty
|title=(help), in IPCC AR4 WG2 2007. - ↑ IPCC, Glossary A-D: "biota", in IPCC AR4 WG2 2007.
- ↑ NRC, "Introduction", Ecological Impacts of Climate Change, p. 16, in NRC 2008b.
- ↑ IPCC, "Section 3: Projected climate change and its impacts", Sec. 3.3 Impacts of future climate changes Missing or empty
|title=(help), in IPCC AR4 SYR 2007. - ↑ IPCC, "Section 3: Projected climate change and its impacts", Sec. 3.3.1 Impacts on systems and sectors: Ecosystems Missing or empty
|title=(help), in IPCC AR4 SYR 2007. - 1 2 3 Smith; et al., "Chapter 19: Vulnerability to Climate Change and Reasons for Concern: A Synthesis", Sec. 19.8.2.5. Large-Scale Singularities Missing or empty
|title=(help), in IPCC TAR WG2 2001. - 1 2 White; et al., "Technical summary", Sec. 7.2.5, Large-Scale Singular Events Missing or empty
|title=(help), in IPCC TAR WG2 2001. - ↑ "[F]or the most part" refers to improved scientific understanding of singularities since the assessment by White et al. (2001). See:
Schneider; et al., "Chapter 19: Assessing key vulnerabilities and the risk from climate change", Sec. 19.3.7 Update on ‘Reasons for Concern’ Missing or empty
|title=(help), in IPCC AR4 WG2 2007. - 1 2 3 Schneider; et al., "Chapter 19: Assessing key vulnerabilities and the risk from climate change", Sec. ??? Missing or empty
|title=(help), in IPCC AR4 WG2 2007. - ↑ Riebeek, H.. design by R. Simmon (May 9, 2006). "Paleoclimatology: Explaining the Evidence: Explaining Rapid Climate Change: Tales from the Ice". NASA Earth Observatory. Retrieved 2011-10-16.
- 1 2 3 4 5 CCSP (2008b). Abrupt Climate Change. A report by the US Climate Change Science Program (CCSP) and the Subcommittee on Global Change Research. Reston, VA: US Geological Survey.
- ↑ Schneider; et al., "Chapter 19: Assessing key vulnerabilities and the risk from climate change", Sec. 19.3.5.3 Possible changes in the North Atlantic meridional overturning circulation (MOC) Missing or empty
|title=(help), in IPCC AR4 WG2 2007. - 1 2 Albritton; et al., "Technical Summary", Sec. C.1 Observed Changes in Globally Well-Mixed Greenhouse Gas Concentrations and Radiative Forcing Missing or empty
|title=(help), p. 38, in IPCC TAR WG1 2001. - ↑ IPCC, "Summary for Policymakers", Sec. 2. Causes of change Missing or empty
|title=(help), p. 5, in IPCC AR4 SYR 2007. - ↑ Meehl; et al. "Chapter 10: Global Climate Projections". Frequently Asked Question 10.3: If Emissions of Greenhouse Gases are Reduced, How Quickly do Their Concentrations in the Atmosphere Decrease?. Missing or empty
|title=(help), in IPCC AR4 WG1 2007. - 1 2 Barker; et al., "Chapter 11: Mitigation from a cross-sectoral perspective", Executive summary - Unconventional options Missing or empty
|title=(help) , in IPCC AR4 WG3 2007. - ↑ IPCC, "5.14", Question 5 http://www.grida.no/climate/ipcc_tar/vol4/english/044.htm Missing or empty
|title=(help), in IPCC TAR SYR 2001. - 1 2 3 4 Schneider; et al., "Chapter 19: Assessing key vulnerabilities and the risk from climate change", Sec.19.2 Criteria for selecting ‘key’ vulnerabilities: Persistence and reversibility Missing or empty
|title=(help), in IPCC AR4 WG2 2007. - ↑ Barnett, J; WN Adger (2003). "Climate dangers and atoll countries" (PDF). Climatic Change. Kluwer Academic Publishers. 61: 321–337. doi:10.1023/b:clim.0000004559.08755.88. This paper was published in 2001 as Tyndall Centre Working Paper 9
- ↑ Tol Correction
- ↑ Mendelsohn 2006,
- ↑ Increased growing season in Greenland, Nyegaard 2007
- ↑ Kimball 2007
- ↑ Variations in northern vegetation activity inferred from satellite data of vegetation index during 1981 to 1999 L. Zhou et. al. 2001
- ↑ Impact of climate forcing on ecosystem processes in the North Pacific Subtropical Gyre Guido Corno et. al. 2007
- ↑ McMahon 2010
- ↑ Klady 2010
- ↑ Climate warming will not decrease winter mortalityP.L. Staddon et.al. 2014
- ↑ Kerr 2002
- ↑ Ducklow 2006
- ↑ Ozgul 2010
- ↑ IPCC 2010, pp. 4–7
- ↑ IPCC press release 2014
- ↑ Molina & others n.d.
- ↑ PBL & others 2009
- ↑ For example: Good & others (2010). Refer to UKMO (2013) for other AVOID publications.
- ↑ UK Royal Society & US National Academy of Sciences 2014
- ↑ Allison & others 2009
- ↑ US NRC 2010
- ↑ US NRC 2011
- ↑ Molina & others n.d., p. 3
- ↑ "NASA Releases Detailed Global Climate Change Projections". Retrieved 2015-06-09.
- 1 2 IPCC, "Synthesis Report", Question 2, Box 2-1 Missing or empty
|title=(help), IPCC TAR SYR 2001. - ↑ Moss, R.; Schneider, S. (July 2000), "Uncertainties", in R. Pachuari; T. Taniguchi; K. Tanaka (eds.), IPCC supporting material: guidance papers on the cross cutting issues of the Third Assessment Report of the IPCC (PDF), 2-1-1 Toranomon, Minato-ku, 1050001 Tokyo, Japan: Global Industrial and Social Progress Research Institute (GISPRI), ISBN 4-9980908-0-1
- ↑ White; et al., "Technical Summary", Box 2. Confidence Levels and State of Knowledge Missing or empty
|title=(help), in IPCC TAR WG2 2001. - ↑ "Summary for policymakers", https://docs.google.com/file/d/0B1gFp6Ioo3akYklZcWkwWHJud00/edit?pli=1 Missing or empty
|title=(help), in IPCC SREX 2012, p. 19 - ↑ Ahmad; et al., "Chapter 2: Methods and Tools", Sec. 2.6.2. "Objective" and "Subjective" Probabilities are not Always Explicitly Distinguished Missing or empty
|title=(help), in IPCC TAR WG2 2001. - 1 2 3 Granger Morgan, M. (Lead Author), H. Dowlatabadi, M. Henrion, D. Keith, R. Lempert, S. McBride, M. Small and T. Wilbanks (Contributing Authors) (2009). Synthesis and Assessment Product 5.2: Best practice approaches for characterizing, communicating, and incorporating scientific uncertainty in decisionmaking. A Report by the U.S. Climate Change Science Program and the Subcommittee on Global Change Research. Washington D.C., USA.: National Oceanic and Atmospheric Administration. pp. 19–20; 27–28. Tables 2.1 and 2.2 on pages 27-28 show two quantitative scales of uncertainty which are used in the TAR and AR4.
References
- Allison, I.; et al. (2009), The Copenhagen Diagnosis, 2009: Updating the world on the Latest Climate Science, Sydney, Australia: The University of New South Wales Climate Change Research Centre (CCRC), retrieved 8 June 2014. Archived 7 March 2014.
- Good, P.; et al. (2010), An updated review of developments in climate science research since IPCC AR4. A report by the AVOID consortium (PDF), London, UK: Committee on Climate Change. Archived Report website.
- Committee on Ecological Impacts of Climate Change, US National Research Council (NRC) (2008). Ecological Impacts of Climate Change. 500 Fifth Street, NW Washington, DC 20001, USA: The National Academies Press. ISBN 978-0-309-12710-3.
- IPCC (November 2010), Understanding Climate Change: 22 years of IPCC assessment (PDF), IPCC, retrieved 29 May 2014. Archived file
- IPCC SAR WG2 (1996), Watson, R.T.; Zinyowera, M.C.; Moss, R.H., eds., Climate Change 1995: Impacts, Adaptations and Mitigation of Climate Change: Scientific-Technical Analyses, Contribution of Working Group II to the Second Assessment Report of the Intergovernmental Panel on Climate Change, Cambridge University Press, ISBN 0-521-56431-X (pb: 0-521-56437-9 pdf.
- IPCC TAR WG1 (2001), Houghton, J.T.; Ding, Y.; Griggs, D.J.; Noguer, M.; van der Linden, P.J.; Dai, X.; Maskell, K.; Johnson, C.A., eds., Climate Change 2001: The Scientific Basis, Contribution of Working Group I to the Third Assessment Report of the Intergovernmental Panel on Climate Change, Cambridge University Press, ISBN 0-521-80767-0 (pb: 0-521-01495-6).
- IPCC TAR WG2 (2001), McCarthy, J. J.; Canziani, O. F.; Leary, N. A.; Dokken, D. J.; White, K. S., eds., Climate Change 2001: Impacts, Adaptation and Vulnerability, Contribution of Working Group II to the Third Assessment Report of the Intergovernmental Panel on Climate Change, Cambridge University Press, ISBN 0-521-80768-9 (pb: 0-521-01500-6).
- IPCC TAR WG3 (2001), Metz, B.; Davidson, O.; Swart, R.; Pan, J., eds., Climate Change 2001: Mitigation, Contribution of Working Group III to the Third Assessment Report of the Intergovernmental Panel on Climate Change, Cambridge University Press, ISBN 0-521-80769-7 (pb: 0-521-01502-2).
- IPCC TAR SYR (2001), Watson, R. T.; the Core Writing Team, eds., Climate Change 2001: Synthesis Report, Contribution of Working Groups I, II, and III to the Third Assessment Report of the Intergovernmental Panel on Climate Change, Cambridge University Press, ISBN 0-521-80770-0 (pb: 0-521-01507-3).
- IPCC AR4 WG1 (2007), Solomon, S.; Qin, D.; Manning, M.; Chen, Z.; Marquis, M.; Averyt, K.B.; Tignor, M.; Miller, H.L., eds., Climate Change 2007: The Physical Science Basis, Contribution of Working Group I to the Fourth Assessment Report of the Intergovernmental Panel on Climate Change, Cambridge University Press, ISBN 978-0-521-88009-1 (pb: 978-0-521-70596-7).
- IPCC AR4 WG2 (2007), Parry, M.L.; Canziani, O.F.; Palutikof, J.P.; van der Linden, P.J.; Hanson, C.E., eds., Climate Change 2007: Impacts, Adaptation and Vulnerability, Contribution of Working Group II to the Fourth Assessment Report of the Intergovernmental Panel on Climate Change, Cambridge University Press, ISBN 978-0-521-88010-7 (pb: 978-0-521-70597-4).
- IPCC AR4 WG3 (2007), Metz, B.; Davidson, O.R.; Bosch, P.R.; Dave, R.; Meyer, L.A., eds., Climate Change 2007: Mitigation of Climate Change, Contribution of Working Group III to the Fourth Assessment Report of the Intergovernmental Panel on Climate Change, Cambridge University Press, ISBN 978-0-521-88011-4 (pb: 978-0-521-70598-1).
- IPCC AR4 SYR (2007), Core Writing Team; Pachauri, R.K; Reisinger, A., eds., Climate Change 2007: Synthesis Report, Contribution of Working Groups I, II and III to the Fourth Assessment Report of the Intergovernmental Panel on Climate Change, Geneva, Switzerland: IPCC, ISBN 92-9169-122-4.
- IPCC SREX (2012), Field, C.B. et al., eds., Managing the Risks of Extreme Events and Disasters to Advance Climate Change Adaptation (SREX), Cambridge University Press. Summary for Policymakers available in Arabic, Chinese, French, Russian, and Spanish.
- IPCC AR5 WG1 (2013), Stocker, T.F.; et al., eds., Climate Change 2013: The Physical Science Basis. Working Group 1 (WG1) Contribution to the Intergovernmental Panel on Climate Change (IPCC) 5th Assessment Report (AR5), Cambridge University Press. Climate Change 2013 Working Group 1 website.
- IPCC AR5 WG2 A (2014), Field, C.B.; et al., eds., Climate Change 2014: Impacts, Adaptation, and Vulnerability. Part A: Global and Sectoral Aspects. Contribution of Working Group II (WG2) to the Fifth Assessment Report (AR5) of the Intergovernmental Panel on Climate Change (IPCC), Cambridge University Press. Archived 20 October 2014.
- IPCC AR5 WG3 (2014), Edenhofer, O.; et al., eds., Climate Change 2014: Mitigation of Climate Change. Contribution of Working Group III (WG3) to the Fifth Assessment Report (AR5) of the Intergovernmental Panel on Climate Change (IPCC), Cambridge University Press. Archived 29 June 2014.
- IPCC press release (31 March 2014), Press Release: IPCC Report: A changing climate creates pervasive risks but opportunities exist for effective responses - Responses will face challenges with high warming of the climate (PDF), IPCC, retrieved 29 May 2014. Archived file. Also available in Arabic, Chinese, French, Russian and Spanish.
- Karl, Thomas R.; Melillo, Jerry M.; Peterson, Thomas C., eds. (2009). Global Climate Change Impacts in the United States (PDF). New York: Cambridge University Press. ISBN 978-0-521-14407-0.
- This article incorporates public domain material from the NOAA document: NOAA (July 2010), State of the Climate in 2009, as appearing in the July 2010 issue (Vol. 91) of the Bulletin of the American Meteorological Society (BAMS). Supplemental and Summary Materials: Report at a Glance: Highlights, US National Oceanic and Atmospheric Administration (NOAA): National Climatic Data Center
- This article incorporates public domain material from the NOAA document: Kennedy, C.H. (10 July 2012), ClimateWatch Magazine » State of the Climate in 2011: Highlights, NOAA
- Molina, M.; et al. (n.d.), What We Know: The Reality, Risks and Response to Climate Change. A report by the American Association for the Advancement of Science (AAAS) Climate Science Panel (PDF), AAAS, retrieved 6 June 2014. Archived 5 June 2014. Report website (archived 6 June 2014).
- PBL; et al. (November 2009), News in climate science and exploring boundaries: A Policy brief on developments since the IPCC AR4 report in 2007. A report by the Netherlands Environmental Assessment Agency (PBL), Royal Netherlands Meteorological Institute (KNMI), and Wageningen University and Research Centre (WUR) (PDF), Bilthoven, Netherlands: PBL. Archived 1 May 2014. Report website (Archived 1 May 2014).
- Prinn, R.G.; J.M. Reilly (2014), 2014 Energy and Climate Outlook (PDF), Cambridge, MA, USA: MIT Joint Program on the Science and Policy of Global Change. Archived 22 October 2014. Report website (archived 2 November 2014).
- Stern, N. (2006), Stern Review Report on the Economics of Climate Change (pre-publication edition), London, UK: HM Treasury
- UKMO (18 September 2013), AVOID Reports, UK Meteorological Office (UKMO), retrieved 8 June 2014. Archived 8 June 2014.
- UK Royal Society and US National Academy of Sciences (2014), Climate Change: Evidence and Causes (PDF), retrieved 8 June 2014. Archived 7 March 2014. Report website (archived 31 May 2014).
- This article incorporates public domain material from the US EPA document: Glossary of Climate Change Terms: Climate Change: US EPA, US Environmental Protection Agency (EPA) Climate Change Division, 14 June 2012
- Staff of the International Bank for Reconstruction and Development / The World Bank (2010). World Development Report 2010: Development and Climate Change. 1818 H Street NW, Washington DC 20433, USA: International Bank for Reconstruction and Development / The World Bank. doi:10.1596/978-0-8213-7987-5. ISBN 978-0-8213-7987-5.
- US NRC (2010). Advancing the Science of Climate Change. A report by the US National Research Council (NRC). Washington, D.C., USA: National Academies Press. ISBN 0-309-14588-0.. Archived 29 May 2014.
- US NRC (2011), Climate Stabilization Targets: Emissions, Concentrations, and Impacts over Decades to Millennia. A report by the US National Research Council (NRC), Washington, D.C., USA: National Academies Press Archived 27 March 2014.
Further reading
- Watkins, K.; et al. (2007), Ugaz, C., ed., Human Development Report 2007/8: Fighting climate change: Human solidarity in a divided world, Basingstoke, UK: Palgrave Macmillian, ISBN 978-0-230-54704-9
External links
- Physical impacts
- "Climate Change". World Meteorological Organization.
- The IPCC Working Group I (WG I). This body assesses the physical scientific aspects of the climate system and climate change.
- NASA Nex Climate Data and Prediction Models
- US Navy Climate Change Roadmap, 2010,
- Social, economic and ecological impacts
- Climate change on the United Nations Economic and Social Development (UNESD) Division for Sustainable Development website.
- The IPCC Working Group II (WG II) website – This body assesses the vulnerability of socio-economic and natural systems to climate change, negative and positive consequences of climate change, and options for adapting to it.
- General
- List of United Nations Functional Commissions and Expert Bodies related to climate change
- IRIN, the humanitarian news and analysis service of the UN Office for the Coordination of Humanitarian Affairs: "What climate change does", "How climate change works", and "Gathering Storm - the humanitarian impact of climate change"
- Videos:
- "Educational Forum: Arctic Climate Impact". Panel discussion with James J. McCarthy, Professor at Harvard University, and Author; Paul R. Epstein, M.D., instructor in medicine at Harvard Medical School; and Ross Gelbspan, Pulitzer Prize–winning journalist and author. Massachusetts School of Law.
- "How we know humans are changing the climate and Why climate change is a clear and present danger". Interviews with Christopher Field and Michael MacCracken. Christopher Field is the director of the Department of Global Ecology at the Carnegie Institution of Washington, professor of biology and environmental earth system science at Stanford University, and the Working Group II Co-Chair for the Intergovernmental Panel on Climate Change. Michael MacCracken is the chief scientist for Climate Change Programs at the Climate Institute and a co-author and contributing author for various chapters in the IPCC assessment reports. Climate Progress website, February 5, 2010.
- 25 Devastating Effects Of Climate Change—Business Insider (October 11, 2014)