Australian government debt
- Throughout this article, the unqualified term "dollar" and the $ symbol refer to the Australian dollar.
| Date (30 June) | Gross debt (A$ billion) | Debt ceiling (A$ billion) |
|---|---|---|
| 2004 | 59.628 | n/a |
| 2005 | 60.103 | n/a |
| 2006 | 59.078 | n/a |
| 2007 | 58.273 | 75 |
| 2008 | 60.451 | 75 |
| 2009 | 101.136 | 200 |
| 2010 | 147.122 | 200 |
| 2011 | 191.282 | 250 |
| 2012 | 233.968 | 300 |
| 2013 | 257.370 | 300 |
| 2014 | 319.479 | n/a |
| 2015 | 368.730 | n/a |
| 2016 (15 Jan) | 400.89 | n/a |
| 2016 (22 Jan) | 405.988 | n/a |
| Source: Reserve Bank of Australia[1] | ||
The Australian government debt is the amount owed by the Australian federal government.[2] The Australian Office of Financial Management, which is part of the Treasury Portfolio, is the agency which manages the government debt and does all the borrowing on behalf of the Australian government.[3] Australian government borrowings are subject to limits and regulation by the Loan Council, unless the borrowing is for defence purposes or is a 'temporary' borrowing. Government debt and borrowings (and repayments) have national macroeconomic implications, and are also used as one of the tools available to the national government in the macroeconomic management of the national economy, enabling the government to create or dampen liquidity in financial markets, with flow on effects on the wider economy.
As of 27 February 2014, the gross Australian government debt was A$300.63 billion; at 15 August 2014 it was A$326.55 billion; and at 13 March 2015 it was $361.09 billion, an increase of AUD$2.05 billion from 6 March 2015; at 22 January 2016 it was A$405.988 billion[4] The government debt fluctuates from week to week depending on government receipts, general outlays and large-sum outlays. Australian government debt does not take into account government funds held in reserve within statutory authorities such as the Australian Government Future Fund, which at 30 September 2015 was valued at A$117.83 billion, and the Reserve Bank of Australia. Nor is the net income of these statutory authorities taken into account. For example, the Future Fund net income in 2014/15 was A$15.61 billion, which went directly into the fund's reserves. Also, guarantees offered by the government do not figure in the government debt level. For example, on October 12, 2008, in response to the Economic crisis of 2008, the government offered to guarantee 100% of all bank deposits. This was subsequently reduced to a maximum of $1 million per customer per institution. From 1 February 2012, the guarantee was reduced to $250,000,[5] and is ongoing.
Australia's net international investment liability position (government debt and private debt) was A$922.8 billion at 30 September 2015, an increase of A$18.2 billion (2%) on the liability position at 30 June 2015, according to the Australian Bureau of Statistics.[6][7]
Australia's bond credit rating was rated AAA by all three major credit rating agencies as at December 2012.[8] At the time of the 2015 budget the Treasurer discounted any chance of a rating downgrade.[9] Around two-thirds of Australian government debt is held by non-resident investors - a share that has risen since 2009 and remains historically high.[10]
Net government debt
Net government debt is defined by the International Monetary Fund as ‘gross debt minus financial assets corresponding to debt instruments.’[11] Financial assets corresponding to debt instruments include currency and deposits, debt securities and loans. In the context of the budget, general government sector net debt is equal to the sum of deposits held, government securities (at market value), loans and other borrowing, minus the sum of cash and deposits, advances paid and investments, loans and placements.[12][13] The net debt to GDP ratio over time is influenced by a government surplus/deficit or due to growth of GDP and inflation, as well as movements in the market value of government securities which may in turn be influenced by movements in general interest rates and currency values.
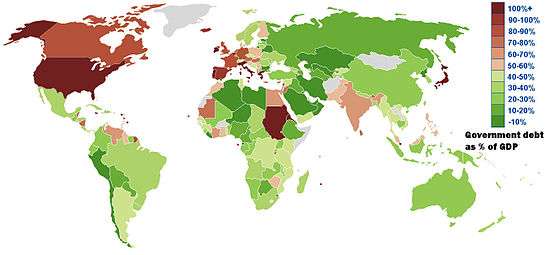
Australia's net government debt as percentage of GDP in June 2014 was 17%, much lower than most developed countries.[14] In December 2014 the MYEFO statement forecast that the net government debt at June 2015 would be $244.836 billion (an increase of $18.4 billion over the 2014 budget forecast).[13] It was expected to be $278.8 billion (16.9% of GDP) in June 2016, and was projected to peak at 18.5% of GDP in 2017/18, before declining over the medium term to 9.6% of GDP ($263 billion) in 2025/26.[15] The net government debt was zero in the 2006/07 year, the first time in three decades, from a peak of 18.5% of GDP ($96 billion) in 1995/96.[16]
Latest budget forecasts
The Treasurer in the Second Rudd Government estimated in the 2013 federal budget a budget deficit of $18 billion in 2013/14, with a return to surplus expected in the 2015 budget (FY 2015/16). In August 2013, in a budget update before the 2013 federal election, he revised the forecast to a $30.1 billion deficit for 2013/14. After the election, in December 2013, the incoming Treasurer in the Abbott Government again revised the deficit forecast for 2013/14 to $47 billion, due to the new government's decision not to implement some savings and revenue measures put forward by the Rudd Government in the 2013 budget, and an unexpected injection of $8 billion into the Reserve Bank.[17] The four-year forward estimates projected a difference of $68 billion, more than half of which was attributed to lower government revenue from taxation.[18]
The 2014 federal budget, the first by the Abbott Government, featured measures to address a perceived deficit crisis. The budget forecast a deficit for 2014/15 of $29.8 billion.[19] A budget surplus was not expected until 2023/24.[20] In December 2014, the MYEFO update increased the deficit forecast for 2014/15 to $40.4 billion.[21]
The 2015 federal budget was the eighth in a row to contain a deficit. The 2015 budget deficit for 2015/16 was expected to be $35.1 billion. In the projection of when government debt will be reduced, the treasurer only stated that "the Government has a credible path to [a budget] surplus". In the December 2015 MYEFO update, the Treasurer in the Turnbull Government forecast the government debt at June 2016 of around $426 billion and $549 billion in June 2019. By the end of the medium term (2025/26) government debt is projected to rise to around $647 billion.[15]
2012 budget forecast


In 2011/12, the Australian Government general government sector recorded an underlying cash deficit of $43.7 billion (3.0% of GDP).[22] The fiscal balance was in deficit by $44.5 billion (3.0% of GDP).
Australian Government general government sector net debt was $164 billion (11.133% of GDP), which was $16.7 billion higher than estimated at the time of the 2012 Australian federal budget. The change was primarily driven by the higher‑than‑expected market value of Commonwealth Government Securities (CGS), owing to lower than expected yields. Australian Government general government sector net financial worth was -$358.3 billion at the end of 2011/12. Net worth was $247.2 billion at the end of 2011/12.
Revenue

In 2011/12, the total Australian Government revenue was $338.1 billion, $1.7 billion higher than estimated in the 2012/13 budget.[22] Accrual taxation revenue was $316.8 billion in 2011/12, $325 million above the estimate in the 2012/13 budget, which is in line with the variation in cash receipts.
Total non-tax revenue was $21.3 billion in 2011/12, $1.4 billion higher than estimated in the 2012/13 budget. Non-tax receipts (excluding Future Fund earnings) were $17.3 billion, in line with estimates in the Budget. The largest component of the difference in outcomes between non-tax revenue and non-tax receipts (excluding Future Fund earnings) is the change in the accounting recognition of dividends from:
The Reserve Bank of Australia, a $500 million dividend has been recognised in 2011/12 instead of 2012/13, based on advice from the Australian National Audit Office; and the Australian Reinsurance Pool Corporation, reflecting a change to the timing of accrual revenue at budget, with the full amount of $400 million being recorded in 2011/12 instead of over the forward estimates.
Debt ceiling
A debt ceiling on how much the Australian government could borrow was created in 2007 by the Rudd Government and set at $75 billion. It was increased in 2009 to $200 billion,[23] $250 billion in 2011 and $300 billion in May 2012. In November 2013, Treasurer Joe Hockey requested Parliament's approval for an increase in the debt limit from $300 billion to $500 billion, saying that the limit will be exhausted by mid-December 2013.[24] With the support of the Australian Greens, the Abbott Government repealed the debt ceiling over the opposition of the Australian Labor Party.
The debt ceiling was contained in s.5 of the Commonwealth Inscribed Stock Act 1911,[25] until its repeal in December 2013.[26]
See also
- Australian federal budget
- Government budget
- List of sovereign states by public debt
- Taxation in Australia
References
- ↑ "Table H12: Government securities on issue at 30 June 2004 to 2015 (summary))". Statistical Tables. Reserve Bank of Australia. Retrieved 20 January 2016.
- ↑ Parliamentary Library Government debt
- ↑ "Role and Function". Commonwealth of Australia. Retrieved 2 February 2013.
- ↑ AOFM: Commonwealth Government Securities On Issue
- ↑ "Questions & Answers about the Guarantee on Deposits". http://www.guaranteescheme.gov.au. External link in
|work=(help) - ↑ "5302.0 - Balance of Payments and International Investment Position, Australia, Sep 2014". abs.gov.au. Australian Bureau of Statistics.
- ↑ "Country Report Australia - Rabobank, Economic Research". Rabobank.
- ↑ Michael Janda (21 December 2013). "Australian debt still AAA despite surplus miss". ABC News. Australian Broadcasting Corporation. Retrieved 2 February 2013.
- ↑ Matt Siegel and Paul Ingrassia (1 May 2015). "Australia's AAA rating not in danger, Joe Hockey says". The Sydney Morning Herald. Fairfax Media. Retrieved 5 May 2015.
- ↑ The Age, 29 January 2016, Treasury secretary John Fraser: Australia has a spending and a revenue problem.
- ↑ International Monetary Fund, Government Finance Statistics Manual 2014
- ↑ Parliament of Australia, The Australian Government’s current debt position – April 2015 update
- 1 2 MYEFO 2014-15, p.94.
- ↑ Government net & gross debt 2014, International Monetary Fund, April 2015 World Economic Outlook Databse.
- 1 2 "Part 3: Fiscal Strategy and Outlook (continued), Attachment E: Debt Statement". Commonwealth of Australia. Retrieved 21 January 2016.
- ↑ Budget 2006-07, Australian Government is now debt free
- ↑ Tom Allard (26 October 2013). "Hockey has promises to keep in budget battle". Sydney Morning Herald. Retrieved 14 May 2014.
- ↑ "Has the Government doubled the budget deficit?". ABC News: FactCheck. Australian Broadcasting Corporation. 6 May 2014. Retrieved 10 May 2014.
- ↑ "Appendix A – Budget aggregates". 2014–15 Commonwealth Budget – Budget Overview. Commonwealth of Australia. Retrieved 15 May 2014.
- ↑ David Crowe & David Uren (9 May 2014). "Joe Hockey to swing axe on public sector". The Australian. News Limited. Retrieved 9 May 2014.
- ↑ Emma Griffiths (15 December 2014). "MYEFO: Budget deficit forecast for 2014-15 increases $10 billion to $40.4 billion". ABC News. Australian Broadcasting Corporation. Retrieved 11 May 2015.
- 1 2 Final Budget Outcome: Australian Government Budget Outcome. Australian Government. Retrieved 2 February 2013.
- ↑ The Age, 24 October 2013 - Debt ceiling - all because of West Wing?
- ↑ The Age, 14 November 2013.
- ↑ Commonwealth Inscribed Stock Act 1911, s.5
- ↑ Commonwealth Inscribed Stock Amendment Act 2013
External links
| Wikimedia Commons has media related to Statistics about bonds in Australia. |
- Australian Office of Financial Management
- Katrina Di Marco, Mitchell Pirie and Wilson Au-Yeung: A history of public debt in Australia, Treasury, Commonwealth of Australia. (ca. 2011).
- Debt Statistics for Australia
- Australian government debt clock
| History | |
|---|---|
| Currency | |
| State economies | |
| Industries | |
| Taxation | |
| Banking and Finance | |
| Regulatory agencies | |
| Energy | |
| Economic conditions | |
| Unions | |
| Trade agreements | |
| |