Area chart
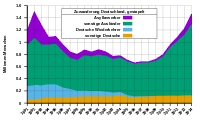
An area chart or area graph displays graphically quantitative data. It is based on the line chart. The area between axis and line are commonly emphasized with colors, textures and hatchings. Commonly one compares with an area chart two or more quantities.
History
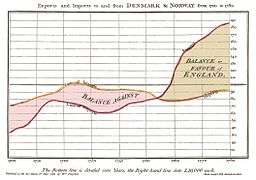
William Playfair is usually credited with inventing the area charts as well as the line, bar, and pie charts. His book The Commercial and Political Atlas, published in 1786, contained a number of time-series graphs, including Interest of the National Debt from the Revolution and Chart of all the Imports and Exports to and from England from the Year 1700 to 1782 that are often described as the first area charts in history.[1][2]
|

Common uses
Area charts are used to represent cumulated totals using numbers or percentages (stacked area charts in this case) over time. Use the area chart for showing trends over time among related attributes. The area chart is like the plot chart except that the area below the plotted line is filled in with color to indicate volume.
When multiple attributes are included, the first attribute is plotted as a line with color fill followed by the second attribute, and so on.
Variations
Area charts which use vertical and horizontal lines to connect the data points in a series forming a step-like progression are called step-area charts.
Area charts in which data points are connected by smooth curves instead of straight lines are called spline-area charts.[3]
See also
References
- ↑ Playfair, William; Wainer, Howard; Spence, Ian (2005). Playfair's Commercial and Political Atlas and Statistical Breviary. Cambridge University Press. ISBN 9780521855549.
- ↑ Tufte, Edward (1983). The Visual Display of Quantitative Information. Cheshire, Connecticut: Graphics Press. p. 13. ISBN 0961392142.
- ↑ "Area, Spline-Area, Step-Area Charts". AnyChart. Retrieved 29 December 2015.
| Wikimedia Commons has media related to Area charts. |