Andover, Connecticut
| Andover, Connecticut | ||
|---|---|---|
| Town | ||
| ||
 Location in Tolland County, Connecticut | ||
| Coordinates: 41°43′58″N 72°22′29″W / 41.73278°N 72.37472°WCoordinates: 41°43′58″N 72°22′29″W / 41.73278°N 72.37472°W | ||
| Country | United States | |
| State | Connecticut | |
| NECTA | Hartford | |
| Region | Capitol Region | |
| Incorporated | 1848 | |
| Government | ||
| • Type | Selectman-town meeting | |
| • First Selectman | Jonathan P. Zabel (R) | |
| • Selectmen |
Jeff Maguire (D) Jay K. Linddy Julia Haverl (D) Cathleen Desrosiers (R) | |
| Area | ||
| • Total | 15.7 sq mi (40.7 km2) | |
| • Land | 15.5 sq mi (40.0 km2) | |
| • Water | 0.2 sq mi (0.6 km2) | |
| Elevation | 400 ft (122 m) | |
| Population (2010)[1] | ||
| • Total | 3,303 | |
| Time zone | Eastern (UTC-5) | |
| • Summer (DST) | Eastern (UTC-4) | |
| ZIP code | 06232 | |
| Area code(s) | 860 | |
| FIPS code | 09-01080 | |
| GNIS feature ID | 0213382 | |
| Website |
andoverconnecticut | |

Andover is a rural town in Tolland County, Connecticut, United States. The population was 3,303 at the 2010 census.
Andover was incorporated on May 18, 1848, from Hebron and Coventry.
Geography
According to the United States Census Bureau, the town has a total area of 15.7 square miles (41 km2), of which, 15.5 square miles (40 km2) of it is land and 0.2 square miles (0.52 km2) of it (1.53%) is water. Most of the water of that is Andover Lake.
Demographics
| Historical population | |||
|---|---|---|---|
| Census | Pop. | %± | |
| 1850 | 500 | — | |
| 1860 | 517 | 3.4% | |
| 1870 | 461 | −10.8% | |
| 1880 | 428 | −7.2% | |
| 1890 | 401 | −6.3% | |
| 1900 | 385 | −4.0% | |
| 1910 | 371 | −3.6% | |
| 1920 | 389 | 4.9% | |
| 1930 | 430 | 10.5% | |
| 1940 | 560 | 30.2% | |
| 1950 | 1,034 | 84.6% | |
| 1960 | 1,771 | 71.3% | |
| 1970 | 2,099 | 18.5% | |
| 1980 | 2,144 | 2.1% | |
| 1990 | 2,540 | 18.5% | |
| 2000 | 3,036 | 19.5% | |
| 2010 | 3,303 | 8.8% | |
| Est. 2014 | 3,272 | [2] | −0.9% |
| Historical population of Andover | |
| 1850 | 500 |
| 1860 | 517 |
| 1870 | 461 |
| 1880 | 428 |
| 1890 | 401 |
| 1900 | 385 |
| 1910 | 371 |
| 1920 | 389 |
| 1930 | 430 |
| 1940 | 560 |
| 1950 | 1,034 |
| 1960 | 1,771 |
| 1970 | 2,099 |
| 1980 | 2,144 |
| 1990 | 2,540 |
| 2000 | 3,036 |
| 2010 | 3,303 |
As of the 2010 United States Census Andover had a population of 3,303. The racial composition of the population was 95.9% white, 1.1% black or African American, 0.1% Native American, 1.1% Asian, 0.5% from some other race and 1.2% reporting two or more race. 1.6% of the population was Hispanic or Latino of any race.[4]
As of the census[5] of 2000, there were 3,036 people, 1,150 households, and 861 families residing in the town. The population density was 196.4 people per square mile (75.8/km²). There were 1,198 housing units at an average density of 77.5 per square mile (29.9/km²). The racial makeup of the town was 96.64% White, 0.92% African American, 0.33% Native American, 0.46% Asian, 0.69% from other races, and 0.96% from two or more races. Hispanic or Latino of any race were 1.55% of the population.
There were 1,150 households out of which 37.5% had children under the age of 18 living with them, 64.3% were married couples living together, 8.0% had a female householder with no husband present, and 25.1% were non-families. 19.0% of all households were made up of individuals and 5.6% had someone living alone who was 65 years of age or older. The average household size was 2.64 and the average family size was 3.04.
In the town the population was spread out with 27.3% under the age of 18, 4.3% from 18 to 24, 34.9% from 25 to 44, 25.7% from 45 to 64, and 7.7% who were 65 years of age or older. The median age was 38 years. For every 100 females there were 102.1 males. For every 100 females age 18 and over, there were 98.2 males.
The median income for a household in the town was $23,456, and the median income for a family was $45,234. Males had a median income of $21,543 versus $18,167 for females. The per capita income for the town was $30,273. About 2.3% of families and 3.6% of the population were below the poverty line, including 2.8% of those under age 18 and 4.8% of those age 65 or over.
Voter Registration
| Voter Registration and Party Enrollment as of October 27, 2015[6] | |||||
|---|---|---|---|---|---|
| Party | Active Voters | Inactive Voters | Total Voters | Percentage | |
| Democratic | 665 | 9 | 674 | 31.79% | |
| Republican | 536 | 11 | 547 | 25.80% | |
| Unaffiliated | 836 | 35 | 871 | 41.08% | |
| Minor Parties | 27 | 1 | 28 | 1.27% | |
| Total | 2,064 | 56 | 2,120 | 100% | |
External links
References
- ↑ U.S. Census Bureau Population Estimates
- ↑ "Annual Estimates of the Resident Population for Incorporated Places: April 1, 2010 to July 1, 2014". Retrieved June 4, 2015.
- ↑ "Census of Population and Housing". Census.gov. Archived from the original on May 11, 2015. Retrieved June 4, 2015.
- ↑ 2010 race and Hispanic or Latino by place chart for Connecticut from the US Census
- ↑ "American FactFinder". United States Census Bureau. Archived from the original on 2013-09-11. Retrieved 2008-01-31.
- ↑ "Registration and Party Enrollment Statistics as of October 27, 2015" (PDF). Connecticut Secretary of State. Archived (PDF) from the original on 2016-03-04. Retrieved 2016-04-26.
Municipalities and communities of Tolland County, Connecticut, United States | ||
|---|---|---|
| Towns | 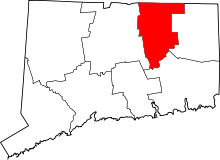 | |
| Other communities | ||