Alpine climate
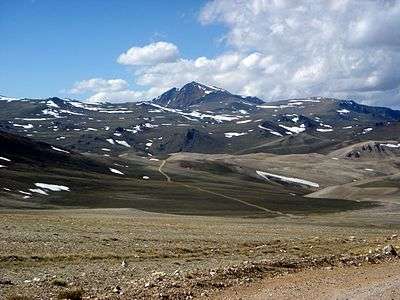
Alpine climate is the average weather (climate) for the regions above the tree line. This climate is also referred to as a mountain climate or highland climate.
Definition
There are multiple definitions of alpine climate.
One simple definition is the climate which causes trees to fail to grow due to cold. According to the Holdridge life zone system, alpine climate occurs when the mean biotemperature of a location is between 1.5 and 3 °C (34.7 and 37.4 °F), which prevents tree growth. Biotemperature is defined as the temperature, except all temperatures below 0 °C (32 °F) are treated as 0 °C (32 °F), because plants are dormant below freezing.[1]
In the Köppen climate classification, the alpine climate is part of "Group E", along with the polar climate, where no month has a mean temperature higher than 10 °C (50 °F).[2]
Cause
The temperature profile of the atmosphere is a result of an interaction between radiation and convection. Sunlight in the visible spectrum hits the ground and heats it. The ground then heats the air at the surface. If radiation were the only way to transfer heat from the ground to space, the greenhouse effect of gases in the atmosphere would keep the ground at roughly 333 K (60 °C; 140 °F), and the temperature would decay exponentially with height.[3]
However, when air is hot, it tends to expand, which lowers its density. Thus, hot air tends to rise and transfer heat upward. This is the process of convection. Convection comes to equilibrium when a parcel at air at a given altitude has the same density as its surroundings. Air is a poor conductor of heat, so a parcel of air will rise and fall without exchanging heat. This is known as an adiabatic process, which has a characteristic pressure-temperature curve. As the pressure gets lower, the temperature decreases. The rate of decrease of temperature with elevation is known as the adiabatic lapse rate, which is approximately 9.8 °C per kilometre (or 5.4 °F per 1000 feet) of altitude.[3]
Note that the presence of water in the atmosphere complicates the process of convection. Water vapor contains latent heat of vaporization. As air rises and cools, it eventually becomes saturated and cannot hold its quantity of water vapor. The water vapor condenses (forming clouds), and releases heat, which changes the lapse rate from the dry adiabatic lapse rate to the moist adiabatic lapse rate (5.5 °C per kilometre or 3 °F per 1000 feet).[4] The actual lapse rate, called the environmental lapse rate, is not constant (it can fluctuate throughout the day or seasonally and also regionally), but a normal lapse rate is 5.5 °C per 1,000 m (3.57 °F per 1,000 ft).[5][6] Therefore, moving up 100 metres (330 ft) on a mountain is roughly equivalent to moving 80 kilometres (45 miles or 0.75° of latitude) towards the pole.[7] This relationship is only approximate, however, since local factors, such as proximity to oceans, can drastically modify the climate.[8] As the altitude increases, the main form of precipitation becomes snow and the winds increase. The temperature continues to drop until the tropopause, at 11,000 metres (36,000 ft), where it does not decrease further. However, this is higher than the highest summit.
Distribution
Although this climate classification only covers a small portion of the Earth's surface, alpine climates are widely distributed. For example, The Sierra Nevada, the Cascade Mountains, the Rocky Mountains, the Appalachian Mountains, the summit of Mauna Loa in Hawaii, the Alps, the Snowy Mountains in Australia, the Spanish Pyrenees, Cantabrian Mountains and Sierra Nevada, the Andes, the Himalayas, the Tibetan Plateau, Gansu China, Qinghai, the Eastern Highlands of Africa, high elevations in the Atlas Mountains and the central parts of Borneo and New Guinea.
The lowest altitude of alpine climate varies dramatically by latitude. If alpine climate is defined by the tree line, then it occurs as low as 650 metres (2,130 ft) at 68°N in Sweden,[9] while on Mount Kilimanjaro in Africa, alpine and the tree line occurs at 3,950 metres (12,960 ft).[9]
Monthly variability
The variability of the alpine climate throughout the year depends on the latitude of the location. For tropical locations, such as the summit of Mauna Loa, the temperature is roughly constant throughout the year:
| Climate data for Mauna Loa slope observatory (1961–1990) | |||||||||||||
|---|---|---|---|---|---|---|---|---|---|---|---|---|---|
| Month | Jan | Feb | Mar | Apr | May | Jun | Jul | Aug | Sep | Oct | Nov | Dec | Year |
| Record high °F (°C) | 67 (19) |
85 (29) |
65 (18) |
67 (19) |
68 (20) |
71 (22) |
70 (21) |
68 (20) |
67 (19) |
66 (19) |
65 (18) |
67 (19) |
85 (29) |
| Average high °F (°C) | 49.8 (9.9) |
49.6 (9.8) |
50.2 (10.1) |
51.8 (11) |
53.9 (12.2) |
57.2 (14) |
56.4 (13.6) |
56.3 (13.5) |
55.8 (13.2) |
54.7 (12.6) |
52.6 (11.4) |
50.6 (10.3) |
53.24 (11.8) |
| Average low °F (°C) | 33.3 (0.7) |
32.9 (0.5) |
33.2 (0.7) |
34.6 (1.4) |
36.6 (2.6) |
39.4 (4.1) |
38.8 (3.8) |
38.9 (3.8) |
38.5 (3.6) |
37.8 (3.2) |
36.2 (2.3) |
34.3 (1.3) |
36.21 (2.33) |
| Record low °F (°C) | 19 (−7) |
18 (−8) |
20 (−7) |
24 (−4) |
27 (−3) |
28 (−2) |
26 (−3) |
28 (−2) |
29 (−2) |
27 (−3) |
25 (−4) |
22 (−6) |
18 (−8) |
| Average precipitation inches (mm) | 2.3 (58) |
1.5 (38) |
1.7 (43) |
1.3 (33) |
1.0 (25) |
0.5 (13) |
1.1 (28) |
1.5 (38) |
1.3 (33) |
1.1 (28) |
1.7 (43) |
2.0 (51) |
17 (431) |
| Average snowfall inches (cm) | 0.0 (0) |
1.0 (2.5) |
0.3 (0.8) |
1.3 (3.3) |
0.0 (0) |
0.0 (0) |
0.0 (0) |
0.0 (0) |
0.0 (0) |
0.0 (0) |
0.0 (0) |
1.0 (2.5) |
3.6 (9.1) |
| Average precipitation days (≥ 0.01 inch) | 4 | 5 | 6 | 5 | 4 | 3 | 4 | 5 | 5 | 5 | 5 | 4 | 55 |
| Source: NOAA[10] | |||||||||||||
For mid-latitude locations, such as Mount Washington the temperature varies, but never gets very warm:
| Climate data for Mount Washington, elev. 6,267 ft (1,910.2 m) near the summit | |||||||||||||
|---|---|---|---|---|---|---|---|---|---|---|---|---|---|
| Month | Jan | Feb | Mar | Apr | May | Jun | Jul | Aug | Sep | Oct | Nov | Dec | Year |
| Record high °F (°C) | 48 (9) |
43 (6) |
54 (12) |
60 (16) |
66 (19) |
72 (22) |
71 (22) |
72 (22) |
69 (21) |
62 (17) |
52 (11) |
47 (8) |
72 (22) |
| Average high °F (°C) | 13.6 (−10.2) |
14.7 (−9.6) |
20.7 (−6.3) |
30.4 (−0.9) |
41.3 (5.2) |
50.4 (10.2) |
54.1 (12.3) |
53.3 (11.8) |
47.1 (8.4) |
36.4 (2.4) |
28.1 (−2.2) |
18.4 (−7.6) |
34.0 (1.1) |
| Daily mean °F (°C) | 4.8 (−15.1) |
6.2 (−14.3) |
12.9 (−10.6) |
23.9 (−4.5) |
35.6 (2) |
45.0 (7.2) |
49.1 (9.5) |
48.2 (9) |
41.6 (5.3) |
30.2 (−1) |
20.7 (−6.3) |
10.1 (−12.2) |
27.36 (−2.58) |
| Average low °F (°C) | −4.1 (−20.1) |
−2.4 (−19.1) |
5.0 (−15) |
17.4 (−8.1) |
29.8 (−1.2) |
39.5 (4.2) |
44.0 (6.7) |
43.0 (6.1) |
36.1 (2.3) |
24.0 (−4.4) |
13.3 (−10.4) |
1.7 (−16.8) |
20.6 (−6.3) |
| Record low °F (°C) | −47 (−44) |
−46 (−43) |
−38 (−39) |
−20 (−29) |
−2 (−19) |
8 (−13) |
24 (−4) |
20 (−7) |
9 (−13) |
−5 (−21) |
−20 (−29) |
−46 (−43) |
−47 (−44) |
| Average precipitation inches (mm) | 6.44 (163.6) |
6.77 (172) |
7.67 (194.8) |
7.44 (189) |
8.18 (207.8) |
8.40 (213.4) |
8.77 (222.8) |
8.32 (211.3) |
8.03 (204) |
9.27 (235.5) |
9.85 (250.2) |
7.73 (196.3) |
96.87 (2,460.5) |
| Average snowfall inches (cm) | 44.0 (111.8) |
40.1 (101.9) |
45.1 (114.6) |
35.6 (90.4) |
12.2 (31) |
1.0 (2.5) |
trace | 0.1 (0.3) |
2.2 (5.6) |
17.6 (44.7) |
37.8 (96) |
45.5 (115.6) |
281.2 (714.2) |
| Average precipitation days (≥ 0.01 in) | 19.7 | 17.9 | 19.0 | 17.4 | 17.4 | 16.8 | 16.5 | 15.2 | 13.9 | 16.8 | 19.1 | 20.7 | 210.4 |
| Average snowy days (≥ 0.1 in) | 19.3 | 17.3 | 16.6 | 13.1 | 6.4 | 0.9 | 0.1 | 0.2 | 1.7 | 9.1 | 14.6 | 19.2 | 118.5 |
| Mean monthly sunshine hours | 92.0 | 106.9 | 127.6 | 143.2 | 171.3 | 151.3 | 145.0 | 130.5 | 127.2 | 127.1 | 82.4 | 83.1 | 1,487.6 |
| Percent possible sunshine | 32 | 36 | 34 | 35 | 37 | 33 | 31 | 30 | 34 | 37 | 29 | 30 | 33 |
| Source #1: NOAA (normals 1981–2010, sun 1961–1990)[11][12][13] | |||||||||||||
| Source #2: extremes 1933–present[14][15] | |||||||||||||
See also
References
- ↑ Lugo, A. E. (1999). "The Holdridge life zones of the conterminous United States in relation to ecosystem mapping" (PDF). Journal of Biogeography. 26: 1025–1038. doi:10.1046/j.1365-2699.1999.00329.x. Retrieved 27 May 2015.
- ↑ McKnight, Tom L; Hess, Darrel (2000). "Climate Zones and Types: The Köppen System". Physical Geography: A Landscape Appreciation. Upper Saddle River, New Jersey: Prentice Hall. pp. 235–7. ISBN 0-13-020263-0.
- 1 2 Goody, Richard M.; Walker, James C.G. (1972). "Atmospheric Temperatures" (PDF). Atmospheres. Prentice-Hall.
- ↑ "Dry Adibatic Lapse Rate". tpub.com. Retrieved 2016-05-02.
- ↑ "Adiabatic Lapse Rate". Goldbook. IUPAC.
- ↑ Dommasch, Daniel O. (1961). Airplane Aerodynamics (3rd ed.). Pitman Publishing Co. p. 22.
- ↑ "Mountain Environments" (PDF). United Nations Environment Programme World Conservation Monitoring Centre. Archived from the original (PDF) on 2011-08-25.
- ↑ "Factors affecting climate". The United Kingdom Environmental Change Network. Archived from the original on 2011-07-16.
- 1 2 Körner, Ch (1998). "A re-assessment of high elevation treeline positions and their explanation" (PDF). Oecologia. 115 (4): 445–459. doi:10.1007/s004420050540.
- ↑ "Period of Record Monthly Climate Summary". MAUNA LOA SLOPE OBS, HAWAII. NOAA. Retrieved 2012-06-05.
- ↑ "NOWData – NOAA Online Weather Data". National Oceanic and Atmospheric Administration. Retrieved June 19, 2013.
- ↑ "Station Name: NH MT WASHINGTON". National Oceanic and Atmospheric Administration. Retrieved 9 June 2014.
- ↑ "WMO Climate Normals for MOUNT WASHINGTON, NH 1961–1990". National Oceanic and Atmospheric Administration. Retrieved 9 June 2014.
- ↑ "Mount Washington Observatory: Normals, Means and Extreme". Mount Washington Observatory. Retrieved 7 August 2010.
- ↑ "Today's Weather atop Mount Washington". Mount Washington Observatory. 14 January 2013. Archived from the original on 14 January 2013.