Allan variance
The Allan variance (AVAR), also known as two-sample variance, is a measure of frequency stability in clocks, oscillators and amplifiers. It is named after David W. Allan. It is expressed mathematically as

The Allan deviation (ADEV) is the square root of Allan variance. It is also known as sigma-tau, and is expressed mathematically as

The M-sample variance is a measure of frequency stability using M samples, time T between measures and observation time . M-sample variance is expressed as


The Allan variance is intended to estimate stability due to noise processes and not that of systematic errors or imperfections such as frequency drift or temperature effects. The Allan variance and Allan deviation describe frequency stability, i.e. the stability in frequency. See also the section entitled "Interpretation of value" below.
There are also different adaptations or alterations of Allan variance, notably the modified Allan variance MAVAR or MVAR, the total variance, and the Hadamard variance. There also exist time stability variants such as time deviation TDEV or time variance TVAR. Allan variance and its variants have proven useful outside the scope of timekeeping and are a set of improved statistical tools to use whenever the noise processes are not unconditionally stable, thus a derivative exists.
The general M-sample variance remains important since it allows dead time in measurements and bias functions allows conversion into Allan variance values. Nevertheless, for most applications the special case of 2-sample, or "Allan variance" with is of greatest interest.


Background
When investigating the stability of crystal oscillators and atomic clocks it was found that they did not have a phase noise consisting only of white noise, but also of white frequency noise and flicker frequency noise. These noise forms become a challenge for traditional statistical tools such as standard deviation as the estimator will not converge. The noise is thus said to be divergent. Early efforts in analysing the stability included both theoretical analysis and practical measurements.[1][2]
An important side-consequence of having these types of noise was that, since the various methods of measurements did not agree with each other, the key aspect of repeatability of a measurement could not be achieved. This limits the possibility to compare sources and make meaningful specifications to require from suppliers. Essentially all forms of scientific and commercial uses were then limited to dedicated measurements which hopefully would capture the need for that application.
To address these problems, David Allan introduced the M-sample variance and (indirectly) the two-sample variance.[3] While the two-sample variance did not completely allow all types of noise to be distinguished, it provided a means to meaningfully separate many noise-forms for time-series of phase or frequency measurements between two or more oscillators. Allan provided a method to convert between any M-sample variance to any N-sample variance via the common 2-sample variance, thus making all M-sample variances comparable. The conversion mechanism also proved that M-sample variance does not converge for large M, thus making them less useful. IEEE later identified the 2-sample variance as the preferred measure.[4]
An early concern was related to time and frequency measurement instruments which had a dead time between measurements. Such a series of measurements did not form a continuous observation of the signal and thus introduced a systematic bias into the measurement. Great care was spent in estimating these biases. The introduction of zero dead time counters removed the need, but the bias analysis tools have proved useful.
Another early aspect of concern was related to how the bandwidth of the measurement instrument would influence the measurement, such that it needed to be noted. It was later found that by algorithmically changing the observation , only low values would be affected while higher values would be unaffected. The change of is done by letting it be an integer multiple of the measurement timebase .


The physics of crystal oscillators were analyzed by D. B. Leeson[2] and the result is now referred to as Leeson's equation. The feedback in the oscillator will make the white noise and flicker noise of the feedback amplifier and crystal become the power-law noises of white frequency noise and flicker frequency noise respectively. These noise forms have the effect that the standard variance estimator does not converge when processing time error samples. This mechanics of the feedback oscillators was unknown when the work on oscillator stability started but was presented by Leeson at the same time as the statistical tools was made available by David W. Allan. For a more thorough presentation on the Leeson effect see modern phase noise literature.[5]


Interpretation of value
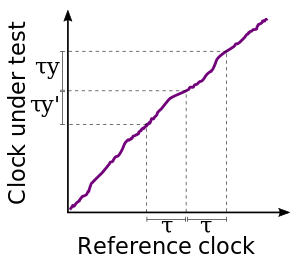
Allan variance is defined as one half of the time average of the squares of the differences between successive readings of the frequency deviation sampled over the sampling period. The Allan variance depends on the time period used between samples: therefore it is a function of the sample period, commonly denoted as τ, likewise the distribution being measured, and is displayed as a graph rather than a single number. A low Allan variance is a characteristic of a clock with good stability over the measured period.
Allan deviation is widely used for plots (conveniently in log-log format) and presentation of numbers. It is preferred as it gives the relative amplitude stability, allowing ease of comparison with other sources of errors.
An Allan deviation of 1.3×10⁻⁹ at observation time 1 s (i.e. τ = 1 s) should be interpreted as there being an instability in frequency between two observations a second apart with a relative root mean square (RMS) value of 1.3×10⁻⁹. For a 10-MHz clock, this would be equivalent to 13 mHz RMS movement. If the phase stability of an oscillator is needed then the time deviation variants should be consulted and used.
One may convert the Allan variance and other time-domain variances into frequency-domain measures of time (phase) and frequency stability. The following link shows these relationships and how to perform these conversions: http://www.allanstime.com/Publications/DWA/Conversion_from_Allan_variance_to_Spectral_Densities.pdf
Definitions
M-sample variance
The -sample variance is defined[3] (here in a modernized notation form) as

![\sigma _{y}^{2}(M,T,\tau )={\frac {1}{M-1}}\left\{\sum _{{i=0}}^{{M-1}}\left[{\frac {x(iT+\tau )-x(iT)}{\tau }}\right]^{2}-{\frac {1}{M}}\left[\sum _{{i=0}}^{{M-1}}{\frac {x(iT+\tau )-x(iT)}{\tau }}\right]^{2}\right\}](../I/m/0ce77d4bdb1c3e2dcce0fc1ce9639552eaf9c24f.svg)
where is the phase angle (in radians) measured at time , or with average fractional frequency time series


![\sigma _{y}^{2}(M,T,\tau )={\frac {1}{M-1}}\left\{\sum _{{i=0}}^{{M-1}}{\bar {y}}_{i}^{2}-{\frac {1}{M}}\left[\sum _{{i=0}}^{{M-1}}{\bar {y}}_{i}\right]^{2}\right\}](../I/m/b6f2499dc8fa4331585b085b2c71d8ff23cd8afa.svg)
where is the number of frequency samples used in variance, is the time between each frequency sample and is the time-length of each frequency estimate.

An important aspect is that -sample variance model can include dead-time by letting the time be different from that of .
Allan variance
The Allan variance is defined as

which is conveniently expressed as

where is the observation period, is the nth fractional frequency average over the observation time .

The samples are taken with no dead-time between them, which is achieved by letting

Allan deviation
Just as with standard deviation and variance, the Allan deviation is defined as the square root of the Allan variance.

Supporting definitions
Oscillator model
The oscillator being analysed is assumed to follow the basic model of

The oscillator is assumed to have a nominal frequency of , given in cycles per second (SI unit: hertz). The nominal angular frequency (in radians per second) is given by


The total phase can be separated into a perfectly cyclic component , along with a fluctuating component :


Time error
The time error function x(t) is the difference between expected nominal time and actual normal time

For measured values a time error series TE(t) is defined from the reference time function TREF(t) as

Frequency function
The frequency function is the frequency over time defined as


Fractional frequency
The fractional frequency y(t) is the normalized difference between the frequency and the nominal frequency :

Average fractional frequency
The average fractional frequency is defined as

where the average is taken over observation time τ, the y(t) is the fractional frequency error at time t and τ is the observation time.
Since y(t) is the derivative of x(t), we can without loss of generality rewrite it as

Estimators
The definition is based on the statistical expected value, integrating over infinite time. Real world situation does not allow for such time-series, in which case a statistical estimator needs to be used in its place. A number of different estimators will be presented and discussed.
Conventions
- The number of frequency samples in a fractional frequency series is denoted with M.
- The number of time error samples in a time error series is denoted with N.
The relation between the number of fractional frequency samples and time error series is fixed in the relationship

- For time error sample series, xi denotes the i-th sample of the continuous time function x(t) as given by

where T is the time between measurements. For Allan variance, the time being used has T set to the observation time τ.
The time error sample series let N denote the number of samples (x0...xN-1) in the series. The traditional convention uses index 1 throughN.
- For average fractional frequency sample series, denotes the ith sample of the average continuous fractional frequency function y(t) as given by


which gives

For the Allan variance assumption of T being τ it becomes

The average fractional frequency sample series let M denote the number of samples () in the series. The traditional convention uses index 1 throughM.

As a shorthand average fractional frequency is often written without the average bar over it. This is however formally incorrect as the fractional frequency and average fractional frequency is two different functions. A measurement instrument able to produce frequency estimates with no dead-time will actually deliver a frequency average time series which only needs to be converted into average fractional frequency and may then be used directly.
- It is further a convention to let τ denote the nominal time-difference between adjacent phase or frequency samples. A time series taken for one time-difference τ0 can be used to generate Allan variance for any τ being an integer multiple of τ0 in which case τ=nτ0 is being used, and n becomes a variable for the estimator.
- The time between measurements is denoted with T, which is the sum of observation time τ and dead-time.
Fixed τ estimators
A first simple estimator would be to directly translate the definition into

or for the time series

These formulas however only provide the calculation for the τ=τ0 case. To calculate for a different value of τ, a new time-series needs to be provided.
Non-overlapped variable τ estimators
If taking the time-series and skipping past n−1 samples a new (shorter) time-series would occur with τ0 as the time between the adjacent samples, for which the Allan variance could be calculated with the simple estimators. These could be modified to introduce the new variable n such that no new time-series would have to be generated, but rather the original time series could be reused for various values of n. The estimators become

with ,

and for the time series

with .

These estimators have a significant drawback in that they will drop a significant amount of sample data as only 1/n of the available samples is being used.
Overlapped variable τ estimators
A technique presented by J.J. Snyder[6] provided an improved tool, as measurements was overlapped in n overlapped series out of the original series. The overlapping Allan variance estimator was introduced in.[7] This can be shown to be equivalent to averaging the time or normalized frequency samples in blocks of n samples prior to processing. The resulting predictors becomes

or for the time series

The overlapping estimators have far superior performance over the non-overlapping estimators as n rises and the time-series is of moderate length. The overlapped estimators have been accepted as the preferred Allan variance estimators in IEEE,[4] ITU-T[8] and ETSI[9] standards for comparable measurements such as needed for telecommunication qualification.
Modified Allan variance
In order to address the inability to separate white phase modulation from flicker phase modulation using traditional Allan variance estimators an algorithmic filtering to reduce the bandwidth by n. This filtering provides a modification to the definition and estimators and is now identifies as a separate class of variance called modified Allan variance. The modified Allan variance measure is a frequency stability measure, just as the Allan variance.
Time stability estimators
A time stability (σx) statistical measure which is often called the time deviation (TDEV) can be calculated from the modified Allan deviation (MDEV). The TDEV is based on the MDEV instead of the original Allan deviation, because the MDEV can discriminate between white and flicker phase modulation (PM). The following is the time variance estimation based on the modified Allan variance:

and similarly for modified Allan deviation to time deviation
- The TDEV is normalized so that it is equal to the classical deviation for white PM for time constant τ= τ0. To understand the normalization scale factor between the statistical measures of MDEV and TDEV, the following is the relevant statistical rule. For independent random variables X and Y, the variance (σz2) of a sum or difference (z=x-y) is the sum square of their variances (σz2 = σx2+ σy2). The variance of the sum or difference (y = x2τ-xτ) of two independent samples of a random variable is twice the variance of the random variable (σy2=2σx2). The MDEV is the second difference of independent phase measurements (x) that have a variance (σx2). Since the calculation is the double difference which requires three independent phase measurements (x2τ-2xτ+x), the modified Allan variance (MVAR) is three times the variances of the phase measurements.

Other estimators
Further developments have produced improved estimation methods for the same stability measure, the variance/deviation of frequency, but these are known by separate names such as the Hadamard variance, modified Hadamard variance, the total variance, modified total variance and the Theo variance. These distinguish themselves in better use of statistics for improved confidence bounds or ability to handle linear frequency drift.
Confidence intervals and equivalent degrees of freedom
Statistical estimators will calculate an estimated value on the sample series used. The estimates may deviate from the true value and the range of values which for some probability will contain the true value is referred to as the confidence interval. The confidence interval depends on the number of observations in the sample series, the dominant noise type, and the estimator being used. The width is also dependent on the statistical certainty for which the confidence interval values forms a bounded range, thus the statistical certainty that the true value is within that range of values. For variable-τ estimators, the τ0 multiple n is also a variable.
Confidence interval
The confidence interval can be established using chi-squared distribution by using the distribution of the sample variance:[4][7]

where s2 is the sample variance of our estimate, σ2 is the true variance value, d.f. is the degrees of freedom for the estimator and χ2 is the degrees of freedom for a certain probability. For a 90% probability, covering the range from the 5% to the 95% range on the probability curve, the upper and lower limits can be found using the inequality:

which after rearrangement for the true variance becomes:

Effective degrees of freedom
The degrees of freedom represents the number of free variables capable of contributing to the estimate. Depending on the estimator and noise type, the effective degrees of freedom varies. Estimator formulas depending on N and n has been empirically found[7] to be:
| Noise type | degrees of freedom |
| white phase modulation (WPM) | |
| flicker phase modulation (FPM) | |
| white frequency modulation (WFM) | |
| flicker frequency modulation (FFM) | |
| random walk frequency modulation (RWFM) |

![d.f.\cong \exp \left[\left(\ln {\frac {N-1}{2n}}\ln {\frac {(2n+1)(N-1)}{4}}\right)^{{-1/2}}\right]](../I/m/36660b15b326824c0067864bbec8033234b2aca9.svg)
![d.f.\cong \left[{\frac {3(N-1)}{2n}}-{\frac {2(N-2)}{N}}\right]{\frac {4n^{2}}{4n^{2}+5}}](../I/m/d9a40c017a787297d30bc5e1b2a1b1cbafd969fa.svg)


Power-law noise
The Allan variance will treat various power-law noise types differently, conveniently allowing them to be identified and their strength estimated. As a convention, the measurement system width (high corner frequency) is denoted fH.
| Power-law noise type | Phase noise slope | Frequency noise slope | Power coefficient | Phase noise | Allan variance | Allan deviation |
| white phase modulation (WPM) | ||||||
| flicker phase modulation (FPM) | ||||||
| white frequency modulation (WFM) | ||||||
| flicker frequency modulation (FFM) | ||||||
| random walk frequency modulation (RWFM) |


![\sigma _{y}^{2}(\tau )={\frac {3[\gamma +\ln(2\pi f_{H}\tau )]-\ln 2}{4\pi ^{2}\tau ^{2}}}h_{1}](../I/m/985fd9373cb87c2ba9c785ba7c0d81e6339ae325.svg)
![{\displaystyle \sigma _{y}(\tau )={\frac {\sqrt {3[\gamma +\ln(2\pi f_{H}\tau )]-\ln 2}}{2\pi \tau }}{\sqrt {h_{1}}}}](../I/m/b0367f3470faa3dc9736286f862bae7e92023182.svg)


As found in[10][11] and in modern forms.[12][13]
The Allan variance is unable to distinguish between WPM and FPM, but is able to resolve the other power-law noise types. In order to distinguish WPM and FPM, the modified Allan variance needs to be employed.
The above formulas assume that

and thus that the bandwidth of the observation time is much lower than the instruments bandwidth. When this condition is not met, all noise forms depend on the instrument's bandwidth.
α-μ mapping
The detailed mapping of a phase modulation of the form

where

or frequency modulation of the form

into the Allan variance of the form

can be significantly simplified by providing a mapping between α and μ. A mapping between α and Kα is also presented for convenience:
| α | β | μ | Kα |
| -2 | -4 | 1 | |
| -1 | -3 | 0 | |
| 0 | -2 | -1 | |
| 1 | -1 | -2 | |
| 2 | 0 | -2 |


![{\frac {3[\gamma +\ln(2\pi f_{H}\tau )]-\ln 2}{4\pi ^{2}}}](../I/m/a4dd406202f5812cefb2862240cfd67ce87454dc.svg)

The mapping is taken from.[4]
General Conversion from Phase Noise
A signal with spectral phase noise with units rad2/Hz can be converted to Allan Variance by:[13]


Linear response
While Allan variance is intended to be used to distinguish noise forms, it will depend on some but not all linear responses to time. They are given in the table:
| Linear effect | time response | frequency response | Allan variance | Allan deviation |
|---|---|---|---|---|
| phase offset | ||||
| frequency offset | ||||
| linear drift |


Thus, linear drift will contribute to output result. When measuring a real system, the linear drift or other drift mechanism may need to be estimated and removed from the time-series prior to calculating the Allan variance.[12]
Time and frequency filter properties
In analysing the properties of Allan variance and friends, it has proven useful to consider the filter properties on the normalize frequency. Starting with the definition for Allan variance for

where

Replacing the time series of with the Fourier transformed variant the Allan variance can be expressed in the frequency domain as


Thus the transfer function for Allan variance is

Bias functions
The M-sample variance, and the defined special case Allan variance, will experience systematic bias depending on different number of samples M and different relationship between T and τ. In order address these biases the bias-functions B1 and B2 has been defined[14] and allows for conversion between different M and T values.
These bias functions are not sufficient for handling the bias resulting from concatenating M samples to the Mτ0 observation time over the MT0 with has the dead-time distributed among the M measurement blocks rather than at the end of the measurement. This rendered the need for the B3 bias.[15]
The bias functions are evaluated for a particular µ value, so the α-µ mapping needs to be done for the dominant noise form as found using noise identification. Alternatively as proposed in[3] and elaborated in[14] the µ value of the dominant noise form may be inferred from the measurements using the bias functions.
B1 bias function
The B1 bias function relates the M-sample variance with the 2-sample variance (Allan variance), keeping the time between measurements T and time for each measurements τ constant, and is defined[14] as

where

The bias function becomes after analysis
![B_{1}(N,r,\mu )={\frac {1+\sum _{{n=1}}^{{N-1}}{\frac {N-n}{N(N-1)}}\left[2\left(rn\right)^{{\mu +2}}-\left(rn+1\right)^{{\mu +2}}-\left|rn-1\right|^{{\mu +2}}\right]}{1+{\frac {1}{2}}\left[2r^{{\mu +2}}-\left(r+1\right)^{{\mu +2}}-\left|r-1\right|^{{\mu +2}}\right]}}.](../I/m/74bfec5b8a2fa2c7474fd1be0d70d4ae6fa12fa0.svg)
B2 bias function
The B2 bias function relates the 2-sample variance for sample time T with the 2-sample variance (Allan variance), keeping the number of samples N=2 and the observation time τ constant, and is defined[14]

where
The bias function becomes after analysis
![B_{2}(r,\mu )={\frac {1+{\frac {1}{2}}\left[2r^{{\mu +2}}-\left(r+1\right)^{{\mu +2}}-\left|r-1\right|^{{\mu +2}}\right]}{2\left(1-2^{{\mu }}\right)}}.](../I/m/ba5e7b531288e6dbf0c13a7e5d7015713747639c.svg)
B3 bias function
The B3 bias function relates the 2-sample variance for sample time MT0 and observation time Mτ0 with the 2-sample variance (Allan variance) and is defined[15] as

where


The B3 bias function is useful to adjust non-overlapping and overlapping variable τ estimator values based on dead-time measurements of observation time τ0 and time between observations T0 to normal dead-time estimates.
The bias function becomes after analysis (for the N=2 case)
![B_{3}(2,M,r,\mu )={\frac {2M+MF(Mr)-\sum _{{n=1}}^{{M-1}}(M-n)\left[2F(nr)-F((M+n)r)+F((M-n)r)\right]}{M^{{\mu +2}}\left[F(r)+2\right]}}](../I/m/bf3757e01ad46050002c8e92a964102bad1cf125.svg)
where

τ bias function
While formally not formulated, it has been indirectly inferred as a consequence of the α-µ mapping. When comparing two Allan variance measure for different τ assuming same dominant noise in the form of same µ coefficient, a bias can be defined as

The bias function becomes after analysis

Conversion between values
In order to convert from one set of measurements to another the B1, B2 and τ bias functions can be assembled. First the B1 function converts the (N1,T1,τ1) value into (2,T1,τ1), from which the B2 function converts into a (2,τ1,τ1) value, thus the Allan variance atτ1. The Allan variance measure can be converted using the τ bias function from τ1 to τ2, from which then the (2,T2,τ2) using B2 and then finally using B1 into the (N2,T2,τ2) variance. The complete conversion becomes
![\left\langle \sigma _{y}^{2}(N_{2},T_{2},\tau _{2})\right\rangle =\left({\frac {\tau _{2}}{\tau _{1}}}\right)^{\mu }\left[{\frac {B_{1}(N_{2},r_{2},\mu )B_{2}(r_{2},\mu )}{B_{1}(N_{1},r_{1},\mu )B_{2}(r_{1},\mu )}}\right]\left\langle \sigma _{y}^{2}(N_{1},T_{1},\tau _{1})\right\rangle](../I/m/417074a90f387307614caa238546cd5ade4f1dfc.svg)
where


Similarly, for concatenated measurements using M sections, the logical extension becomes
![\left\langle \sigma _{y}^{2}(N_{2},M_{2},T_{2},\tau _{2})\right\rangle =\left({\frac {\tau _{2}}{\tau _{1}}}\right)^{\mu }\left[{\frac {B_{3}(N_{2},M_{2},r_{2},\mu )B_{1}(N_{2},r_{2},\mu )B_{2}(r_{2},\mu )}{B_{3}(N_{1},M_{1},r_{1},\mu )B_{1}(N_{1},r_{1},\mu )B_{2}(r_{1},\mu )}}\right]\left\langle \sigma _{y}^{2}(N_{1},M_{1},T_{1},\tau _{1})\right\rangle .](../I/m/808f769819828999a156d20875bf4faeddb95b05.svg)
Measurement issues
When making measurements to calculate Allan variance or Allan deviation a number of issues may cause the measurements to degenerate. Covered here is the effects specific to Allan variance, where results would be biased.
Measurement bandwidth limits
A measurement system is expected to have a bandwidth at or below that of the Nyquist rate as described within the Shannon–Hartley theorem. As can be seen in the power-law noise formulas, the white and flicker noise modulations both depends on the upper corner frequency (these systems is assumed to be low-pass filtered only). Considering the frequency filter property it can be clearly seen that low-frequency noise has greater impact on the result. For relatively flat phase modulation noise types (e.g. WPM and FPM), the filtering has relevance, whereas for noise types with greater slope the upper frequency limit becomes of less importance, assuming that the measurement system bandwidth is wide relative the as given by


When this assumption is not met, the effective bandwidth needs to be notated alongside the measurement. The interested should consult NBS TN394.[10]
If however one adjust the bandwidth of the estimator by using integer multiples of the sample time then the system bandwidth impact can be reduced to insignificant levels. For telecommunication needs, such methods have been required in order to ensure comparability of measurements and allow some freedom for vendors to do different implementations. The ITU-T Rec. G.813[16] for the TDEV measurement.

It can be recommended that the first multiples be ignored such that the majority of the detected noise is well within the passband of the measurement systems bandwidth.
Further developments on the Allan variance was performed to let the hardware bandwidth be reduced by software means. This development of a software bandwidth allowed for addressing the remaining noise and the method is now referred to modified Allan variance. This bandwidth reduction technique should not be confused with the enhanced variant of modified Allan variance which also changes a smoothing filter bandwidth.
Dead time in measurements
Many measurement instruments of time and frequency have the stages of arming time, time-base time, processing time and may then re-trigger the arming. The arming time is from the time the arming is triggered to when the start event occurs on the start channel. The time-base then ensures that minimum amount of time goes prior to accepting an event on the stop channel as the stop event. The number of events and time elapsed between the start event and stop event is recorded and presented during the processing time. When the processing occurs (also known as the dwell time) the instrument is usually unable to do another measurement. After the processing has occurred, an instrument in continuous mode triggers the arm circuit again. The time between the stop event and the following start event becomes dead time during which the signal is not being observed. Such dead time introduces systematic measurement biases, which needs to be compensated for in order to get proper results. For such measurement systems will the time T denote the time between the adjacent start events (and thus measurements) while denote the time-base length, i.e. the nominal length between the start and stop event of any measurement.
Dead time effects on measurements have such an impact on the produced result that much study of the field have been done in order to quantify its properties properly. The introduction of zero dead-time counters removed the need for this analysis. A zero dead-time counter has the property that the stop-event of one measurement is also being used as the start-event of the following event. Such counters creates a series of event and time timestamp pairs, one for each channel spaced by the time-base. Such measurements have also proved useful in order forms of time-series analysis.
Measurements being performed with dead time can be corrected using the bias function B1, B2 and B3. Thus, dead time as such is not prohibiting the access to the Allan variance, but it makes it more problematic. The dead time must be known such that the time between samples T can be established.
Measurement length and effective use of samples
Studying the effect on the confidence intervals that the length N of the sample series have, and the effect of the variable τ parameter n the confidence intervals may become very large since the effective degree of freedom may become small for some combination of N and n for the dominant noise-form (for that τ).
The effect may be that the estimated value may be much smaller or much greater than the real value, which may lead to false conclusions of the result.
It is recommended that the confidence interval is plotted along with the data, such that the reader of the plot is able to be aware of the statistical uncertainty of the values.
It is recommended that the length of the sample sequence, i.e. the number of samples N is kept high to ensure that confidence interval is small over the τ-range of interest.
It is recommended that the τ-range as swept by the τ0 multiplier n is limited in the upper end relative N such that the read of the plot is not being confused by highly unstable estimator values.
It is recommended that estimators providing better degrees of freedom values be used in replacement of the Allan variance estimators or as complementing them where they outperform the Allan variance estimators. Among those the Total variance and Theo variance estimators should be considered.
Dominant noise type
A large number of conversion constants, bias corrections and confidence intervals depends on the dominant noise type. For proper interpretation shall the dominant noise type for the particular τ of interest be identified through noise identification. Failing to identify the dominant noise type will produce biased values. Some of these biases may be of several order of magnitude, so it may be of large significance.
Linear drift
Systematic effects on the signal is only partly cancelled. Phase and frequency offset is cancelled, but linear drift or other high degree forms of polynomial phase curves will not be cancelled and thus form a measurement limitation. Curve fitting and removal of systematic offset could be employed. Often removal of linear drift can be sufficient. Use of linear drift estimators such as the Hadamard variance could also be employed. A linear drift removal could be employed using a moment based estimator.
Measurement instrument estimator bias
Traditional instruments provided only the measurement of single events or event pairs. The introduction of the improved statistical tool of overlapping measurements by J.J. Snyder[6] allowed for much improved resolution in frequency readouts, breaking the traditional digits/time-base balance. While such methods is useful for their intended purpose, using such smoothed measurements for Allan variance calculations would give a false impression of high resolution,[17][18][19] but for longer τ the effect is gradually removed and the lower τ region of the measurement has biased values. This bias is providing lower values than it should, so it is an overoptimistic (assuming that low numbers is what one wishes) bias reducing the usability of the measurement rather than improving it. Such smart algorithms can usually be disabled or otherwise circumvented by using time-stamp mode which is much preferred if available.
Practical measurements
While several approaches to measurement of Allan variance can be devised, a simple example may illustrate how measurements can be performed.
Measurement
All measurements of Allan variance will in effect be the comparison of two different clocks. Lets consider a reference clock and a device under test (DUT), and both having a common nominal frequency of 10 MHz. A time-interval counter is being used to measure the time between the rising edge of the reference (channel A) and the rising edge of the device under test.
In order to provide evenly spaced measurements will the reference clock be divided down to form the measurement rate, triggering the time-interval counter (ARM input). This rate can be 1 Hz (using the 1 PPS output of a reference clock) but other rates like 10 Hz and 100 Hz can also be used. The speed of which the time-interval counter can complete the measurement, output the result and prepare itself for the next arm will limit the trigger frequency.
A computer is then useful to record the series of time-differences being observed.
Post-processing
The recorded time-series require post-processing to unwrap the wrapped phase, such that a continuous phase error is being provided. If necessary should also logging and measurement mistakes be fixed. Drift estimation and drift removal should be performed, the drift mechanism needs to be identified and understood for the sources. Drift limitations in measurements can be severe, so letting the oscillators become stabilized by long enough time being powered on is necessary.
The Allan variance can then be calculated using the estimators given, and for practical purposes the overlapping estimator should be used due to its superior use of data over the non-overlapping estimator. Other estimators such as Total or Theo variance estimators could also be used if bias corrections is applied such that they provide Allan variance compatible results.
To form the classical plots, the Allan deviation (square root of Allan variance) is plotted in log-log format against the observation interval tau.
Equipment and software
The time-interval counter is typically an off the shelf counter commercially available. Limiting factors involve single-shot resolution, trigger jitter, speed of measurements and stability of reference clock. The computer collection and post-processing can be done using existing commercial or public domain software. Highly advanced solutions exists which will provide measurement and computation in one box.
Research history
The field of frequency stability has been studied for a long time, however it was found during the 1960s that there was a lack of coherent definitions. The NASA-IEEE Symposium on Short-Term Stability in 1964 was followed with the IEEE Proceedings publishing a special issue on Frequency Stability in its February 1966 issue.
The NASA-IEEE Symposium on Short-Term Stability in November 1964[20] brought together many fields and uses of short and long term stability with papers from many different contributors. The articles and panel discussions is interesting in that they concur on the existence of the frequency flicker noise and the wish to achieve a common definition for short and long term stability (even if the conference name only reflect the short-term stability intention).
The IEEE proceedings on Frequency Stability 1966 included a number of important papers including those of David Allan,[3] James A. Barnes,[21] L. S. Cutler and C. L. Searle[1] and D. B. Leeson.[2] These papers helped shape the field.
The classical M-sample variance of frequency was analysed by David Allan in[3] along with an initial bias function. This paper tackles the issues of dead-time between measurements and analyses the case of M frequency samples (called N in the paper) and variance estimators. It provides the now standard α to µ mapping. It clearly builds on James Barnes work as detailed in his article[21] in the same issue. The initial bias functions introduced assumes no dead-time, but the formulas presented includes dead-time calculations. The bias function assumes the use of the 2-sample variance as a base-case, since any other variants of M may be chosen and values may be transferred via the 2-sample variance to any other variance for of arbitrary M. Thus, the 2-sample variance was only implicitly used and not clearly stated as the preference even if the tools where provided. It however laid the foundation for using the 2-sample variance as the base case of comparison among other variants of the M-sample variance. The 2-sample variance case is a special case of the M-sample variance which produces an average of the frequency derivative.
The work on bias functions was significantly extended by James Barnes in[14] in which the modern B1 and B2 bias functions was introduced. Curiously enough, it refers to the M-sample variance as "Allan variance" while referencing to Allan's paper "Statistics of Atomic Frequency Standards".[3] With these modern bias functions, full conversion among M-sample variance measures of variating M, T and τ values could used, by conversion through the 2-sample variance.
James Barnes and David Allan further extended the bias functions with the B3 function in[15] to handle the concatenated samples estimator bias. This was necessary to handle the new use of concatenated sample observations with dead time in between.
The IEEE Technical Committee on Frequency and Time within the IEEE Group on Instrumentation & Measurements provided a summary of the field in 1970 published as NBS Technical Notice 394.[10] This paper could be considered first in a line of more educational and practical papers aiding the fellow engineers in grasping the field. In this paper the 2-sample variance with T=τ is being the recommended measurement and it is referred to as Allan variance (now without the quotes). The choice of such parametrisation allows good handling of some noise forms and to get comparable measurements, it is essentially the least common denominator with the aid of the bias functions B1 and B2.
An improved method for using sample statistics for frequency counters in frequency estimation or variance estimation was proposed by J.J. Snyder.[6] The trick to get more effective degrees of freedom out of the available dataset was to use overlapping observation periods. This provides a square-root n improvement. It was included into the overlapping Allan variance estimator introduced in.[7] The variable τ software processing was also included in.[7] This development improved the classical Allan variance estimators likewise providing a direct inspiration going into the work on modified Allan variance.
The confidence interval and degrees of freedom analysis, along with the established estimators was presented in.[7]
Educational and practical resources
The field of time and frequency and its use of Allan variance, Allan deviation and friends is a field involving many aspects, for which both understanding of concepts and practical measurements and post-processing requires care and understanding. Thus, there is a realm of educational material stretching some 40 years available. Since these reflect the developments in the research of their time, they focus on teaching different aspect over time, in which case a survey of available resources may be a suitable way of finding the right resource.
The first meaningful summary is the NBS Technical Note 394 "Characterization of Frequency Stability".[10] This is the product of the Technical Committee on Frequency and Time of the IEEE Group on Instrumentation & Measurement. It gives the first overview of the field, stating the problems, defining the basic supporting definitions and getting into Allan variance, the bias functions B1 and B2, the conversion of time-domain measures. This is useful as it is among the first references to tabulate the Allan variance for the five basic noise types.
A classical reference is the NBS Monograph 140[22] from 1974, which in chapter 8 has "Statistics of Time and Frequency Data Analysis".[23] This is the extended variant of NBS Technical Note 394 and adds essentially in measurement techniques and practical processing of values.
An important addition will be the Properties of signal sources and measurement methods.[7] It covers the effective use of data, confidence intervals, effective degree of freedom likewise introducing the overlapping Allan variance estimator. It is a highly recommended reading for those topics.
The IEEE standard 1139 Standard definitions of Physical Quantities for Fundamental Frequency and Time Metrology[4] is beyond that of a standard a comprehensive reference and educational resource.
A modern book aimed towards telecommunication is Stefano Bregni "Synchronisation of Digital Telecommunication Networks".[12] This summarises not only the field but also much of his research in the field up to that point. It aims to include both classical measures likewise telecommunication specific measures such as MTIE. It is a handy companion when looking at telecommunication standard related measurements.
The NIST Special Publication 1065 "Handbook of Frequency Stability Analysis" of W.J. Riley[13] is a recommended reading for anyone wanting to pursue the field. It is rich of references and also covers a wide range of measures, biases and related functions that a modern analyst should have available. Further it describes the overall processing needed for a modern tool.
Uses
Allan variance is used as a measure of frequency stability in a variety of precision oscillators, such as crystal oscillators, atomic clocks and frequency-stabilized lasers over a period of a second or more. Short term stability (under a second) is typically expressed as phase noise. The Allan variance is also used to characterize the bias stability of gyroscopes, including fiber optic gyroscopes and MEMS gyroscopes.
50th Anniversary
In 2016, IEEE-UFFC is going to be publishing a "Special Issue to celebrate the 50th anniversary of the Allan Variance (1966-2016)".[24] A guest editor for that issue will be David's former colleague at NIST, Judah Levine, who is the most recent recipient of the I. I. Rabi Award.
See also
References
- 1 2 Cutler, L. S.; Searle, C. L. (February 1966), "Some Aspects of the Theory and Measurements of Frequency Fluctuations in Frequency Standards" (PDF), Proceedings of IEEE, 54 (2): 136–154
- 1 2 3 Leeson, D. B (February 1966), "A simple Model of Feedback Oscillator Noise Spectrum", Proceedings of IEEE, 54 (2): 329–330, archived from the original on 1 February 2014, retrieved 20 September 2012
- 1 2 3 4 5 6 Allan, D Statistics of Atomic Frequency Standards, pages 221–230. Proceedings of IEEE, Vol. 54, No 2, February 1966.
- 1 2 3 4 5 "Definitions of physical quantities for fundamental frequency and time metrology – Random Instabilities". IEEE Std 1139-1999. doi:10.1109/IEEESTD.1999.90575.
- ↑ Rubiola, Enrico (2008), Phase Noise and Frequency Stability in Oscillators, Cambridge university press, ISBN 0-521-88677-5
- 1 2 3 Snyder, J. J.: An ultra-high resolution frequency meter, pages 464–469, Frequency Control Symposium #35, 1981
- 1 2 3 4 5 6 7 D.A. Howe, D.W. Allan and J.A. Barnes: Properties of signal sources and measurement methods, pages 464–469, Frequency Control Symposium #35, 1981
- ↑ ITU-T Rec. G.810: Definitions and terminology for synchronization and networks, ITU-T Rec. G.810 (08/96)
- ↑ ETSI EN 300 462-1-1: Definitions and terminology for synchronisation networks, ETSI EN 300 462-1-1 V1.1.1 (1998–05)
- 1 2 3 4 J.A. Barnes, A.R. Chi, L.S. Cutler, D.J. Healey, D.B. Leeson, T.E. McGunigal, J.A. Mullen, W.L. Smith, R. Sydnor, R.F.C. Vessot, and G.M.R. Winkler: Characterization of Frequency Stability, NBS Technical Note 394, 1970
- ↑ J.A. Barnes, A.R. Chi, L.S. Cutler, D.J. Healey, D.B. Leeson, T.E. McGunigal, J.A. Mullen, Jr., W.L. Smith, R.L. Sydnor, R.F.C. Vessot, and G.M.R. Winkler: Characterization of Frequency Stability, IEEE Transactions on Instruments and Measurements 20, pp. 105–120, 1971
- 1 2 3 Bregni, Stefano: Synchronisation of digital telecommunication networks, Wiley 2002, ISBN 0-471-61550-1
- 1 2 3 NIST SP 1065: Handbook of Frequency Stability Analysis
- 1 2 3 4 5 Barnes, J.A.: Tables of Bias Functions, B1 and B2, for Variances Based On Finite Samples of Processes with Power Law Spectral Densities, NBS Technical Note 375, 1969
- 1 2 3 J.A. Barnes and D.W. Allan: Variances Based on Data with Dead Time Between the Measurements, NIST Technical Note 1318, 1990
- ↑ ITU-T Rec. G.813: Timing characteristics of SDH equipment slave clock (SEC), ITU-T Rec. G.813 (03/2003)
- ↑ Rubiola, Enrico (2005). "On the measurement of frequency and of its sample variance with high-resolution counters" (PDF). Review of Scientific Instruments. 76 (5): 054703. arXiv:physics/0411227
 . Bibcode:2005RScI...76e4703R. doi:10.1063/1.1898203. Archived from the original (PDF) on 20 July 2011.
 - ↑ Rubiola, Enrico: On the measurement of frequency and of its sample variance with high-resolution counters Archived 20 July 2011 at the Wayback Machine., Proc. Joint IEEE International Frequency Control Symposium and Precise Time and Time Interval Systems and Applications Meeting pp. 46–49, Vancouver, Canada, 29–31 August 2005.
- ↑ Rubiola, Enrico: High-resolution frequency counters (extended version, 53 slides) Archived 20 July 2011 at the Wayback Machine., seminar given at the FEMTO-ST Institute, at the Université Henri Poincaré, and at the Jet Propulsion Laboratory, NASA-Caltech.
- ↑ NASA: Short-Term Frequency Stability, NASA-IEEE symposium on Short Term Frequency Stability Goddard Space Flight Center 23–24 November 1964, NASA Special Publication 80
- 1 2 Barnes, J. A.: Atomic Timekeeping and the Statistics of Precision Signal Generators, IEEE Proceedings on Frequency Stability, Vol 54 No 2, pages 207–220, 1966
- ↑ Blair, B.E.: Time and Frequency: Theory and Fundamentals, NBS Monograph 140, May 1974
- ↑ David W. Allan, John H. Shoaf and Donald Halford: Statistics of Time and Frequency Data Analysis, NBS Monograph 140, pages 151–204, 1974
- ↑ "Archived copy". Archived from the original on 3 September 2014. Retrieved 28 August 2014.
External links
- UFFC Frequency Control Teaching Resources
- NIST Publication search tool
- David W. Allan's Allan Variance Overview
- David W. Allan's official web site
- JPL Publications – Noise Analysis and Statistics
- William Riley publications
- Stefano Bregni publications
- Enrico Rubiola publications
- Allanvar: R package for sensor error characterization using the Allan Variance
- Alavar windows software with reporting tools; Freeware
- AllanTools open-source python library for Allan variance
- MATLAB AVAR open-source MATLAB application