Air transportation in the United States
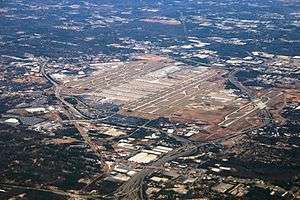
The United States has an extensive air transportation network. In 2013 there were 86 airports in the U.S. that annually handled over 1,000,000 passengers[1] and twelve of the world's thirty busiest airports by passenger volume in 2014 were in the U.S. (down from 17 in 2004), including the world's busiest, Hartsfield-Jackson Atlanta International Airport. In 2012 88% of all traffic was through the 62 busiest airports in the country.[2] In terms of cargo, in 2004, twelve of the world's thirty busiest airports were in the U.S., including the world's busiest, Hartsfield–Jackson Atlanta International Airport. Private aircraft are also used for medical emergencies, government agencies, large businesses, and individuals, see general aviation.
Due to the geography of the United States and the generally large distances between major cities, air transportation is the preferred method of travel for trips over 300 miles (480 km), such as for business travelers and long distance vacation travelers. For cities closer together in the Northeastern part of the country (e.g. Boston, New York City, Philadelphia, Baltimore and Washington D.C.) the Northeast Corridor rail line carries the majority of intercity traffic.
Since the start of the Great Recession air traffic in the U.S. has declined and the U.S. government reported 1.2 million fewer scheduled domestic flights in 2013 than in 2007 (with decreases averaging between 9 and 24% at large and medium-sized airports, respectively).[2] At the same time the airline industry has also experienced rapid consolidation with all of nation's largest carriers experiencing mergers.[2] The average domestic airline fare has steadily increased since 2009 and in 2014 it was higher than at any point since 2003.[3]
History
World War I (1914–1918)
When the U.S. entered the war in April 1917, it had already been lagging behind its European counterparts in aircraft production. This was largely due to the fact that the U.S. entered the war much later, when most of the European countries were already pressured to advance their aircraft technologies to outcompete one another. The Europeans had already developed standardized mass production of aircraft, while the U.S. was forced to expand to meet their wartime necessities. Even so, most of the aircraft used by the U.S. in wartime were from Britain or France. In August 1917, Congress passed the Aero Bill which dedicated $640 million towards aircraft production; however, the U.S. economy overall was unable to successfully transition into a mass-producing aircraft industry in such a short amount of time.[4][5]
Post WWI Era (1918–1930s)
After the first World War, the U.S. aircraft industry declined and stagnated, due to low budgets, low demand, and the high competition from foreign manufacturers who already possessed technology far more advanced than the U.S. did. Because the bulk of the aircraft demand had come from military uses, the post-war period resulted in a surplus of aircraft leftover from wartime accompanied by a lack of demand, creating an excess supply of unused aircraft.
Military aviation dominated the aircraft industry up until the mid-1920s and it was during the late 1920s when civil aviation appeared and began to rise. Beginning in the mid-1920s, in order to sustain the existence of the aircraft industry, the U.S. government endorsed and subsidized airlines to carry airmail throughout the country, leading to the U.S. having the largest airmail system in the world. The U.S. implemented the Kelly Airmail Act of 1925 which induced competition amongst airlines and eventually lead to the expansion from carrying mail to carrying people and commercial goods. The emergence of an expansive airmail system allowed for easier and faster correspondence and transport. Aircraft as a means of passenger travel also began to emerge during this time period, though passenger air travel did not surge until after World War II. Unemployment was not significantly effected by the emergence of the civil aviation industry, as the jobs that were created were occupied by people who previously worked in the army and were then unemployed after the war’s end.[6]
World War II
U.S. aircraft production surged throughout World War II. The U.S. experienced an immense amount of government spending on defense production and a shift from automobile production to aircraft production. At the beginning of the war, U.S.’ aircraft production was one of the lowest in the world, but by 1945, the U.S. aircraft production alone had already produced more than a third of the world’s total aircraft production. Aircraft production made up the most of the U.S.’ manufacturing output during the World War II era from 1940-1945, contributing to the surge in GDP growth.[7]
The expansion of the airline industry in response to wartime needs also lead to higher demand for labor. Increasingly more pilots, flight staff, engineers, and researchers were needed to operate the aircraft as well as develop advanced technology, leading to increased job creation. During this time, unemployment rates decreased significantly, dropping to nearly the full employment rate.[8]
Post WWII
The end of World War II, immediately followed by demobilization, lead to airplane companies losing a total of $35 million in 1946 in sales and $115 million in 1947. There was once again an excess in aircraft supply post-war and not a high enough corresponding demand. Accordingly, unemployment increased slightly by 2% in the 2 years following the end of World War II. However, with the technological improvements in passenger travel safety and comfort, accompanied by an increasing demand in commercial aviation, the airline industry was soon driving revenues that were 500% of its revenues by 1945. This increase in commercial demand was also fueled by an increase in consumer confidence in airlines, reinforced by the creation of the Federal Aviation Administration in 1958, which managed aviation safety.[9]
Economist Alfred Kahn became the chairman of the Civil Aeronautics Board in the mid-1970s, which eventually lead to Congress passing the Airline Deregulation Act of 1978. This allowed for free market competition in the airline industry, to meet the pressure of the decreasing world price of air travel. This ultimately allowed the U.S. airline industry to operate competitively in the international market.[10]
Twenty-first century
The American airline industry has suffered significantly as a result of the terrorist attacks of September 11. The attacks of September 11 dramatically decreased consumer confidence in the airline industry The airline industry lost more than $330 million each day within the first week of the attack, totaling losses between $1 and $2 billion. In the following years, the decrease in demand accompanied by the decreasing price of air travel reduced revenues immensely.[11][12]
The price of fuel has also been rising, further increasing airlines’ losses by $180 million per year. Another large part of airline expenses comes from wages for employees, which make up 40% of airlines’ expenses. To compensate for rising costs and decreasing revenues, airlines have decreased the number of planes in service and thus have also laid off workers, negatively impacting the economy’s unemployment rate.[13]
| Year | Operating Revenue | Fares | Baggage Fees | Change Fees | Operating Expenses | Fuel | Labor | Operating Profit | Net Income |
|---|---|---|---|---|---|---|---|---|---|
| 2011 | 153,294 | 114,299 | 3,393 | 2,390 | 148,048 | 43,755 | 35,377 | 5,246 | 490 |
| 2012 | 156,470 | 115,975 | 3,450 | 2,538 | 150,467 | 44,902 | 37,195 | 6,003 | 98 |
| 2013 | 161,597 | 121,333 | 3,350 | 2,814 | 150,286 | 42,629 | 38,043 | 11,311 | 12,169 |
| 2014 | 169,277 | 127,455 | 3,530 | 2,981 | 154,677 | 43,431 | 40,771 | 14,600 | 7,447 |
| 2015 | 168,874 | 126,880 | 3,814 | 3,012 | 140,881 | 26,977 | 45,385 | 27,993 | 25,596 |
| Rank | Airline | Net Income | Operating Profit | Operating Revenue | Fares | % | Operating Expenses | Fuel | % | Labor | % |
|---|---|---|---|---|---|---|---|---|---|---|---|
| 1 | AA+US | 7,895 | 6,189 | 41,084 | 29,173 | 0.71 | 34,895 | 6,189 | 17.7 | 10,066 | 28.8 |
| 2 | Delta | 4,539 | 7,845 | 40,816 | 28,437 | 0.70 | 32,971 | 6,503 | 19.7 | 10,445 | 31.7 |
| 3 | United | 7,301 | 5,167 | 37,864 | 26,333 | 0.70 | 32,697 | 6,345 | 19.4 | 10,014 | 30.6 |
| 4 | Southwest | 2,181 | 4,117 | 19,820 | 18,347 | 0.93 | 15,704 | 3,616 | 23.0 | 6,689 | 42.6 |
| 5 | JetBlue | 677 | 1,198 | 6,416 | 5,907 | 0.92 | 5,218 | 1,348 | 25.8 | 1,628 | 31.2 |
| 6 | Alaska | 829 | 1,291 | 5,594 | 3,961 | 0.71 | 4,303 | 808 | 18.8 | 1,233 | 28.6 |
| 7 | Hawaiian | 193 | 431 | 2,313 | 2,015 | 0.87 | 1,882 | 416 | 22.1 | 526 | 27.9 |
| 8 | Spirit | 331 | 509 | 2,142 | 1,267 | 0.59 | 1,632 | 461 | 28.3 | 378 | 23.2 |
| 9 | SkyWest | 113 | 216 | 1,932 | 1,876 | 0.97 | 1,716 | 115 | 6.7 | 732 | 42.6 |
| 10 | Frontier | 146 | 276 | 1,604 | 1,277 | 0.80 | 1,328 | 346 | 26.1 | 313 | 23.6 |
| 10-Carrier | 24,204 | 27,239 | 159,585 | 118,592 | 0.74 | 132,346 | 26,148 | 19.8 | 42,023 | 31.8 | |
| All | 25,596 | 27,993 | 168,874 | 126,880 | 0.75 | 140,881 | 26,977 | 19.1 | 45,385 | 32.2 |
Contribution to GDP and Employment
The Federal Aviation Administration (FAA) in 2009 found that commercial aviation is accounts for approximately 5% of U.S. gross domestic product and also contributes to $1.3 trillion in annual economic activity as well as helps generate and support 10 million jobs annually. The aircraft industry contributes to the economy through many different avenues, including manufacturing and the airline industry. As of 2009, the National Air Traffic Controllers Association reported airline operations helped “generate $150.5 billion to the U.S. gross domestic product, while airport operations contributed an additional $44.6 billion.”
Economic Impact of Commercial Aviation on the U.S. Economy (2006-2009)
| Annual Economic Activity/Output | $1.2-$1.3 trillion |
| Annual Personal Earnings | $370–$405 billion |
| Share of GDP | 4.9-5.2 percent |
| Job Impact | 9.7-10.5 million |
Airports
Operations
Public airports are usually constructed and operated by local governments. The main exceptions are on military bases. Like highways and passenger rail, the federal government subsidizes air travel with $14 billion of federal funds going to airport operations in 2002.[15]
Security and regulation
Air transportation in the United States is regulated by the TSA, an agency of the US Department of Homeland Security. Passengers must provide a valid federal or state-issued ID in order to be allowed onto a flight.[16] A person must also go through a pat-down procedure or a body scan before boarding a flight to ensure that they have no prohibited items.[17] These security policies have been adopted by the US government ever since the 9/11 Terrorist Attacks in which terrorists managed to hijack several commercial airliners. Items that are prohibited on airplanes include firearms, tools, or other objects that can be used as weapons, explosive or flammable materials, and other dangerous or debilitating chemicals or substances.[18]
Airlines
Passenger airlines
The U.S. has no single flag carrier and passenger airlines in the United States have always been privately owned. The U.S. has three major international carriers (Delta Air Lines, American Airlines, and United Airlines) and an additional nine large carriers that operate mainly domestic flights but have some international destinations (Alaska Airlines, Allegiant Air, Frontier Airlines, Hawaiian Airlines, JetBlue, Southwest Airlines, Spirit Airlines, Sun Country Airlines and Virgin America). At the end of 2014, the three international carriers plus Southwest controlled more than 80% of all passenger travel in the U.S. market.[19]
There is currently no government regulation of ticket pricing, although the federal government retains jurisdiction over aircraft safety, pilot training, and accident investigations (through the Federal Aviation Administration and the National Transportation Safety Board). The Transportation Security Administration provides security at airports and the federal government provides billions of dollars annually to maintain air transport facilities and manage the country's air traffic control system.
Many airlines operate on a "hub and spoke" model. This system gives the predominant airline in a given airport a strong competitive position as it feeds passengers to and from the hub, maximizing the number of passengers on each flight. Examples of airline hubs include United Airlines at Houston, Newark Liberty, Chicago-O'Hare, Denver, and SFO; Delta Air Lines at Atlanta, Detroit, and Minneapolis; and American Airlines at Charlotte, Chicago-O'Hare, Dallas/Fort Worth, Miami, Philadelphia, and Phoenix.
Air cargo
Air cargo comprises a large number of daily flights in the United States and are operated by private parcel companies such as FedEx and United Parcel Service. These organizations operate some of the largest fleets in the world. Most air cargo moved by these organizations is time sensitive overnight and 2nd day parcels. The U.S. Postal Service also moves much of its letters and time sensitive parcels via air, but on regularly scheduled passenger flights. At one time the U.S. Mail charged a premium for letters sent by airmail, but no longer does so except for overnight express mail.
Delays
| Ranking of Major Airports by Lowest On-Time Arrival Performance (2007)[20] | |
|---|---|
| Airport | % on time |
| New York- LaGuardia | 58.48 |
| Newark | 59.45 |
| New York- JFK | 62.84 |
| Chicago- O'Hare | 65.88 |
| Philadelphia | 66.54 |
| Boston | 69.68 |
| San Francisco | 69.75 |
| Miami | 70.99 |
| Charlotte Douglas | 71.30 |
| Seattle-Tacoma | 71.43 |
| Largest 32 airports average | 73.03 |
Airline delays have been the subject of some controversy, prompting a GAO audit and Congressional debate in 2007-08.[21]
Roughly one in four passengers experienced a passenger trip delay in 2007 and the average duration of delay experienced by these passengers was 1 hour 54 minutes.[22] 24% of flights were delayed and 2% were cancelled entirely.[23] Overall, passengers were delayed 320 million hours in 2007 with an estimated deadweight economic loss of up to $41 billion.[24]
An average of 40% of passenger aircraft delays in the U.S. originated in the New York metropolitan area, some in the area and others due to cascading effects.[22] One-third of aircraft in the national airspace system move through the New York area at some point during a typical day.[24]
To deal with delays, takeoff and landing scheduling caps have been imposed on certain urban airports at various times since 1968, including Washington Reagan National, Chicago O'Hare, and the three New York airports.[25] Other short-term measures have been taken, including minor procedural changes, use of military airspace on peak travel days, and appointment of a "New York Airspace Czar" (Director for the New York Area Program Integration Office). The New York/New Jersey/Philadelphia airspace is being "redesigned" incrementally, with completion estimated in 2012.[26] The Bush Administration announced plans to auction some takeoff and landing slots at the New York airports, but plans were canceled by the Obama administration.
Longer-term solutions include increasing capacity by building more runways, and implementing the Next Generation Air Transportation System which would allow more direct flight paths. The California High Speed Rail project has been justified among other things as a ways to decrease congestion and thereby delays on the busy San Francisco Bay Area - Metro Los Angeles air corridor.
Network statistics
- Airports: 14,951 (2008 est.)[27]
|
|
Air traffic control
National Airspace System
Next Generation Air Transportation System
See also
- Federal Aviation Administration – The national aviation authority of the United States
- Space-A travel – A system for military-related people to travel free on military flights
References
- ↑ CY 2013 Primary Airports -- Preliminary Data
- 1 2 3 U.S. House of Representatives Report, 2014, http://transportation.house.gov/uploadedfiles/2014-06-18-dillingham.pdf
- ↑ U.S. Department of Transportation, http://www.rita.dot.gov/bts/airfares/programs/economics_and_finance/air_travel_price_index/html/AnnualFares.html
- ↑ The American Aerospace Industry: From Workshop to Global Enterprise. By Roger E. Bilstein. New York: Twayne Publishers, 1996.
- ↑ The U.S. Combat Aircraft Industry: 1909–2000. By Mark Lorell. California: RAND, 2003. Retrieved from https://www.rand.org/content/dam/rand/pubs/monograph_reports/2005/MR1696.pdf
- ↑ Economy and Society, 1935–1945. By Alan S. Milward. Berkeley: University of California Press, 1979. Retrieved from http://www.jstor.org/stable/4468514
- ↑ Army Air Forces Statistical Digest World War II, List of Tables. Retrieved from http://www.usaaf.net/digest/aircraft_and_equipment.htm
- ↑ Annual Estimates of Unemployment in the United States, 1900–1954. By Stanley Lebergott. The Measurement and Behavior of Unemployment (1957), pp. 211–242. Published by the National Bureau of Economic Research. Retrieved from http://www.nber.org/chapters/c2644.pdf
- ↑ Growth of the Airline Industry. By Schroeder Boulton. The Analysts Journal, Vol. 11, No. 4 (Aug., 1955), pp. 29–32. Retrieved from http://www.jstor.org/stable/4468514
- ↑ The Airline Industry, Stanford University Aircraft Aerodynamics and Design Group. Retrieved from http://adg.stanford.edu/aa241/intro/airlineindustry.html
- ↑ Air Transport Association of America, Inc. By J. May (2003) May, J. (2003). Retrieved from http://commerce.senate.gov/pdf/may020503.pdf
- ↑ Sequestration: The Effects on Aviation and Everyday Travel. By the National Air Traffic Controllers Association, December 2011. Retrieved from http://www.natca.org/ULWSiteResources/natcaweb/Resources/file/Legislative%20Center/SeqFINAL.pdf
- ↑ The Economic Impact of Civil Aviation on the U.S. Economy. By U.S. Department of Transportation Federal Aviation Administration, August 2011. Retrieved from http://www.faa.gov/air_traffic/publications/media/FAA_Economic_Impact_Rpt_2011.pdf
- 1 2 "4th Quarter 2015 Airline Financial Data" (PDF). Bureau of Transportation Statistics. May 2, 2016.
- ↑ U.S. Transportation Subsidies
- ↑ http://www.tsa.gov/traveler-information/acceptable-ids
- ↑ http://www.tsa.gov/traveler-information/pat-downs
- ↑ http://www.tsa.gov/traveler-information/prohibited-items#11
- ↑ The Associated Press, Two decades after launch, AirTran takes its final flight, 30 December 2014, http://mashable.com/2014/12/29/airtran-airways/
- ↑ GAO report, p. 12
- ↑ GAO-08-934T, Statement of Susan Fleming, Director Physical Infrastructure Issues, in Testimony Before the Subcommittee on Aviation Operations, Safety, and Security, Committee on Commerce, Science, and Transportation, U.S. Senate. "NATIONAL AIRSPACE SYSTEM: DOT and FAA Actions Will Likely Have a Limited Effect on Reducing Delays during Summer 2008 Travel Season. July 15, 2008
- 1 2 GAO report, p. 10
- ↑ GAO report, p.8
- 1 2 GAO report, p. 1
- ↑ GAO report, p. 6
- ↑ GAO report, summary
- 1 2 "CIA — THe World Factbook — United States". Retrieved 2009-06-14.
External links
| Wikivoyage has a travel guide for Air travel in the United States. |
- U.S. Department of Transportation (DOT)
- NASA graphic map of air travel in US, including top view, side view, and 9/11/2001–6 minute graphic