Air pollution in India
Air pollution in India is quite a serious issue with the major sources being fuelwood and biomass burning, fuel adulteration, vehicle emission and traffic congestion.[1] In autumn and winter months, large scale crop residue burning in agriculture fields - a low cost alternative to mechanical tilling - is a major source of smoke, smog and particulate pollution.[2][3][4] India has a low per capita emissions of greenhouse gases but the country as a whole is the third largest after China and the United States.[5] A 2013 study on non-smokers has found that Indians have 30% lower lung function compared to Europeans.[6]
The Air (Prevention and Control of Pollution) Act was passed in 1981 to regulate air pollution and there have been some measurable improvements. However, the 2016 Environmental Performance Index ranked India 141 out of 180 countries.[7]
In 2015, BJP government in the center with the Ministry of Environment, Forest and Climate Change, Government of India launched National Air Quality Index to the public involving IIT Kanpur. The same can be tracked at http://envfor.nic.in/content/national-air-quality-index
Fuel and biomass burning


Fuelwood and biomass burning is the primary reason for near-permanent haze and smoke observed above rural and urban India, and in satellite pictures of the country. Fuelwood and biomass cakes are used for cooking and general heating needs. These are burnt in cook stoves known as chullah or chulha piece in some parts of India. These cook stoves are present in over 100 million Indian households, and are used two to three times a day, daily. As of 2009, majority of Indians still use traditional fuels such as dried cow dung, agricultural waste, and firewood as cooking fuel.
This form of fuel is inefficient source of energy, its burning releases high levels of smoke, PM10 particulate matter, NOx, SOx, PAHs, polyaromatics, formaldehyde, carbon monoxide and other air pollutants.[8][9][10][11] Some reports, including one by the World Health Organization, claim 300,000 to 400,000 people die of indoor air pollution and carbon monoxide poisoning in India because of biomass burning and use of chullahs.[12] The air pollution is also the main cause of the Asian brown cloud which is delaying the start of the monsoon. Burning of biomass and firewood will not stop unless electricity or clean burning fuel and combustion technologies become reliably available and widely adopted in rural and urban India.
India is the world's largest consumer of fuelwood, agricultural waste and biomass for energy purposes. From the most recent available nationwide study, India used 148.7 million tonnes coal replacement worth of fuelwood and biomass annually for domestic energy use. India's national average annual per capita consumption of fuel wood, agri water and biomass cakes was 206 kilogram coal equivalent.[13]
In 2010 terms, with India's population increased to about 1.2 billion, the country burns over 200 million tonnes of coal replacement worth of fuel wood and biomass every year to meet its energy need for cooking and other domestic use. The study found that the households consumed around 95 million tonnes of fuelwood, one-third of which was logs and the rest was twigs. Twigs were mostly consumed in the villages, and logs were more popular in cities of India.[13]
The overall contribution of fuelwood, including sawdust and wood waste, was about 46% of the total, the rest being agri waste and biomass dung cakes. Traditional fuel (fuelwood, crop residue and dung cake) dominates domestic energy use in rural India and accounts for about 90% of the total. In urban areas, this traditional fuel constitutes about 24% of the total.[13]
Fuel wood, agricultural waste and biomass cake burning releases over 165 million tonnes of combustion products into India's indoor and outdoor air every year. To place this volume of emission in context, the Environmental Protection Agency (EPA) of the United States estimates that fire wood smoke contributes over 420,000 tonnes of fine particles throughout the United States – mostly during the winter months. United States consumes about one-tenth of fuelwood consumed by India, and mostly for fireplace and home heating purposes. EPA estimates that residential wood combustion in the USA accounts for 44 percent of total organic matter emissions and 62 percent of the PAH, which are probable human carcinogens and are of great concern to EPA. The fuel wood sourced residential wood smoke makes up over 50 percent of the wintertime particle pollution problem in California.[14] In 2010, the state of California had about the same number of vehicles as all of India.
India burns tenfold more fuelwood every year than the United States, the fuelwood quality in India is different than the dry firewood of the United States, and the Indian stoves in use are less efficient thereby producing more smoke and air pollutants per kilogram equivalent. India has less land area and less emission air space than the United States. In summary, the impact on indoor and outdoor air pollution by fuelwood and biomass cake burning is far worse in India.
A United Nations study[15] finds firewood and biomass stoves can be made more efficient in India. Animal dung, now used in inefficient stoves, could be used to produce biogas, a cleaner fuel with higher utilisation efficiency. In addition, an excellent fertiliser can be produced from the slurry from biogas plants. Switching to gaseous fuels would bring the greatest gains in terms of both thermal efficiency and reduction in air pollution, but would require more investment. A combination of technologies may be the best way forward.
Between 2001 and 2010, India has made progress in adding electrical power generation capacity, bringing electricity to rural areas, and reforming market to improve availability and distribution of liquified cleaner burning fuels in urban and rural area. Over the same period, scientific data collection and analysis show improvement in India's air quality, with some regions witnessing 30 to 65% reduction in NOx, SOx and suspended particulate matter. Even at these lower levels, the emissions are higher than those recommended by the World Health Organization. Continued progress is necessary.
Scientific studies conclude biomass combustion in India is the country's dominant source of carbonaceous aerosols, emitting 0.25 teragram per year of black carbon into air, 0.94 teragram per year of organic matter, and 2.04 teragram per year of small particulates with diameter less than 2.5 µm. Biomass burning, as domestic fuel in India, accounts for about 3 times as much black carbon air pollution as all other sources combined, including vehicles and industrial sources.[16]
Emissions standards

Many two wheel, three wheel and four wheel vehicles lacked catalytic converters. Increases in vehicle emissions were among the highest in the world.[20] The refining of oil and supply of fuel was owned, regulated and run by the government; the fuel quality was lax.
In 2005, India adopted emission standard of Bharat Stage IV for vehicles, which is equivalent to Euro IV European standards for vehicle emissions. Nevertheless, the old pre-2005 vehicles, and even pre-1992 vehicles, are still on Indian streets.
Fuel adulteration
Some Indian taxis and auto-rickshaws run on adulterated fuel blends. Adulteration of gasoline and diesel with lower-priced fuels is common in South Asia, including India.[1] Some adulterants increase emissions of harmful pollutants from vehicles, worsening urban air pollution. Financial incentives arising from differential taxes are generally the primary cause of fuel adulteration. In India and other developing countries, gasoline carries a much higher tax than diesel, which in turn is taxed more than kerosene meant as a cooking fuel, while some solvents and lubricants carry little or no tax.
As fuel prices rise, the public transport driver cuts costs by blending the cheaper hydrocarbon into highly taxed hydrocarbon. The blending may be as much as 20-30 percent. For a low wage driver, the adulteration can yield short term savings that are significant over the month. The consequences to long term air pollution, quality of life and effect on health are simply ignored. Also ignored are the reduced life of vehicle engine and higher maintenance costs, particularly if the taxi, auto-rickshaw or truck is being rented for a daily fee.
Adulterated fuel increases tailpipe emissions of hydrocarbons (HC), carbon monoxide (CO), oxides of nitrogen (NOx) and particulate matter (PM). Air toxin emissions — which fall into the category of unregulated emissions — of primary concern are benzene and polyaromatic hydrocarbons (PAHs), both well known carcinogens. Kerosene is more difficult to burn than gasoline; its addition results in higher levels of HC, CO and PM emissions even from catalyst-equipped cars. The higher sulfur level of kerosene is another issue.
The permissible level of fuel sulfur in India, in 2002, was 0.25 percent by weight as against 0.10 percent for gasoline. The higher levels of sulfur can deactivate the catalyst. Once the catalyst becomes deactivated, the amount of pollution from the vehicle dramatically increases. Fuel adulteration is essentially an unintended consequence of tax policies and the attempt to control fuel prices, in the name of fairness. Air pollution is the ultimate result. This problem is not unique to India, but prevalent in many developing countries including those outside of south Asia. This problem is largely absent in economies that do not regulate the ability of fuel producers to innovate or price based on market demand.
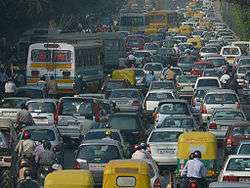
Traffic congestion
Traffic congestion is severe in India's cities and towns. Traffic congestion is caused for several reasons, some of which are: increase in number of vehicles per kilometer of available road, a lack of intra-city divided-lane highways and intra-city expressways networks, lack of inter-city expressways, traffic accidents and chaos due to poor enforcement of traffic laws.
Traffic congestion reduces average traffic speed. At low speeds, scientific studies reveal, vehicles burn fuel inefficiently and pollute more per trip. For example, a study in the United States found that for the same trip, cars consumed more fuel and polluted more if the traffic was congested, than when traffic flowed freely. At average trip speeds between 20 and 40 kilometers per hour, the cars pollutant emission was twice as much as when the average speed was 55 to 75 kilometers per hour. At average trip speeds between 5 and 20 kilometers per hour, the cars pollutant emissions were 4 to 8 times as much as when the average speed was 55 to 70 kilometers per hour.[21] Fuel efficiencies similarly were much worse with traffic congestion.
Traffic gridlock in Delhi and other Indian cities is extreme.[22] The average trip speed on many Indian city roads is less than 20 kilometers per hour; a 10 kilometer trip can take 30 minutes, or more. At such speeds, vehicles in India emit air pollutants 4 to 8 times more than they would with less traffic congestion; Indian vehicles also consume a lot more carbon footprint fuel per trip, than they would if the traffic congestion was less. Emissions of particles and heavy metals increase over time because the growth of the fleet and mileage outpaces the efforts to curb emissions.[20]
In cities like Bangalore, around 50% of children suffer from asthma.[23]
Greenhouse gas emissions
India was the third largest emitter of carbon dioxide in 2009 at 1.65 Gt per year, after China (6.9 Gt per year) and the United States (5.2 Gt per year). With 17 percent of world population, India contributed some 5 percent of human-sourced carbon dioxide emission; compared to China's 24 percent share. On per capita basis, India emitted about 1.4 tons of carbon dioxide per person, in comparison to the United States' 17 tons per person, and a world average of 5.3 tons per person.[5][24]
About 65 percent of India's carbon dioxide emissions in 2009 was from heating, domestic uses and power sector. About 9 percent of India's emissions were from transportation (cars, trains, two wheelers, aeroplanes, others). India's coal-fired, oil-fired and natural gas-fired thermal power plants are inefficient and offer significant potential for CO2 emission reduction through better technology. Compared to the average emissions from coal-fired, oil-fired and natural gas-fired thermal power plants in European Union (EU-27) countries, India's thermal power plants emit 50 to 120 percent more CO2 per kWh produced.[5] This is in significant part to inefficient thermal power plants installed in India prior to its economic liberalisation in the 1990s.
Between 1990 and 2009, India's carbon dioxide emissions per GDP purchasing power parity basis have decreased by over 10 percent, a trend similar to China. Meanwhile, between 1990 and 2009, Russia's carbon dioxide emissions per GDP purchasing power parity basis have increased by 40 percent. India has one of the better records in the world, of an economy that is growing efficiently on CO2 emissions basis. In other words, over the last 20 years, India has reduced CO2 emissions with each unit of GDP increase.[5] Per Copenhagen Accord, India aims to further reduce emissions intensity of its growing GDP by 20 to 25 percent before 2020, with technology transfer and international cooperation. Nevertheless, it is expected, that like China, India's absolute carbon dioxide emissions will rise in years ahead, even as International Energy Agency's Annex I countries expect their absolute CO2 emissions to drop.
A significant source of greenhouse gas emissions from India is from black carbon, NOx, methane and other air pollutants. These pollutants are emitted in large quantities in India every day from incomplete and inefficient combustion of biomass (fuel wood, crop waste and cattle dung). A majority of Indian population lacks access to clean burning fuels, and uses biomass combustion as cooking fuel. India's poorly managed solid wastes, inadequate sewage treatment plants, water pollution and agriculture are other sources of greenhouse gas emissions.[8][25]
NASA's Lau has proposed that as the aerosol particles rise on the warm, convecting air, they produce more rain over northern India and the Himalayan foothill, which further warms the atmosphere and fuels a "heat pump" that draws yet more warm air to the region. This phenomenon, Lau believes, changes the timing and intensity of the monsoon, effectively transferring heat from the low-lying lands over the subcontinent to the atmosphere over the Tibetan Plateau, which in turn warms the high-altitude land surface and hastens glacial retreat. His modeling shows that aerosols—particularly black carbon and dust—likely cause as much of the glacial retreat in the region as greenhouse gases via this "heat pump" effect.[26]
Health costs of air pollution
Exposure to particulate matter for a long time can lead to respiratory and cardiovascular diseases such as asthma, bronchitis, lung cancer and heart attacks. The Global burden of disease study for 2010, published in 2013, had found that outdoor air pollution was the fifth-largest killer in India and around 620,000 early deaths occurred from air pollution-related diseases in 2010.[27] According to a WHO study, 13 of the 20 most-polluted cities in the world are in India; however, the accuracy and methodology of the WHO study was questioned by the Government of India led by Manmohan Singh.[27]
Recent trends in air quality


With the last 15 years of economic development and regulatory reforms, India has made progress in improving its air quality. The table presents the average emissions sampled at many locations, over time, and data analysed by scientific methods, by multiple agencies, including The World Bank. For context and comparison, the table also includes average values for Sweden in 2008, observed and analysed by same methods. Over 1995-2008, average nationwide levels of major air pollutants have dropped by between 25-45 percent in India.
| 1995 | 2005 | 2008 | 2008 | |
| Pollutant, PM10 (micrograms per cubic meter) | 109 | 67 | 59 | 11 |
| Pollutant, CO2 emissions (kg per 2005 PPP$ of GDP) | 0.7 | 0.6 | 0.5 | 0.2 |
| Health, mortality rate (under 5, per 1000) | 100 | 73 | 67 | 3 |
| Pollutant, methane, Agriculture emissions (% total) | 68.8 | 64.4 | n.a. | 28.1 |
| Pollutant, nitrous oxide, Agriculture emissions (% total) | 75.2 | 73.4 | n.a. | 60.2 |
India's Central Pollution Control Board now routinely monitors four air pollutants namely sulphur dioxide (SO2), oxides of nitrogen (NOx), suspended particulate matter (SPM) and respirable particulate matter (PM10). These are target air pollutants for regular monitoring at 308 operating stations in 115 cities/towns in 25 states and 4 Union Territories of India. The monitoring of meteorological parameters such as wind speed and direction, relative humidity and temperature has also been integrated with the monitoring of air quality. The monitoring of these pollutants is carried out for 24 hours (4-hourly sampling for gaseous pollutants and 8-hourly sampling for particulate matter) with a frequency of twice a week, to yield 104 observations in a year.
For 2010, the key findings of India's central pollution control board are:[28]
- Most Indian cities continue to violate India's and world air quality PM10 targets. Respirable particulate matter pollution remains a key challenge for India. Despite the general non-attainment, some cities showed far more improvement than others. A decreasing trend has been observed in PM10 levels in cities like Solapur and Ahmedabad over the last few years. This improvement may be due to local measures taken to reduce sulphur in diesel and stringent enforcement by the government.
- A decreasing trend has been observed in sulphur dioxide levels in residential areas of many cities such as Delhi, Mumbai, Lucknow, Bhopal during last few years. The decreasing trend in sulphur dioxide levels may be due to recently introduced clean fuel standards, and the increasing use of LPG as domestic fuel instead of coal or fuelwood, and the use of CNG instead of diesel in certain vehicles.
- A decreasing trend has been observed in nitrogen dioxide levels in residential areas of some cities such as Bhopal and Solapur during last few years. The decreasing trend in sulphur dioxide levels may be due to recently introduced vehicle emission standards, and the increasing use of LPG as domestic fuel instead of coal or fuelwood.
- Most Indian cities greatly exceed acceptable levels of suspended particulate matter. This may be because of refuse and biomass burning, vehicles, power plant emissions, industrial sources.
- The Indian air quality monitoring stations reported lower levels of PM10 and suspended particulate matter during monsoon months possibly due to wet deposition and air scrubbing by rainfall. Higher levels of particulates were observed during winter months possibly due to lower mixing heights and more calm conditions. In other words, India's air quality worsens in winter months, and improves with the onset of monsoon season.
- The average annual SOx and NOx emissions level and periodic violations in industrial areas of India were significantly and surprisingly lower than the emission and violations in residential areas of India
- Of the four major Indian cities, air pollution was consistently worse in Delhi, every year over 5-year period (2004–2008). Kolkata was a close second, followed by Mumbai. Chennai air pollution was least of the four.
Recent reports have found problems with pollution increasing, especially because of increasing use of vehicle transport.[29]
In May 2014 the World Health Organisation announced New Delhi as the most polluted city in the world.[30] In November 2016, the Great smog of Delhi was an environmental event which saw New Delhi and adjoining areas in a dense blanket of smog, which was the worst in 17 years.
.svg.png)
See also
References
- 1 2 "Urban Air Pollution, Catching gasoline ad diesel adulteration" (PDF). The World Bank. 2002.
- 1 2 Badarinath, K. V. S., Kumar Kharol, S., & Rani Sharma, A. (2009), Long-range transport of aerosols from agriculture crop residue burning in Indo-Gangetic Plains—a study using LIDAR, ground measurements and satellite data. Journal of Atmospheric and Solar-Terrestrial Physics, 71(1), 112-120
- 1 2 Agricultural Fires in India NASA, United States (2012)
- ↑ Bob Weinhold , Fields and Forests in Flames: Vegetation Smoke and Human Health, National Institutes of Health
- 1 2 3 4 "CO2 EMISSIONS FROM FUEL COMBUSTION HIGHLIGHTS, 2011 Edition" (PDF). International Energy Agency, France. 2011.
- ↑ "Indians have 30% weaker lungs than Europeans". Times of India. Sep 2, 2013.
- ↑ "Data : India - Environmental Performance Index - Development". Yale University. 2016. Retrieved 8 April 2016.
- 1 2 Ganguly; et al. (2001). "INDOOR AIR POLLUTION IN INDIA – A MAJOR ENVIRONMENTAL AND PUBLIC HEALTH CONCERN" (PDF). Indian Council of Medical Research, New Delhi.
- ↑ David Pennise; Kirk Smith. "Biomass Pollution Basics" (PDF). The World Health Organization.
- ↑ "The Asian Brown Cloud: Climate and Other Environmental Impacts" (PDF). United Nations Environmental Programme. 2002.
- ↑ "Indoor air pollution and household energy". WHO and UNEP. 2011.
- ↑ "Green stoves to replace chullahs". The Times of India. December 3, 2009.
- 1 2 3 Devendra Pandey (2002). Fuelwood Studies in India: Myth and Reality (PDF). Center for International Forestry Research. ISBN 979-8764-92-7.
- ↑ "Strategies for Reducing Residential Wood Smoke" (PDF). EPA, United States. 2009.
- ↑ OlegDzioubinski and Ralph Chipman (1999). "Trends in Consumption and Production: Household Energy Consumption" (PDF). The United Nations.
- ↑ Reddy and Venkataraman (2002). "Inventory of aerosol and sulphur dioxide emissions from India" (PDF). Atmospheric Environment. 36: 699–712. doi:10.1016/s1352-2310(01)00464-2.
- ↑ Sharma, A. R., Kharol, S. K., Badarinath, K. V. S., & Singh, D. (2010), Impact of agriculture crop residue burning on atmospheric aerosol loading--a study over Punjab State, India. Annales Geophysicae, 28(2), pp 367-379
- ↑ Tina Adler, RESPIRATORY HEALTH: Measuring the Health Effects of Crop Burning, Environ Health Perspect. 2010 November; 118(11), A475
- ↑ Crop Fires in India NASA, United States (2013)
- 1 2 R. Kumari; A.K. Attri; L. Int Panis; B.R. Gurjar (April 2013). "Emission estimates of Particulate Matter and Heavy Metals from Mobile sources in Delhi (India)". J. Environ. Science & Engg. 55 (2): 127–142.
- ↑ Matthew Barth; Kanok Boriboonsomsin (November 2009). "Real-World CO2 Impacts of Traffic Congestion". Transportation Research Record: Journal of the Transportation Research Board. 2058: 163–171. doi:10.3141/2058-20.
- ↑ "Gridlocked Delhi: six years of career lost in traffic jams". India Today. September 5, 2010.
- ↑ "50% Bangalore kids hit by asthma". The Times Of India. 6 November 2007.
- ↑ "Country Analysis Brief: India". U.S. Energy Information Administration. 2011.
- ↑ "India: Greenhouse Gas Emissions 2007, see page viii-ix" (PDF). Ministry of Environment and Forests, Government of India. 2010.
- ↑ "Lau's report on Aerosol effects in South Asia, NASA". Nasa.gov. Retrieved 2013-10-21.
- 1 2 http://www.livemint.com/Home-Page/Rz6u3kb13mDuXNzezwagAI/Emission-panel-for-panIndia-shift-to-Bharat-Stage-V-fuel-by.html
- ↑ "NATIONAL AIR QUALITY MONITORING PROGRAMME". Ministry of Environment & Forests, Government of India. 2011.
- ↑ Burke, Jason (24 September 2015). "India's doctors blame air pollution for sharp rise in respiratory diseases". The Guardian. Retrieved 4 December 2015.
- ↑ Madhok, Madhok (16 October 2014). "Here is why India has no clue how bad its air pollution problem is". Quartz India. Retrieved December 4, 2015.
Further reading
- Sengupta, Ramprasad; Mandal, Subrata. "Health Damage Cost of Automotive Air Pollution : Cost Benefit Analysis of Fuel Quality Upgradation for Indian Cities" (PDF). Retrieved 22 July 2014.
- Cropper, Maureen (June 2012). "The Health Effects of Coal Electricity Generation in India" (PDF). Retrieved 22 July 2014.