African admixture in Europe
African admixture in Europe refers to the Eurasian presence of Human genetic polymorphisms, which are considered to be evidence for movements of people from Africa to Eurasia in both the prehistoric and historic past.[1] Although low levels of both North and Sub-Saharan admixture are present throughout the European continent, recent genetic studies conclude that significantly higher levels of admixture exist in areas of the Iberian peninsula, (notably Portugal and Southern and Western Spain) than in the rest of the continent.
Geographical influences
At the Suez, Eurasia is connected to Africa forming a single land mass. The Nile river valley, which runs from East Africa to the Mediterranean Sea could have served as a bidirectional corridor in the Sahara desert, that allows communication between Sub-Saharan Africa with the peoples of Eurasia.[2]
Migratory times and vectors
First settlers
According to the leading evolutionary theory of human origins, known as the Out of Africa theory, anatomically-modern humans first emerged in Africa 150,000-200,000 years ago. All non-Africans are descended from at least one group of humans who migrated out of Africa into western Asia 50,000-70,000 years ago. The first modern humans in Europe, the Cro-Magnon, was first found in southern Italy, and may have completely replaced the previous inhabitants, the Neanderthals, or mixed into them through mutual cooperation. Cro-Magnons were in the Middle East (Lebanon) by 45,000 years ago and in Eastern Europe by 40,000 years ago. By 30,000 years ago, the Cro-Magnon people had populated much of Europe. This was however not the last major human migration into Europe and this paleolithic population was to some extent replaced by later migrations to be discussed below.
Duration within refuges
During the Last Glacial Maximum, a period between 25,000 and 19,000 years ago, large ice sheets over a kilometer thick covered much of Northern Europe, making the region uninhabitable to humans. It is believed that human populations retreated south to warmer regions near the Mediterranean. Refuges during this period are believed to have been in Iberia, the Balkans and Italy.[3]
DNA evidence suggests that during the Last Glacial Maximum, there was some gene flow from Africa into Iberia. After the Last Glacial Maximum, when the European climate warmed up, the refuges are thought to have been the source from which Europe was repopulated. African lineages that had been introduced into the Iberian refuge would have then dispersed all over Europe with the Northward expansion of humans. This could explain the presence of genetic lineages in Eastern Europe and as far north as Russia, that appear to have prehistoric links to Northwest and West Africa (see mtDNA).[4] The expansion of human populations from Iberian refuges is also believed to have moved back to Northwest Africa.[5]
Neolithic to the end of the prehistoric
The change from hunting and gathering to agriculture during the Neolithic Revolution was a watershed in world history. The societies that first made the change to agriculture are believed to have lived in the Middle East around 10,000 BCE. Agriculture was introduced into Europe by migrating farmers from the Middle East.[6] According to the demic diffusion model, these Middle Eastern farmers either replaced or interbred with the local hunter-gather populations that had been living in Europe since the "out of Africa" migration.[7]
It has been suggested that the first Middle Eastern farmers had North African influences.[8] There have been suggestions that some genetic lineages found in the Middle East arrived there during this period.[9] The first Agricultural societies in the Middle East are generally thought to have emerged after and maybe from the Natufian Culture from 12,000 BCE-10,000 BCE, which was widely semi-sedentary before the introduction of agriculture. An important migration from North Africa across the Sinai also appears to have occurred before the formation of the Natufian.
Historic period
In historical times, there has been a period of North African influence in Southern Europe, especially Iberia and Sicily during various Muslim conquests. The genetic effect of this period on modern European populations is the subject of discussion (see below). In more recent history, the peoples of Europe and Africa came into contact during the exploration and colonization of Africa and as a consequence of the Atlantic slave trade.[10]
Assessing African genetic contributions in non-Africans
The evolutionary forces that contribute to patterns of human genetic variation include new mutations, natural selection, sexual selection, genetic drift, population bottlenecks, founder effects, isolation by distance, genetic admixture and barriers to gene flow. The most influential factors affecting human genetic variation are founder effects and isolation by distance.[11][12]
Founder effect occurs when a population is established by a small number of individuals who have departed from a much larger population. Several generations after the population has expanded, individuals will still possess the limited gene pool of the founders. Therefore, founder effects result in a loss of genetic diversity. Genetic evidence suggests that the out of Africa migration involved only small number of individuals. The African migrants carried a small subset of the prehistoric African genetic diversity, resulting in a founder effect of the Non-African population. As humans spread across the globe populating Eurasia, Australia and the Americas, there were several founder effects. As a result of these serial founder effects, genetic diversity tends to decrease with distance from Africa.[11][12]
The other big factor contributing to patterns of human genetic variation is "Isolation by distance". According to this model populations that live near each other are more likely to exchange mates than populations that live further apart. As a result, populations that live near each other are genetically more similar than populations that live far apart.
| Africa | Oceania | East Asia | Europe | |
|---|---|---|---|---|
| Oceania | 24.7 | |||
| East Asia | 20.6 | 10 | ||
| Europe | 16.6 | 13.5 | 9.7 | |
| America | 22.6 | 14.6 | 8.9 | 9.5 |
Genetic distance is a measure used to compare the genetic relationship between populations. It is based on the principle that populations that share similar frequencies of a trait are closer relations than populations that have different frequencies of a trait. The genetic distance between two populations increases linearly with the geographic distance between the two populations due to isolation by distance and serial founder effects.[11][12]Genetic admixture increases the genetic diversity of a population. When admixture occurs between populations, the genetic distance between the two populations is reduced.
Cavalli-Sforza (1997) applied genetic distance measures to various populations around the world to infer phylogenetic relationships (see Table on the right). All non-African populations are more closely related to each other (i.e. short genetic distance) than they are to African populations. This is consistent with a founder effect of the non-African population in that only a few individuals participated in the initial out of Africa migration. The largest genetic distances observed are between Africa and Oceania and between Africa and the Americas. This is consistent with the isolation by distance and serial founder effects.
Cavalli-Sforza (1997) suggests that the genetic distance between Sub-Saharan Africa and Europe is anomalously lower than it should be if the two populations have been evolving independently. The study suggests that the lower genetic distance between Europe and Africa can be explained by genetic admixture.
Defining African admixture
Generally lineages used to characterize African admixture are those that are specific to Africa. Some DNA polymorphisms are shared by Europeans, West Asians, North Africans and Sub-Saharan Africans. Examples of such variants include the y-chromosomal haplogroup E1b1b and mitochondrial haplogroup M1.[10]
This sharing of polymorphisms is the result of long distance movements of peoples between Sub-Saharan Africa and Eurasia that involved traversing North Africa and sometimes the Middle East. Consequently, the definitions of "African", "Sub-Saharan African" and "North African" will depend on the time frame of reference or the semantic preferences of any particular scientist. Due to prehistoric migrations in and out of Africa, North African populations tend to exhibit allele frequencies that are intermediate between Sub-Saharan Africa and Eurasia.[13][14] Due to this complex genetic profile of Africa, African admixture in Europe could be the result of direct contact with Sub-Saharan Africans or indirectly through contact with North Africans with Sub-Saharan affiliations.
In some cases, lineages found in Africa and Europe may have a common origin in Asia (for example Y haplogroups R1, T) and Haplogroup U. One clade of haplogroup U, U6a1 is known to have expanded from North and East Africa back into Europe[15][16] even though haplogroup U6 is considered to have originated in the Middle East. Other lineages are known to have moved from Europe directly into Africa, for example mitochondrial haplogroups H1, H3.[5][17] Such back migrations between Africa and Eurasia also complicate defining admixture.
Y-DNA
One proposed example of Holocene gene flow from Africa to Europe, via the Middle East, is thought to be E1b1b1, which is thought to have emerged about 22,000 years ago in East Africa and branches of it are thought to have migrated to the Middle East by 11,000 years ago during the late Pleistocene or early Neolithic periods.[9]
Entering the late mesolithic Natufian culture, the E1b1b1a2 (E-V13) sub-clade has been associated with the spread of farming from the Middle East into Europe either during or just before the Neolithic transition. E1b1b1 lineages are found throughout Europe but are distributed along a South-to-North cline, with an E1b1b1a mode in the Balkans.[1][18][19]In separate migrations, E lineages in the form of the E1b1b1b subclade appear to have entered Europe from Northwest Africa into Iberia. In a sample of European males, Cruciani et al. observed Haplogroup E at a frequencies of 7.2%. The timing of this movement has been given widely variant estimates.[20]
A big expansion of peoples throughout Sub-Saharan Africa occurred after the introduction of agriculture 5,000 years ago. During the Bantu expansion people carrying Haplogroup E(not including E1b1b) lineages dispersed across much of Sub-Saharan Africa from their homeland near the border between Nigeria and Cameroon. The haplogroup most often associated with this expansion is E1b1a, which constitutes up to 48% of the African male gene pool. The presence of E1b1a lineages outside Africa can typically be associated with events that occurred after the Bantu Expansion, such as the trade in African slaves or the Moorish occupation of Iberia. In much of Europe frequencies of E lineages which are not E1b1b are very low, usually less than 1%. For example, Cruciani et al. 2004, report such lineages at 2% in Southern Portugal, 4% in Northern Portugal, 2.9% in Istanbul and 4.3% among Turkish Cypriots. E1b1a is closely related to E1b1b, the most frequent clade in Europe. E lineages that are not E1b1a or E1b1b could therefore reflect either a recent expansion associated with E1b1a or ancient population movements associated with E1b1b. For example, haplogroup E1a lineages have been detected in Portugal (5/553 = 1%),[21] among Italians in Calabria (1/80=1.3%) and among Albanians in Calabria (2/68=2.9%).[18] According to a study by Goncalves et al. (2005), The distribution of Haplogroup E1a lineages in Portugal was independent of the distribution of the younger and more ubiquitous E1b1a. The authors suggest that this distribution is consistent with a prehistoric migration from Africa to Iberia, possibly alongside mtDNA haplogroup U6.
Haplogroups A and B are thought to have been the predominant haplogroups in Central and Southern Africa prior to the Bantu Expansion. Currently these haplogroups are less common than E lineages. In a sample of 5,000 African men, haplogroup A had a frequency of 5%. Haplogroup A has rare occurrences in Europe but recently the haplogroup was detected in seven males with the same surname who were in Britain.[22]
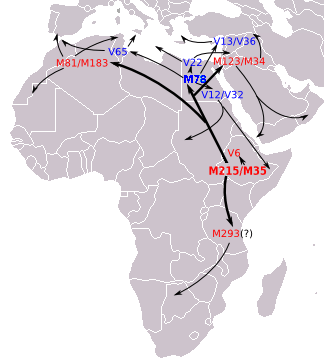
The sub-clade E3b1 (probably originating in eastern Africa) has a wide distribution in sub-Saharan Africa, Middle East and Europe. This haplogroup, in Italy, is represented by E-M78, E-M123 and E-M81 - (Figure: 3)[23] and reaches a frequency of 8% in the North and Center and slightly higher in the South of Italy, 11%.[23]
It has also been argued that the European distribution of E3b1 is compatible with the Neolithic demic diffusion of agriculture; thus, two sub-clades, E3b1a-M78 and E3b1c-M123 present a higher occurrence in Anatolia, the Balkans and the Italian peninsula. Another sub-clade, E3b1b-M81 is associated with the Berber populations and is commonly found in regions that have had historical gene flow with Northern Africa, such as the Iberian peninsula, including the Canary Islands, and Sicily.[23]
In Portugal sub-Saharan Y-DNA xE3b was found at a total of 3.0% (N. Portugal 4.0% / S. Portugal 2.0%) and 1.6% in Sardinia. Genetic marker xE3b is the highest Y-DNA marker in sub-Saharan West-Africa and was absent (0%) in Sicilians and all other European groups.
North African Y-DNA E-M81 was found at total of 41.1% among Pasiegos from Cantabria, Spain. That's the highest frequency observed so far in Europe[24]
In Sardinia sub-Saharan Y-DNA lineages A1b1b2b and E1a1 were found at a total of 1.0% (A1b1b2b 0.5% / E1a1 0.5%).[25] In the 2013 study by Alessio Boattini et al. sub-Saharan Y-DNA lineage E1a was found at a total of 1.2% in Sardinia.[26]
In Majorcans sub-Saharan Y-DNA lineage E-V38 was found at a total of 3.2% (2/62).[27]
Sub-Saharan Y-DNA lineages E3a, E1, BC*, DE*(xE3) and E3* are found between 1 and 5% in Portugal, Valencia, Majorca, Cantabria, Málaga, Seville and Galicia (Spain).[28][29]
mtDNA
Haplogroup L lineages are relatively infrequent (1% or less) throughout Europe with the exception of Iberia (Spain and Portugal) where frequencies as high as 22% have been reported and some regions of Italy where frequencies as high as 2% and 3% have been found. According to a study in 2012 by Cerezo et al., about 65% of the European L lineages most likely arrived in rather recent historical times (Romanization period, Arab conquest of the Iberian Peninsula and Sicily, Atlantic slave trade) and about 35% of L mtDNAs form European-specific subclades, revealing that there was gene flow from sub-Saharan Africa toward Europe as early as 11,000 yr ago.[30]
| Map (in the link) [31] showing the distribution of sub-Saharan mtDNA (shown in red) in Europe Map is From Cerezo et al. 2012 [32] Universidad de Santiago de Compostela Iberia (Spain & Portugal) having the highest amount and strongest concentration of sub-Sahran mtDNA in Europe.[31] |
In Iberia the mean frequency of Haplogroup L lineages reaches 3.83% and the frequency is higher in Portugal (5.83%) than in Spain (2.9% average) and without parallel in the rest of Europe. In both countries frequencies vary widely between regions with increase frequencies observed for Madeira (Portugal), Southern Portugal, Cordoba (Southern Spain) and North Western Castile (Spain).[33] In the Autonomous regions of Portugal, L haplogroups constituted about 13% of the lineages in Madeira, significantly more than in the Azores.[34] In the Spanish archipelago of Canary Islands, frequencies have been reported at 6.6%.[34] Regarding Iberia, current debates are concerned with whether these lineages are associated with prehistoric migrations, the Islamic occupation of Iberia or the slave trade. Pereira et al. (2000) suggested that African lineages in Iberia were predominantly the result of Atlantic Slave Trade. Gonzalez et al. (2003) revealed that most of the L lineages in Iberia matched Northwest African L lineages rather than contemporary Sub-Saharan L lineages. The authors suggest this pattern indicates that most of the Sub-Saharan L lineages entered Iberia in prehistoric times rather than during the slave trade. According to Pereira et al. (2005), the sub-Saharan lineages found in Iberia matched lineages from diverse regions in Africa. They suggest this pattern is more compatible with recent arrival of these lineages after slave trading began in the 15th century. According to the study, alternative scenarios that invoke much older and demographically more significant introductions (Gonzalez et al. (2003)) or that claim a substantial role of the Roman and/or Islamic periods on the introduction of sub-Saharan lineages seem unlikely. Casas et al. (2006) extracted DNA from human remains that were exhumed from old burial sites in Al-Andalus, Spain. The remains date to between 12th-13th century. The frequency of Sub-Saharan lineages detected in the medieval samples was 14.6% and 8.3% in the present population of Priego de Cordoba. The authors suggest the Muslim occupation and prehistoric migrations before the Muslim occupation would have been the source of these lineages. The highest frequencies of Sub-Saharan lineages found so far in Europe were observed by Alvarez et al. 2010 in the comarca of Sayago (18.2%) which is according to the authors "comparable to that described for the South of Portugal"[35][36] and by Pereira et al. 2010 in Alcacer do Sal (22%).[37]
In Italy, Haplogroup L lineages are present at lower frequencies than Iberia, and only detected in certain regions, such as between 2 and 3% in Latium, Volterra,[38] Basilicata and Sicily.[39]
In Eastern Europe, Haplogroup L lineages are present at very low frequencies. Though a high diversity of African mtDNA lineages have been detected, few lineages have accumulated enough mutations in Europe to form monophyletic clusters. Malyarchuk et al. (2005) detected only two monophyletic clusters, L1b and L3b in Russians with an estimated age no greater than 6,500 years. Malyarchuk et al. (2008) identified African L1b, L2a, L3b, L3d and M1 clades in Slavic populations at low frequencies. L1b, L3b and L3d had matches with West African populations, indicating that these lineages probably entered Europe through Iberia. One lineage L2a1a, appeared to be much older, indicating that it may have entered Europe in prehistoric times. This clade was possibly related to L2a1 clades identified in ten individuals of Ashkenazi heritage from France, Germany, Poland, Romania and Russia. L2a lineages are widespread throughout Africa, as a result the origins of this lineage are uncertain.[4][40]
Haplogroup M1 is also found in Europe at low frequencies. In a study by Gonzalez et al. 2007, haplogroup M1 had a frequency of 0.3%. The origins of haplogroup M1 have yet to be conclusively established. One clade of haplgroup M1, M1a is widely accepted to be of East African origin.
Haplogroup L lineages frequencies
| Country | Region | Number tested | Study | % |
| Albania | 42 | Belledi et al. (2000) | 2.38% | |
| Britain | 76 | Piercy et al. (1993) | 1.00% | |
| Finland | 50 | Sajantila et al. (1995) | 2.00% | |
| Germany | 333 | Pliss et al. (2005) | 1.20% | |
| Norway | Central Norway | 74 | Passarino et al. (2002) | 1.40%[41] |
| Norway | - | Rosenberg et al. (2002) | 1.00% | |
| Norway | - | Wilson et al. (2001) | 1.00% | |
| Italy | Countrywide | 583 | Brisighelli et al. (2012) | 1.20%[42] |
| Italy | Countrywide | 865 | Boattini et al. (2013) | 0.00%[26] |
| Italy | Countrywide | 240 | Babalini et al. (2005) | 0.40%[43] |
| Italy | Tuscany | 322 | Achilli et al. (2007) | 1.86% |
| Italy | Latium | 138 | Achilli et al. (2007) | 2.90% |
| Italy | Marche | 813 | Achilli et al. (2007) | 0.98% |
| Italy | Central Italy | 83 | Plaza et al. (2003) | 1.20% |
| Italy | Lombardy | 177 | Achilli et al. (2007) | 0.00% |
| Italy | Piedmont | 169 | Achilli et al. (2007) | 0.00% |
| Italy | Sardinia | 84 | Pereira et al. (2005) | 2.90% |
| Italy | Sardinia | 73 | Plaza et al. (2003) | 2.80% |
| Italy | Sardinia | 69 | Di Rienzo and Wilson (1991) | 2.90% |
| Italy | Sardinia (Ogliastra) | 475 | Fraumene C et al. (2003) | 0.00%[44] |
| Italy | Southern Italy | 37 | Plaza et al. (2002) | 8.10% |
| Italy | Campania (South Italy) | 313 | Achilli et al. (2007) | 0.32% |
| Italy | Basilicata (South Italy) | 92 | Ottoni et al. (2009) | 2.20% |
| Italy | Apulia & Calabria (South Italy) | 226 | Achilli et al. (2007) | 0.00% |
| Italy | Southern Italy | 115 | Sarno et al. (2014) | 0.00% |
| Italy | Sicily | 49 | Semino et al. (1989) | 4.40% |
| Italy | Sicily | 106 | Cali et al. (2003) | 0.94% |
| Italy | Sicily | 105 | Achilli et al. (2007) | 1.90% |
| Italy | Sicily | 169 | Plaza et al. (2003) | 0.60% |
| Italy | Sicily | 198 | Sarno et al. (2014) | 1.01% |
| Italy | Sicily | 465 | Romano et al. (2013) | 0.65%[45] |
| South Iberia | Spain & Portugal | 310 | Casas et al. (2006) | 7.40% |
| Spain | Countrywide | 312 | Alvarez et al. (2007) | 2.90% |
| Spain | Central Spain | 50 | Plaza et al. (2003) | 4.00% |
| Spain | North-West Spain | 216 | Achilli et al. (2007) | 3.70% |
| Spain | Galicia | 92 | Pereira et al. (2005) | 3.30% |
| Spain | Zamora | 214 | Alvarez et al. (2010) | 4.70% |
| Spain | Sayago | 33 | Alvarez et al. (2010) | 18.18% |
| Spain | Cordoba | 108 | Casas et al. (2006) | 8.30% |
| Spain | Huelva | 135 | Hernandez et al. (2014) | 5.70% |
| Spain | Valencia | 30 | Plaza et al. (2003) | 3.40% |
| Spain | Catalonia | 101 | Alvarez-Iglesias et al. (2009) | 2.97% |
| Spain | Balearic Islands | 231 | Picornell et al. (2005) | 2.20% |
| Spain | Canary Islands | 300 | Brehm et al. (2003) | 6.60% |
| Portugal | Countrywide | 594 | Achilli et al. (2007) | 6.90% |
| Portugal | Countrywide | 1429 | Barral-Arca et al. (2016) | 6.16% |
| Portugal | Countrywide | 549 | Pereira et al. (2005) | 5.83% |
| Portugal | North | 100 | Pereira et al. (2010) | 5.00% |
| Portugal | Center | 82 | Pereira et al. (2010) | 9.70% |
| Portugal | South | 195 | Brehm et al. (2003) | 11.30% |
| Portugal | South | 303 | Achilli et al. (2007) | 10.80% |
| Portugal | Coruche | 160 | Pereira et al. (2010) | 8.70% |
| Portugal | Pias | 75 | Pereira et al. (2010) | 3.90% |
| Portugal | Alcácer do Sal | 50 | Pereira et al. (2010) | 22.00% |
| Portugal | Azores | 179 | Brehm et al. (2003) | 3.40% |
| Portugal | Madeira | 155 | Brehm et al. (2003) | 12.90% |
| Portugal | Madeira | 153 | Fernandes et al. (2006) | 12.40% |
| Greece | Crete | 202 | Achilli et al. (2007) | 0.99% |
| Cyprus | Cyprus | 91 | Irwin et al. (2008) | 3.30% |
A similar study by Auton et al. 2009, which also contains an admixture analysis chart but no cluster membership coefficients, shows little to no sub-Saharan African influence in a wide array of European samples, i.e. Albanians, Austrians, Belgians, Bosnians, Bulgarians, Croatians, Cypriots, Czechs, Danes, Finns, Frenchmen, Germans, Greeks, Hungarians, Irish, Italians, Kosovars, Latvians, Macedonians, Netherlanders, Norwegians, Poles, Portuguese, Romanians, Russians, Scots, Serbians, Slovakians, Slovenians, Spaniards, Swedes, Swiss (German, French and Italian), Ukrainians, United Kingdom and Yugoslavians.[46]
Haplogroup U6 to which a North African origin has been attributed (Rando et al. 1998) is largely distributed among Mozabites (28.2%) and Mauritanians (20%). In other NW Africans, the frequency of U6 ranges from 4.2% in Tunisians to 8% in Moroccan Arabs (Plaza et al. 2003). In Europe, U6, is most common in Spain and Portugal.[47]
Haplogroup U6 lineages frequencies
| Country | Region | Number tested | Study | % |
| Italy | Countrywide | 583 | Brisighelli et al. (2012) | 0.8% |
| Italy | Countrywide | 240 | Babalini et al. (2005) | 1.25%[43] |
| Italy | Mainland | 411 | Plaza et al. (2003) | 0.0% |
| Italy | Countrywide | 865 | Boattini et al. (2013) | 0.35% |
| Italy | Sicily | 169 | Plaza et al. (2003) | 0.6% |
| Italy | Sicily | 106 | Maca-Meyer et al. (2003) | 0.94% |
| Italy | Volterra (Tuscany) | 114 | Achilli et al. (2007) | 0.00% |
| Italy | Murlo (Tuscany) | 86 | Achilli et al. (2007) | 1.20% |
| Italy | Casentino (Tuscany) | 122 | Achilli et al. (2007) | 0.80% |
| Italy | Sicily | 105 | Achilli et al. (2007) | 0.95% |
| Italy | Latium | 138 | Achilli et al. (2007) | 0.00% |
| Italy | Lombardy | 177 | Achilli et al. (2007) | 0.00% |
| Italy | Piedmont | 169 | Achilli et al. (2007) | 0.00% |
| Italy | Marche | 813 | Achilli et al. (2007) | 0.25% |
| Italy | Campania | 313 | Achilli et al. (2007) | 1.28% |
| Italy | Apulia-Calabria | 226 | Achilli et al. (2007) | 1.33% |
| Italy | Sardinia | 370 | Achilli et al. (2007) | 0.27% |
| Spain | Central Spain | 50 | Plaza et al. (2003) | 2.0% |
| Spain | Galicia | 103 | Plaza et al. (2003) | 1.9% |
| Spain | Galicia | 135 | Maca-Meyer et al. (2003) | 2.2% |
| Spain | Catalonia | 118 | Maca-Meyer et al. (2003) | 1.6% |
| Spain | Huelva | 135 | Hernandez et al. (2014) | 8.8% |
| Spain | Maragatos | 49 | Maca-Meyer et al. (2003) | 8.1% |
| Spain | Canary Islands | 300 | Brehm et al. (2003) | 14.0% |
| Portugal | Countrywide | 54 | Plaza et al. (2003) | 5.6% |
| Portugal | North Portugal | 184 | Maca-Meyer et al. (2003) | 4.3% |
| Portugal | Central Portugal | 161 | Brehm et al. (2003) | 1.9% |
| Portugal | Madeira | 155 | Brehm et al. (2003) | 3.9% |
| Portugal | Madeira | 153 | Fernandes et al. (2006) | 3.3% |
| Iberia | Spain & Portugal | 887 | Plaza et al. (2003) | 1.8% |
Admixture
- A 2011 study by Moorjani et al. found that almost all Southern Europeans have inherited 1%–3% Sub-Saharan ancestry (3.2% in Portugal, 2.9% in Sardinia, 2.7% in Southern Italy, 2.4% in Spain and 1.1% in Northern Italy) with an average mixture date of around 55 generations ago, "consistent with North African gene flow at the end of the Roman Empire and subsequent Arab migrations".[48]
The finding of African ancestry in Southern Europe dating to ~55 generations ago, or ~1,600 years ago assuming 29 years per generation, needs to be placed in historical context. The historical record documents multiple interactions of African and European populations over this period. One potential opportunity for African gene flow was during the period of Roman occupation of North Africa that lasted until the early 5th century AD, and indeed tomb inscriptions and literary references suggest that trade relations continued even after that time. North Africa was also a supplier of goods and products such as wine and olive oil to Italy, Spain and Gaul from 200–600 AD, and Morocco was a major manufacturer of the processed fish sauce condiment, garum, which was imported by Romans. In addition, there was slave trading across the western Sahara during Roman times. Another potential source of some of the African ancestry, especially in Spain and Portugal, is the invasion of Iberia by Moorish armies after 711 AD. If the Moors already had some African ancestry when they arrived in Southern Europe, and then admixed with Iberians, we would expect the admixture date to be older than the date of the invasion, as we observe.— Moorjani et al. 2011
- Measures of genetic distance between Europe and Sub-Saharan are generally smaller than Genetic distances between Africa and other continental populations. Cavalli-Sforza states that the relatively short genetic distance is likely due to prehistoric admixture.[49]
- A 2009 study by Auton et al. found a North-South Cline of Hapmap Yoruba haplotypes (YRI) in Europe. The study determined that South and Southwest subpopulations had the highest proportion of YRI. This distribution is indicative of recurrent gene flow into Europe from the Southwest and the Middle East. The authors suggest that the haplotype sharing between Europe and the YRI are suggestive of gene flow from Africa, albeit from West Africa and not necessarily North Africa.[46]
- A 2007 study conducted at Penn State University found low levels of African admixture(2.8-10%) that were distributed along a North South cline. The authors suggest that the distribution of this African admixture mirrors the distribution of haplogroup E3b-M35(E1b1b).[note 3][50]
- A principal component analysis of data from Human Genome Diversity Project by Reich et al. detected a West-to-East gradient of Bantu related ancestry across Eurasia. The authors suggest that after the Out of Africa migration, there was most likely a later Bantu-related gene flow into Europe.[51]
- The most recent study regarding African admixture in Iberian populations was conducted in April 2013 using genome-wide SNP data for over 2000 individuals, concluding that Spain and Portugal hold significantly higher levels of North African than the rest of the European continent. Estimates of shared ancestry averaged between 4 and 20% whereas these did not exceed 2% in other western or southern European populations. However, contrary to past autosomal studies and to what is inferred from Y-Chromosome and Mitochondrial Haplotype frequencies(see below), it does not detect significant levels of Sub-Saharan ancestry in any European population outside the Canary Islands.[52]
- A panel of 52 SNPs was genotyped in 435 Italian individuals according to Sánchez et al.[53] in order to estimate the proportion of ancestry from a three-way differentiation: sub-Saharan Africa, Europe and Asia. Indicated an autosomal basal proportion of sub-Saharan ancestry that is higher (9.2%, on average) than other central or northern European populations (1.5%, on average). The amount of African ancestry in Italians is however more comparable to (but slightly higher than) the average in other Mediterranean countries (7.1%).[23]
- A 2009 autosomal study by Moorjani et al. that used between 500K and 1.5 Million SNPs estimated that the proportion of sub-Saharan African ancestry is 2.4% in Spain, and 1.9% in Greece. According to the authors, this is consistent in the case of Spain, with the historically known movement of individuals of North African ancestry into Iberia, although it is possible that this estimate also reflects a wider range of mixture times.[54] Another study by the same author in 2011[55] that analyzed genome-wide polymorphism data from about 40 West Eurasian groups showed that "almost all Southern Europeans have inherited 1%–3% African ancestry with an average mixture date of around 55 generations ago, consistent with North African gene flow at the end of the Roman Empire and subsequent Arab invasion". According to the authors, application of f4 Ancestry Estimation, a method which produces accurate estimates of ancestry proportions, even in the absence of data from the true ancestral populations,[56] suggests that the "highest proportion of African ancestry in Europe is in Iberia (Portugal 3.2±0.3% and Spain 2.4±0.3%), consistent with inferences based on mitochondrial DNA and Y chromosomes and the observation by Auton et al. that within Europe, the Southwestern Europeans have the highest haplotype-sharing with Africans".[46] The authors found the following Sub-Saharan African admixture proportions in Europe using f4 Ancestry Estimation :
Population Sub-Saharan African (>1%°) African American 79.4% Portugal 3.2% Spain 2.4% S. Italy 2.7% Greece 1.9% Sardinia 2.9% N. Italy 1.1% Sephardic Jews 4.8% Ashkenazi Jews 3.2% - From the same study estimates of Sub-Saharan African admixture proportions in Europe using STRUCTURE :
Population Sub-Saharan African (>0.1%°) African American 77.2% Portugal 2.1% Spain 1.1% S. Italy 1.7% N. Italy 0.2% Sardinia 0.2% Sephardic Jews 4.3% Ashkenazi Jews 2.6%
- The Spanish population may harbor some African-related admixture representing a fourth wave of migration into Europe, but affecting Spain much more than the other groups. The Spanish population showing an African admixture of 14.8% (12.6% Mozabite and 2.2% Mbuti/Yoruba), confirming that gene flow from Sub-Saharan or North African populations has occurred in the Spanish sample.[57]
- An autosomal study in 2011 found an average Northwest African influence of about 17% in Canary Islanders with a wide interindividual variation ranging from 0% to 96%. According to the authors, the substantial Northwest African ancestry found for Canary Islanders supports that, despite the aggressive conquest by the Spanish in the 15th century and the subsequent immigration, genetic footprints of the first settlers of the Canary Islands persist in the current inhabitants. Paralleling mtDNA findings, the largest average Northwest African contribution was found for the samples from La Gomera.[58]
Canary Islands and mainland Iberians N Average
NW African
ancestryLa Gomera 7 42.50% Fuerteventura 10 21.60% La Palma 7 21.00% El Hierro 7 19.80% Lanzarote 13 16.40% Tenerife 30 14.30% Gran Canaria 30 12.40% Total Canary Islanders 104 17.40% Total Canary Islanders from the Spanish DNA bank 15 12.60% Mainland Iberians 77 5.00%
GM immunoglobulin allotypes
Further studies have shown the presence of haplotype GM*1,17 23' 5* in southern Europe. This haplotype is considered a genetic marker of subSaharan Africa, where it shows frequencies of about 80%.[59] Whereas in non-Mediterranean European populations that value is about 0.3%, in Spain the average figure for this African haplotype is nearly eight times greater(though still low levels) at 2.4% and it shows a peak at 4.5% in Galicia.[60] Values of around 4% have also been found in Huelva, in the Aran valley in the Pyrenees.[61] According to Calderon et al. 2007, although some researchers have associated African traces in Iberia to Islamic invasions, the presence of GM*1,17 23' 5* haplotype in Iberia may in fact be due to more ancient processes as well as more recent ones through the introduction of genes from black slaves from Africa.[60]
In Sicily the African haplotype Gm 5*;1;17; ranges from 1.56% at Valledolmo to 5.5% at Alia[62] with the Hypothesis: The presence of this haplotype suggests past contacts with peoples from North Africa. The introduction of African markers could be due to the Phoenician colonization at the end of the 2nd millennium b.c. or to the more recent Arab conquest (8th–9th centuries a.d.).
Sickle cell trait
Sickle cell genes of African origin have been detected in Europe, mostly in the Mediterranean region. The sickle cell trait is associated with resistance to malaria. Individuals with one copy of the sickle cell gene, heterozygotes, have higher resistance to malaria than individuals with no sickle cell genes. In regions affected by malaria, the fertility of sickle cell heterozygotes will be higher than average. Individuals with two copies of the sickle cell gene, homozygotes, will be affected by sickle cell disease and historically have had lower than average fertility. The sickle cell trait is thus an example of heterozygote advantage which is subject to balancing selection. When the sickle cell trait is introduced into a region affected by malaria, balancing selection will on one hand act to increase the frequency of the trait to counter malaria. On the other hand, if the frequency of the trait in the population becomes high enough so that homozygotes with sickle cell disease become common, balancing selection will act to limit the spread of the trait. Therefore, in regions affected by malaria, the sickle cell trait is maintained at intermediate frequencies relative to the incidence of malaria.
In Africa, malaria is believed to be one of the most important factors that contributed to restricting population growth in prehistoric times. Sickle cell mutations are believed to have occurred independently at least five times. Four variants are of African origin and one of Indian/Arabian origin. The African variants are referred to as Cameroon, Senegal, Benin and Bantu. The emergence of the sickle cell trait would have contributed to population expansion, with the emergence of farming into tropical regions where malaria was endemic.
Archeological and historical evidence suggest that the malaria had been endemic in the Mediterranean regions of Europe in historical times.[63] In Eastern Mediterranean regions, such as Italy, Greece, Albania and Turkey the Benin haplotype is the most frequent sickle cell variant. The Benin haplotype is also the most frequent variant in the Middle East and has been observed in Syrians, Palestinians, Israeli Arabs, Israeli Jews[64] and Western Saudi Arabians. This suggests that the Benin haplotype may have expanded from West Africa into North Africa and then into the Middle East and Europe. The spread of the Benin haplotype to the Mediterranean region has been associated with various events including Late Stone Age expansions from West Africa into North Africa, the trans-Saharan trade and the Arab Slave Trade.[65] The occurrence of sickle cell trait is particularly high in Sicily where frequencies of 13% have been reported.[66][67] Portugal is the only region in Europe where the Senegal and Bantu haplotypes are frequent. These may be associated with Portuguese naval exploits, including the Atlantic Slave Trade and the colonization of various African countries.[68]
In Europe, the highest prevalence of the disease has been observed in France as a result of population growth in African-Caribbean regions of overseas France, and now immigration essentially from North and sub-Saharan Africa to mainland France.[69] SCD has become the most common genetic disease in this country. In 2010, 31.5% of all newborns in mainland France had parents originated from a region defined "at risk" (mainly Africa and Overseas departments and territories of France) and were screened for SCD. The Paris metropolitan district (Île-de-France) is the region that accounts for the largest number of at-risk. Indeed, 60% of all newborns in this area in 2010 had parents originated from a region defined as "at-risk" and were screened for SCD. The second largest number of at-risk is in Provence-Alpes-Côte d'Azur at nearly 43.2% and the lowest number is in Brittany at 5.5%.[70][71]
Paleoanthropology
The migration of farmers from the Middle East into Europe is believed to have significantly influenced the genetic profile of contemporary Europeans. Some recent studies have focused on corroborating current genetic data with the archeological evidence from Europe, the Middle East and Africa.[20] The Natufian culture which existed about 12,000 years ago in Palestine, has been the subject of various archeological investigations as the Natufian culture is generally believed to be the source of the European and North African Neolithic.
According to a hypothesis stated by Bar-Yosef (1987), Natufian culture emerged from the mixing of two stone age cultures: (1) the Kebaran, a culture indigenous to the Levant and (2) the Mushabian, a culture introduced into the Levant from North Africa†. This Mushabian culture is suggested to have originated in Africa as archeological sites with Mushabian industries in the Nile Valley predate those in the Levant†. The Mushabians would have then moved into the Sinai from the Nile Delta bringing with them their technologies†. Bar-Yosef (1987) states: "the population overflow from Northeast Africa played a definite role in the establishment of the Natufian adaptation, which in turn led to the emergence of agriculture as a new subsistence system".
A study by Brace et al. (2005) analysed human remains from the Natufian culture. According to the study, there is evidence of Sub-Saharan influences in the Natufian samples. They argue that these influences would have been diluted by the interbreeding of the Neolithic farmers from the Near East with the indigenous foragers in Europe. Ricaut et al. (2008) associate the Sub-Saharan influences detected in the Natufian samples with the migration of E1b1b lineages from East Africa to the Levant and then into Europe.
† The Mushabian industry is now known to have originated in the Levant from the previous lithic industries of the region of Lake Lisan.[72] The Mushabian industry was originally thought to have originated in Africa because the microburin technique was not yet known to be much older in the eastern Levant.[73] Currently there is no known industry to connect with the African migration that occurred 14,700 years ago,[74] but it no doubt caused a population expansion in the Negev and Sinai which would not have accommodated an increase in population with the meager resources of a steppe/desert climate.[75] Since all of the known cultures in the Levant at the time of the migration originated in the Levant and an archaeological culture cannot be associated with it, there must have been assimilation into a Levantine culture at the onset, most likely the Ramonian which was present in the Sinai 14,700 years ago.[76]
See also
- Afro European
- Ancient Egyptian race controversy
- Archaeogenetics of the Near East
- Black people
- Caucasian race
- Ethnic groups in Europe
- Genetic history of Africa
- Genetic history of Europe
- Human genetic variation
- Miscegenation
- Population genetics
- Abkhazians of African descent
Notes
- ↑ Cruciani F, La Fratta R, Santolamazza P, et al. (May 2004). "Phylogeographic analysis of haplogroup E3b (E-M215) y chromosomes reveals multiple migratory events within and out of Africa". American Journal of Human Genetics. 74 (5): 1014–22. doi:10.1086/386294. PMC 1181964
 . PMID 15042509.
 Recently, it has been proposed that E3b originated in Eastern Africa and expanded into the Near East and northern Africa at the end of the Pleistocene. E3b lineages would have then been introduced from the Near East into southern Europe by migrant farmers, during the Neolithic expansion.
- ↑ Underhill PA, Passarino G, Lin AA, et al. (January 2001). "The phylogeography of Y chromosome binary haplotypes and the origins of modern human populations". Annals of Human Genetics. 65 (1): 43–62. doi:10.1046/j.1469-1809.2001.6510043.x. PMID 11415522.
A Mesolithic population carrying Group III lineages with the M35/M215 mutation expanded northwards from sub-Saharan to north Africa and the Levant. The Levantine population of farmers that dispersed into Europe during and after the Neolithic carried these African Group III M35/M215 lineages, together with a cluster of Group VI lineages characterized by M172 and M201 mutations.
- ↑ Halder I, Shriver M, Thomas M, Fernandez JR, Frudakis T (May 2008). "A panel of ancestry informative markers for estimating individual biogeographical ancestry and admixture from four continents: utility and applications". Human Mutation. 29 (5): 648–58. doi:10.1002/humu.20695. PMID 18286470.
We observed patterns of apportionment similar to those described previously using sex and autosomal markers, such as European admixture for African Americans (14.3%) and Mexicans (43.2%), European (65.5%) and East Asian affiliation (27%) for South Asians and low levels of African admixture (2.8–10.8%) mirroring the distribution of Y E3b haplogroups among various Eurasian populations.
Footnotes
- 1 2 Cruciani et al. (2004)
- ↑ Krings M, Salem AE, Bauer K, et al. (April 1999). "mtDNA analysis of Nile River Valley populations: A genetic corridor or a barrier to migration?". American Journal of Human Genetics. 64 (4): 1166–76. doi:10.1086/302314. PMC 1377841. PMID 10090902.
- ↑ Last Glacial Maximum refugia
- 1 2 Malyarchuk et al. (2008)
- 1 2 Cherni et al. (2008)
- ↑ Brace et al. (2005)
- ↑ Cavalli-Sforza (1993)
- ↑ Bar-Yosef O (1987) Pleistocene connections between Africa and Southwest Asia: an archaeological perspective. The African Archaeological Review; Chapter 5, pg 29-38.
- 1 2 Underhill and Kivisild; Kivisild, T (2007). "Use of Y Chromosome and Mitochondrial DNA Population Structure in Tracing Human Migrations". Annu. Rev. Genet. 41 (1): 539–64. doi:10.1146/annurev.genet.41.110306.130407. PMID 18076332.
- 1 2 Malyarchuk et al. (2005)
- 1 2 3 Ramachandran, S.; et al. (2005). "Support from the relationship of genetic and geographic distance in human populations for a serial founder effect originating in Africa". Proceedings of the National Academy of Sciences of the United States of America. 102 (44): 15942–7. Bibcode:2005PNAS..10215942R. doi:10.1073/pnas.0507611102. PMC 1276087. PMID 16243969.
- 1 2 3 Handley LJ, Manica A, Goudet J, Balloux F; Manica; Goudet; Balloux (September 2007). "Going the distance: human population genetics in a clinal world". Trends in Genetics. 23 (9): 432–9. doi:10.1016/j.tig.2007.07.002. PMID 17655965.
- ↑ Piancatelli, D.; et al. (2004). "Human leukocyte antigen-A, -B and -Cw polymorphism in a Berber population from North Morocco using sequence-based typing". Tissue Antigens. 63 (2): 158–72. doi:10.1111/j.1399-0039.2004.00161.x. PMID 14705987.
- ↑ Coudray, C; et al. (2009). "The Complex and Diversified Mitochondrial Gene Pool of Berber Populations". Annals of Human Genetics. 73 (2): 196–214. doi:10.1111/j.1469-1809.2008.00493.x. PMID 19053990.
- ↑ Rando JC, Cabrera VM, Larruga JM, et al. (September 1999). "Phylogeographic patterns of mtDNA reflecting the colonization of the Canary Islands". Annals of Human Genetics. 63 (5): 413–28. doi:10.1046/j.1469-1809.1999.6350413.x. PMID 10735583.
- ↑ González AM, Larruga JM, Abu-Amero KK, Shi Y, Pestano J, Cabrera VM (2007). "Mitochondrial lineage M1 traces an early human backflow to Africa". BMC Genomics. 8 (1): 223. doi:10.1186/1471-2164-8-223. PMC 1945034. PMID 17620140.
- ↑ Ennaffaa et al. (2009)
- 1 2 Semino et al. (2004)
- ↑ Underhill, P. A.; et al. (January 2001). "The phylogeography of Y chromosome binary haplotypes and the origins of modern human populations" (PDF). Annals of Human Genetics. 65 (1): 43–62. doi:10.1046/j.1469-1809.2001.6510043.x. PMID 11415522.
- 1 2 Lancaster (2009)
- ↑ Goncalves et al. (2005)
- ↑ King TE, Parkin EJ, Swinfield G, et al. (March 2007). "Africans in Yorkshire? The deepest-rooting clade of the Y phylogeny within an English genealogy". European Journal of Human Genetics. 15 (3): 288–93. doi:10.1038/sj.ejhg.5201771. PMC 2590664. PMID 17245408.
- 1 2 3 4 5 "Uniparental Markers of Contemporary Italian Population Reveals Details on Its Pre-Roman Heritage". PLoS ONE. 7: e50794. doi:10.1371/journal.pone.0050794.
- ↑ Cruciani F, La Fratta R, Santolamazza P, et al. (May 2004). "Phylogeographic analysis of haplogroup E3b (E-M215) y chromosomes reveals multiple migratory events within and out of Africa". Am. J. Hum. Genet. 74: 1014–22. doi:10.1086/386294. PMC 1181964. PMID 15042509.
- ↑ Low-Pass DNA Sequencing of 1200 Sardinians Reconstructs European Y-Chromosome Phylogeny
- 1 2 "Uniparental Markers in Italy Reveal a Sex-Biased Genetic Structure and Different Historical Strata". PLoS ONE. 8: e65441. doi:10.1371/journal.pone.0065441.
- ↑ Adams, Susan M.; Elena Bosch; Patricia L. Balaresque; Stéphane J. Ballereau; Andrew C. Lee; Eduardo Arroyo; Ana M. López-Parra; Mercedes Aler; Marina S. Gisbert Grifo; Maria Brion; Angel Carracedo; João Lavinha; Begoña Martínez-Jarreta; Lluis Quintana-Murci; Antònia Picornell; Misericordia Ramon; Karl Skorecki; Doron M. Behar; Francesc Calafell; Mark A. Jobling (4 December 2008). "The Genetic Legacy of Religious Diversity and Intolerance: Paternal Lineages of Christians, Jews, and Muslims in the Iberian Peninsula". The American Journal of Human Genetics. 83 (6): 725–736. doi:10.1016/j.ajhg.2008.11.007. PMC 2668061. PMID 19061982.
- ↑ http://www.cell.com/AJHG/fulltext/S0002-9297(08)00592-2
- ↑ http://www.nature.com/ejhg/journal/v12/n10/full/5201225a.html
- ↑ Cerezo M, Achilli A, Olivieri A, et al. (May 2012). "Reconstructing ancient mitochondrial DNA links between Africa and Europe". Genome Res. 22 (5): 821–6. doi:10.1101/gr.134452.111. PMC 3337428. PMID 22454235.
- 1 2 http://genome.cshlp.org/content/22/5/821/F1.large.jpg
- ↑ http://genome.cshlp.org/content/22/5/821.full#ref-12
- ↑ Pereira L, Cunha C, Alves C, Amorim A (April 2005). "African female heritage in Iberia: a reassessment of mtDNA lineage distribution in present times". Human Biology. 77 (2): 213–29. doi:10.1353/hub.2005.0041. PMID 16201138.
- 1 2 Brehm A, Pereira L, Kivisild T, Amorim A (December 2003). "Mitochondrial portraits of the Madeira and Açores archipelagos witness different genetic pools of its settlers". Human Genetics. 114 (1): 77–86. doi:10.1007/s00439-003-1024-3. PMID 14513360.
- ↑ Alvarez; et al. (2010). "Mitochondrial DNA Patterns in the Iberian Northern Plateau: Population Dynamics and Substructure of the Zamora Province". Am. J. Phys. Anthropol. 142: 531–9. doi:10.1002/ajpa.21252. PMID 20127843.
- ↑ As regards sub-Saharan Hgs (L1b, L2b, and L3b), the high frequency found in the southern regions of Zamora, 18.2% in Sayago and 8.1% in Bajo Duero, is comparable to that described for the South of Portugal, Alvarez et al. (2010)
- ↑ Pereira, V. N.; Gomes, V. N.; Amorim, A. N.; Gusmão, L.; João Prata, M. (September–October 2010). "Genetic characterization of uniparental lineages in populations from Southwest Iberia with past malaria endemicity". American Journal of Human Biology. 22 (5): 588–595. doi:10.1002/ajhb.21049. PMID 20737604.
- ↑ Achilli; et al. (2008). "Mitochondrial DNA Variation of Modern Tuscans Supports the Near Eastern Origin of Etruscans". Am. J. Hum. Genet. 80: 759–68. doi:10.1086/512822. PMC 1852723. PMID 17357081.
- ↑ Ottoni; et al. (2009). "Human mitochondrial DNA variation in Southern Italy". Ann. Hum. Biol. 36: 785–811. doi:10.3109/03014460903198509. PMID 19852679.
- ↑ Behar DM, Metspalu E, Kivisild T, et al. (March 2006). "The matrilineal ancestry of Ashkenazi Jewry: portrait of a recent founder event". American Journal of Human Genetics. 78 (3): 487–97. doi:10.1086/500307. PMC 1380291. PMID 16404693.
- ↑ Different genetic components in the Norwegian population revealed by the analysis of mtDNA and Y chromosome polymorphisms
- ↑ PLOS ONE: Uniparental Markers of Contemporary Italian Population Reveals Details on Its Pre-Roman Heritage
- 1 2 http://www.nature.com/ejhg/journal/v13/n8/full/5201439a.html
- ↑ "Striking differentiation of sub-populations within a genetically homogeneous isolate (Ogliastra) in Sardinia as revealed by mtDNA analysis". Human Genetics. 114: 1–10. doi:10.1007/s00439-003-1008-3.
- ↑ Romano V, Calì F, Ragalmuto A, D'Anna RP, Flugy A, De Leo G, Giambalvo O, Lisa A, Fiorani O, Di Gaetano C, Salerno A, Tamouza R, Charron D, Zei G, Matullo G, Piazza A (2003). "Autosomal microsatellite and mtDNA genetic analysis in Sicily (Italy)". Ann. Hum. Genet. 67: 42–53. doi:10.1046/j.1469-1809.2003.00007.x. PMID 12556234.
- 1 2 3 Auton A, Bryc K, Boyko AR, et al. (May 2009). "Global distribution of genomic diversity underscores rich complex history of continental human populations". Genome Research. 19 (5): 795–803. doi:10.1101/gr.088898.108. PMC 2675968. PMID 19218534.
- ↑ Maca-Meyer N, González AM, Pestano J, Flores C, Larruga JM, Cabrera VM (October 2003). "Mitochondrial DNA transit between West Asia and North Africa inferred from U6 phylogeography". BMC Genet. 4: 15. doi:10.1186/1471-2156-4-15. PMC 270091. PMID 14563219.
- ↑ Moorjani P, Patterson N, Hirschhorn JN, Keinan A, Hao L, et al. (2011). McVean G, ed. "The History of African Gene Flow into Southern Europeans, Levantines, and Jews". PLoS Genet. 7 (4): e1001373. doi:10.1371/journal.pgen.1001373. PMC 3080861. PMID 21533020.
- ↑ Bowcock AM, Kidd JR, Mountain JL, et al. (February 1991). "Drift, admixture, and selection in human evolution: a study with DNA polymorphisms". Proceedings of the National Academy of Sciences of the United States of America. 88 (3): 839–43. Bibcode:1991PNAS...88..839B. doi:10.1073/pnas.88.3.839. PMC 50909. PMID 1992475.
- ↑ Frudakis, Tony (2007). "West African ancestry in Southeastern Europe and the Middle East". Molecular photofitting: predicting ancestry and phenotype using DNA. Amsterdam: Elsevier/Academic Press. p. 326. ISBN 0-12-088492-5.
- ↑ Reich D, Price AL, Patterson N (May 2008). "Principal component analysis of genetic data". Nature Genetics. 40 (5): 491–2. doi:10.1038/ng0508-491. PMID 18443580.
- ↑ Botigué LR, Henn BM, Gravel S, Maples BK, Gignoux CR, Corona E, Atzmon G, Burns E, Ostrer H, Flores C, Bertranpetit J, Comas D, Bustamante CD (July 16, 2013). "Gene flow from North Africa contributes to differential human genetic diversity in southern Europe". Proceedings of the National Academy of Sciences of the United States of America. 110 (29): 11791–11796. doi:10.1073/pnas.1306223110. PMC 3718088. PMID 23733930.
- ↑ Sanchez JJ, Phillips C, Børsting C, Balogh K, Bogus M, Fondevila M, Harrison CD, Musgrave-Brown E, Salas A, Syndercombe-Court D, Schneider PM, Carracedo A, Morling N (2006). "A multiplex assay with 52 single nucleotide polymorphisms for human identification.". Electrophoresis. 27: 1713–24. doi:10.1002/elps.200500671. PMID 16586411.
- ↑ Characterizing the history of sub-Saharan African gene flow into southern Europe, Moorjani et al. 2009, Department of Genetics, Harvard Medical School
- ↑ Moorjani P, Patterson N, Hirschhorn JN, et al. (April 2011). McVean G, ed. "The history of African gene flow into Southern Europeans, Levantines, and Jews". PLoS Genet. 7 (4): e1001373. doi:10.1371/journal.pgen.1001373. PMC 3080861. PMID 21533020.
- ↑ Reich D, Thangaraj K, Patterson N, Price A, Singh L; Thangaraj; Patterson; Price; Singh (2009). "Reconstructing Indian population history". Nature. 461 (7263): 489–494. Bibcode:2009Natur.461..489R. doi:10.1038/nature08365. PMC 2842210. PMID 19779445.
- ↑ http://biorxiv.org/content/biorxiv/suppl/2014/04/05/001552.DC4/001552-3.pdf Ancient human genomes suggest three ancestral populations for present-day Europeans p.84-85
- ↑ Pino-Yanes M, Corrales A, Basaldúa S, Hernández A, Guerra L, et al. (2011). O'Rourke D, ed. "North African Influences and Potential Bias in Case-Control Association Studies in the Spanish Population". PLoS ONE. 6 (3): e18389. Bibcode:2011PLoSO...6E8389P. doi:10.1371/journal.pone.0018389. PMC 3068190. PMID 21479138.
- ↑ Calderón R, Ambrosio B, Guitard E, González-Martín A, Aresti U, Dugoujon JM; Ambrosio; Guitard; González-Martín; Aresti; Dugoujon (December 2006). "Genetic position of Andalusians from Huelva in relation to other European and North African populations: a study based on GM and KM allotypes". Human Biology. 78 (6): 663–79. doi:10.1353/hub.2007.0008. PMID 17564246.
- 1 2 Calderón R, Lodeiro R, Varela TA, et al. (2007). "GM and KM immunoglobulin allotypes in the Galician population: new insights into the peopling of the Iberian Peninsula". BMC Genetics. 8 (1): 37. doi:10.1186/1471-2156-8-37. PMC 1934380. PMID 17597520.
- ↑ Giraldo; et al. (2001). "GM and KM alleles in two Spanish Pyrenean populations (Andorra and Pallars Sobira): a review of GM variation in the Western Mediterranean basin". Ann. Hum. Genet. 65: 537–48. doi:10.1046/j.1469-1809.2001.6560537.x. PMID 11851984.
- ↑ Cerutti N, Dugoujon JM, Guitard E, Rabino Massa E; Dugoujon; Guitard; Rabino Massa (January 2004). "Gm and Km immunoglobulin allotypes in Sicily". Immunogenetics. 55 (10): 674–81. doi:10.1007/s00251-003-0628-z. PMID 14652700.
- ↑ Sallares R, Bouwman A, Anderung C; Bouwman; Anderung (July 2004). "The spread of malaria to Southern Europe in antiquity: new approaches to old problems". Medical History. 48 (3): 311–28. doi:10.1017/s0025727300007651. PMC 547919. PMID 16021928.
- ↑ Rund D, Kornhendler N, Shalev O, Oppenheim A; Kornhendler; Shalev; Oppenheim (October 1990). "The origin of sickle cell alleles in Israel". Human Genetics. 85 (5): 521–4. doi:10.1007/BF00194229. PMID 1977682.
- ↑ Bloom, Miriam (1995). Understanding Sickle Cell Disease. Jackson: University Press of Mississippi. ISBN 0-87805-745-5.
- ↑ Ragusa A, Frontini V, Lombardo M, et al. (August 1992). "Presence of an African beta-globin gene cluster haplotype in normal chromosomes in Sicily". American Journal of Hematology. 40 (4): 313–5. doi:10.1002/ajh.2830400413. PMID 1503087.
- ↑ Ragusa A, Lombardo M, Sortino G, Lombardo T, Nagel RL, Labie D; Lombardo; Sortino; Lombardo; Nagel; Labie (February 1988). "Beta S gene in Sicily is in linkage disequilibrium with the Benin haplotype: implications for gene flow". American Journal of Hematology. 27 (2): 139–41. doi:10.1002/ajh.2830270214. PMID 2893541.
- ↑ Monteiro C, Rueff J, Falcao AB, Portugal S, Weatherall DJ, Kulozik AE; Rueff; Falcao; Portugal; Weatherall; Kulozik (June 1989). "The frequency and origin of the sickle cell mutation in the district of Coruche/Portugal". Human Genetics. 82 (3): 255–8. doi:10.1007/BF00291165. PMID 2731937.
- ↑ Bardakdjian J, Wajcman H; Wajcman (September 2004). "[Epidemiology of sickle cell anemia]". Rev Prat (in French). 54 (14): 1531–3. PMID 15558961.
- ↑ Bardakdjian-Michau J, Bahuau M, Hurtrel D, et al. (January 2009). "Neonatal screening for sickle cell disease in France". J. Clin. Pathol. 62 (1): 31–3. doi:10.1136/jcp.2008.058867. PMID 19103855.
- ↑ BEH n°27-28/2012 / 2012 / Archives / Derniers numéros et archives / BEH - Bulletin épidémiologique hebdomadaire / Publications et outils / Accueil
- ↑ Goring-Morris, Nigel et al. 2009. The Dynamics of Pleistocene and Early Holocene Settlement Patterns in the Levant: An Overview. In Transitions in Prehistory: Essays in Honor of Ofer Bar-Yosef (eds) John J. Shea and Daniel E. Lieberman. Oxbow Books, 2009. ISBN 9781842173404.
- ↑ Olszewski, D.I. (2006). "Issues in the Levantine Epipaleolithic : The Madamaghan, Nebekian and Qalkhan (Levant Epipaleolithic)". Paléorient. 32 (1): 19–26. doi:10.3406/paleo.2006.5168.
- ↑ Cruciani, F; La Fratta, R; Santolamazza, P; et al. (May 2004). "Phylogeographic analysis of haplogroup E3b (E-M215) y chromosomes reveals multiple migratory events within and out of Africa". American Journal of Human Genetics. 74 (5): 1014–22. doi:10.1086/386294. PMC 1181964. PMID 15042509.
- ↑ Bar-Yosef, O. (1987). "Pleistocene connexions between Africa and Southwest Asia: an archaeological perspective". The African Archaeological Review. 5 (1): 29–38. doi:10.1007/BF01117080.
- ↑ Richter, Tobias; et al. (2011). "Interaction before Agriculture: Exchanging Material and Sharing Knowledge in the Final Pleistocene Levant". Cambridge Archaeological Journal. 21 (1): 95–114. doi:10.1017/S0959774311000060.
References
- Moorjani; et al. (2011). McVean, Gil, ed. "The History of African Gene Flow into Southern Europeans, Levantines, and Jews". PLoS Genetics. 7 (4): e1001373. doi:10.1371/journal.pgen.1001373. PMC 3080861. PMID 21533020.
- Brace CL, Seguchi N, Quintyn CB, et al. (January 2006). "The questionable contribution of the Neolithic and the Bronze Age to European craniofacial form". Proceedings of the National Academy of Sciences of the United States of America. 103 (1): 242–7. Bibcode:2006PNAS..103..242B. doi:10.1073/pnas.0509801102. PMC 1325007. PMID 16371462.
- Bar-Yosef, O. (1987). "Pleistocene connexions between Africa and Southwest Asia: an archaeological perspective". African Archaeological Review. 5 (1): 29–38. doi:10.1007/BF01117080.
- Casas MJ, Hagelberg E, Fregel R, Larruga JM, González AM; Hagelberg; Fregel; Larruga; González (December 2006). "Human mitochondrial DNA diversity in an archaeological site in al-Andalus: genetic impact of migrations from North Africa in medieval Spain". American Journal of Physical Anthropology. 131 (4): 539–51. doi:10.1002/ajpa.20463. PMID 16685727.
- Cavalli-Sforza LL (July 1997). "Genes, peoples, and languages". Proceedings of the National Academy of Sciences of the United States of America. 94 (15): 7719–24. Bibcode:1997PNAS...94.7719C. doi:10.1073/pnas.94.15.7719. PMC 33682. PMID 9223254.
- Cherni L, Fernandes V, Pereira JB, et al. (June 2009). "Post-last glacial maximum expansion from Iberia to North Africa revealed by fine characterization of mtDNA H haplogroup in Tunisia". American Journal of Physical Anthropology. 139 (2): 253–60. doi:10.1002/ajpa.20979. PMID 19090581.
- Cruciani F, La Fratta R, Santolamazza P, et al. (May 2004). "Phylogeographic analysis of haplogroup E3b (E-M215) y chromosomes reveals multiple migratory events within and out of Africa". American Journal of Human Genetics. 74 (5): 1014–22. doi:10.1086/386294. PMC 1181964. PMID 15042509.
- Ennafaa H, Cabrera VM, Abu-Amero KK, et al. (2009). "Mitochondrial DNA haplogroup H structure in North Africa". BMC Genetics. 10 (1): 8. doi:10.1186/1471-2156-10-8. PMC 2657161. PMID 19243582.
- Gonçalves R, Freitas A, Branco M, et al. (July 2005). "Y-chromosome lineages from Portugal, Madeira and Açores record elements of Sephardim and Berber ancestry". Annals of Human Genetics. 69 (Pt 4): 443–54. doi:10.1111/j.1529-8817.2005.00161.x. PMID 15996172.
- González AM, Brehm A, Pérez JA, Maca-Meyer N, Flores C, Cabrera VM; Brehm; Pérez; Maca-Meyer; Flores; Cabrera (April 2003). "Mitochondrial DNA affinities at the Atlantic fringe of Europe". American Journal of Physical Anthropology. 120 (4): 391–404. doi:10.1002/ajpa.10168. PMID 12627534.
- Lancaster, Andrew (2009). "Y Haplogroups, Archaeological Cultures and Language Families: a Review of the Multidisciplinary Comparisons using the case of E-M35" (PDF). Journal of Genetic Genealogy. 5 (1).
- Maliarchuk BA, Czarny J; Czarny (2005). "[African DNA lineages in mitochondrial gene pool of Europeans]". Molekuliarnaia Biologiia (in Russian). 39 (5): 806–12. doi:10.1007/s11008-005-0085-x. PMID 16240714.
- Malyarchuk BA, Derenko M, Perkova M, Grzybowski T, Vanecek T, Lazur J; Derenko; Perkova; Grzybowski; Vanecek; Lazur (September 2008). "Reconstructing the phylogeny of African mitochondrial DNA lineages in Slavs". European Journal of Human Genetics. 16 (9): 1091–6. doi:10.1038/ejhg.2008.70. PMID 18398433.
- Ricaut FX, Waelkens M; Waelkens (October 2008). "Cranial discrete traits in a Byzantine population and eastern Mediterranean population movements". Human Biology. 80 (5): 535–64. doi:10.3378/1534-6617-80.5.535. PMID 19341322.
- Pereira L, Prata MJ, Amorim A; Prata; Amorim (November 2000). "Diversity of mtDNA lineages in Portugal: not a genetic edge of European variation". Annals of Human Genetics. 64 (6): 491–506. doi:10.1046/j.1469-1809.2000.6460491.x. PMID 11281213.
- Pereira L, Cunha C, Alves C, Amorim A; Cunha; Alves; Amorim (April 2005). "African female heritage in Iberia: a reassessment of mtDNA lineage distribution in present times". Human Biology. 77 (2): 213–29. doi:10.1353/hub.2005.0041. PMID 16201138.
- Semino O, Magri C, Benuzzi G, et al. (May 2004). "Origin, diffusion, and differentiation of Y-chromosome haplogroups E and J: inferences on the neolithization of Europe and later migratory events in the Mediterranean area". American Journal of Human Genetics. 74 (5): 1023–34. doi:10.1086/386295. PMC 1181965. PMID 15069642.